Morgan Stanley’s Mike Wilson is still calling for the S&P 500 to finish 2026 at 8,000, but the route he describes is no longer the easy, broad early-cycle rally that lifted economically sensitive stocks after the market’s previous low. His latest argument is more selective: the “rolling recovery” in the U.S. economy is entering a mid-cycle phase, earnings revisions are losing momentum at the margin, semiconductor leadership has weakened, and investors are beginning to favor companies with dependable profits, strong balance sheets and credible free-cash-flow generation.
That distinction matters because the index itself has remained unusually resilient while some of its former leaders have suffered much deeper corrections. The S&P 500 stood at 7,413.18 on July 27, 2026, only modestly below its recent high, even as global chip stocks came under severe pressure. From that level, Wilson’s 8,000 year-end target implied approximately 7.9% further upside. His suggested 7,000 downside level implied a decline of roughly 5.6% from the July 27 close, followed by a potential 14.3% rebound if the index then reached 8,000.
The forecast is therefore not a claim that volatility has ended. It is a claim that the market can absorb a rotation, an inflation scare, uncertainty surrounding the Federal Reserve and a correction in artificial-intelligence hardware without ending the broader bull-market structure. Wilson’s emphasis on “quality” is the mechanism that connects those ideas. In his framework, the market is not abandoning growth. It is demanding more proof that growth produces cash, that earnings are repeatable and that balance sheets can support investment without weakening shareholder economics.
Last updated: July 28, 2026, 8:20 a.m. EDT. Market figures are dated and may have changed since publication.
Key Takeaways
- Morgan Stanley’s central forecast: Mike Wilson continues to expect the S&P 500 to reach 8,000 by the end of 2026, even if the index first retests the 7,000 area.
- The market regime is changing: Wilson argues that the early-cycle phase of the rolling recovery is ending and that investors are moving toward companies with stronger earnings quality, cash flow, margins and balance sheets.
- The index is stronger than many former leaders: The S&P 500 has held close to record territory despite sharp corrections in semiconductors, memory stocks and other AI-infrastructure beneficiaries.
- AI spending is under a new test: Strong revenue and earnings are no longer always enough. Investors increasingly want evidence that data-center and chip investment will translate into durable free cash flow.
- The Fed is a major near-term risk: The Federal Open Market Committee began a two-day meeting on July 28 with the federal-funds target range at 3.50% to 3.75% and inflation still above its 2% objective.
- The bull case is earnings-based: Second-quarter S&P 500 earnings were growing rapidly, but the aggregate figure was unusually influenced by a small number of very large companies, making breadth and revisions critical.
- The bear case is valuation and inflation: An oil shock, higher long-term yields, disappointing AI returns or weaker earnings revisions could compress valuation multiples even if nominal profits continue to rise.
Fact Box
Wilson’s S&P 500 Scenario in Numbers
- July 27, 2026 close: 7,413.18
- Proposed correction floor: 7,000
- Year-end target: 8,000
- Move from 7,413.18 to 8,000: approximately +7.9%
- Move from 7,413.18 to 7,000: approximately -5.6%
- Move from 7,000 to 8,000: approximately +14.3%
Original source: Reuters market data; percentage changes calculated from the cited index level.
What Mike Wilson Is Actually Forecasting
The most attention-grabbing part of Wilson’s argument is the 8,000 target, but the more useful part is the sequence he expects. He does not describe a straight-line advance. He allows for the S&P 500 to fall toward 7,000, considers another month or so of choppy trading plausible, and identifies Federal Reserve communication, war risk and oil prices as immediate sources of uncertainty. The target rests on the view that these shocks will interrupt rather than reverse the earnings recovery.
Wilson’s language also separates the index from the stocks that led it earlier in the cycle. Semiconductor companies, storage names and some hyperscale cloud operators can experience substantial multiple compression while the S&P 500 remains comparatively stable. That is possible because a capitalization-weighted index is not a single trade. Weakness in one highly valued group can be offset by stronger performance in consumer staples, healthcare, industrials, financial companies or profitable technology firms whose earnings are less dependent on ever-rising capital expenditure.
This is why the phrase “quality rotation” is more important than the point target. A conventional bullish forecast often assumes that the existing winners keep winning. Wilson is making a different claim: leadership can change while the index ultimately rises. In that version of the market, companies that delivered the best revenue growth during the AI infrastructure boom may not deliver the best stock returns in the next phase. Share prices already reflect expectations, and expectations can peak before reported revenue or earnings peak.
Markets frequently punish a company that reports strong results if investors had already capitalized even stronger future results into the share price. The relevant question is not simply whether earnings grew. It is whether the result exceeded the expectation embedded in the valuation, whether future estimates are still moving higher and whether the incremental dollar of investment is producing an attractive return. Wilson refers to this as the “peak rate of change”: a business can remain healthy in absolute terms while the acceleration in earnings revisions, margins or demand begins to slow.
That principle helps explain why apparently good news has sometimes produced weak stock reactions in 2026. According to FactSet’s July 24 earnings update, the blended year-over-year earnings growth rate for the S&P 500 in the second quarter was 37.9%. Yet the market was becoming less willing to reward every earnings beat, especially in technology. Strong aggregate profit growth did not eliminate concern about concentration, capital intensity or the sustainability of revisions.
Wilson’s forecast therefore has two layers. The first is an index-level view that corporate profits and economic resilience can support a higher year-end level. The second is a market-structure view that the easiest phase of owning high-beta recovery stocks and AI infrastructure leaders has passed. The second layer can be correct even if the 8,000 target is not reached, and the target can be reached even if many individual former leaders remain below their highs.
What “Quality” Means in This Market
Quality is one of the most widely used and least consistently defined words in equity investing. It can refer to a recognizable brand, a dominant market position, a high return on capital, low debt, stable earnings, conservative accounting or a stock that simply feels safe. Wilson’s description is more concrete. He emphasizes earnings stability, earnings predictability, free-cash-flow generation and balance-sheet strength. Those traits are meant to identify businesses that can keep compounding through a less forgiving part of the cycle.
There is no universal quality formula. S&P Dow Jones Indices’ quality methodology, for example, scores companies using return on equity, the accruals ratio and financial leverage. Wilson’s framework is not identical, but the overlap is clear. Both approaches favor companies whose reported profits are supported by efficient capital use and less aggressive financing.
Return on equity measures how much net income a company generates relative to shareholders’ equity. A high figure can indicate a powerful business model, but it can also be inflated by heavy debt, buybacks or a very small equity base. It is therefore more informative when considered with leverage and cash flow.
Accrual quality asks how much of reported profit is supported by cash rather than accounting entries. Earnings can legitimately exceed cash flow in a growing business because customers have not yet paid invoices or because inventory is being built. Persistent large gaps, however, can make profits less dependable. A company that repeatedly converts earnings into operating cash flow generally has more flexibility to invest, repay debt, repurchase shares or pay dividends.
Financial leverage influences both return and risk. Debt can improve shareholder returns when business conditions are favorable, but it also creates fixed obligations. When interest rates are elevated or credit becomes less available, highly leveraged companies can lose strategic flexibility exactly when competitors with stronger balance sheets are able to invest.
Free cash flow is operating cash flow after capital expenditure. It is not a perfect measure. Capital spending can create valuable assets, and cutting investment can temporarily make free cash flow look better while weakening the business. Still, free cash flow is a useful test of how much cash remains after maintaining and expanding the asset base. In an AI investment cycle defined by servers, chips, networking equipment, energy infrastructure and data centers, the distinction between accounting profit and cash available after investment has become central.
Earnings stability is especially valuable when investors become less certain about the macroeconomic path. A company with recurring revenue, resilient margins and limited refinancing needs can support a higher valuation than a company whose profits depend on commodity prices, one-off demand or easy credit. Stability does not mean zero cyclicality. It means that the market can estimate the range of outcomes with more confidence.
Quality can appear in any sector. A paint manufacturer with pricing power, a healthcare company with recurring demand, a software provider with high retention or an industrial company with a large service business may all qualify. Conversely, a famous mega-cap company can fail the market’s current quality test if capital expenditure rises faster than operating cash flow or if the path from spending to monetization becomes less visible.
This cross-sector nature is essential. A quality rotation is not the same as a defensive rotation, although the two can overlap. Traditional defensive sectors may benefit because their earnings are less economically sensitive, but quality investors can also own cyclical businesses with strong balance sheets and durable competitive advantages. The market is selecting for financial characteristics rather than automatically abandoning growth.
The Rolling Recovery Thesis
Wilson’s “rolling recovery” thesis begins with a distinctive interpretation of the post-pandemic economy. Instead of one synchronized recession followed by one synchronized rebound, different industries went through downturns at different times. Housing, manufacturing, goods consumption, small businesses and interest-rate-sensitive sectors did not all contract together. Their weakness rotated through the economy, allowing aggregate employment and GDP to remain more resilient than recession forecasts implied.
That interpretation helps explain why recession calls repeatedly looked plausible without producing a conventional economy-wide recession. Higher interest rates hit housing and commercial real estate early. Goods demand normalized after the pandemic surge. Banks tightened lending after financial stress. Manufacturing experienced periods of contraction. Technology companies cut jobs after overhiring. Yet service employment, government spending, household balance sheets and later AI-related investment provided offsets.
By Wilson’s account, the broad market low marked the point when the final weak areas began to stabilize and earnings revisions turned higher. The early-cycle phase then rewarded companies with the greatest sensitivity to improving activity. Small companies, consumer discretionary businesses, industrial firms and financial stocks could outperform because their earnings had more room to recover from depressed levels.
The transition to mid-cycle does not mean the recovery is over. It means the comparison base becomes more demanding. Once a company has moved from falling earnings to rising earnings, the next question is whether the growth rate can remain high. Low-quality companies often rally sharply at the beginning because survival risk falls and operating leverage works in their favor. Later, investors become more discriminating about margins, cash conversion and the durability of demand.
This is a familiar pattern in business cycles. Early-cycle markets tend to favor financial leverage and economic sensitivity. Mid-cycle markets often reward companies that can continue growing after the initial rebound. Late-cycle markets become more concerned with inflation, margins and financial conditions. Wilson is not declaring that the economy is late cycle. He is arguing that the easiest early-cycle trade has already occurred and that the selection criteria are changing.
Official data provide partial support for the recovery side of the thesis. The Bureau of Economic Analysis estimated that real GDP grew at a 2.1% annualized rate in the first quarter of 2026, up from 0.5% in the fourth quarter of 2025. The unemployment rate was 4.2% in June. Those figures are not consistent with an economy in a deep recession.
The details are less uniformly strong. June payroll growth was only 57,000 on a preliminary basis, labor-force participation fell, housing remained weak and inflation was still elevated. A rolling recovery can coexist with household strain, uneven hiring and industry-specific downturns. Indeed, that unevenness is the point. The thesis should not be interpreted as a claim that every household or company is experiencing expansion.
The most powerful support has come from corporate earnings. FactSet reported that the second quarter was on track for exceptionally strong year-over-year profit growth. It also estimated that the 493 companies outside the Magnificent Seven were producing their strongest earnings growth since late 2021. That broadening is important because an index rally becomes less dependent on a small group when more companies contribute to profit growth.
Still, earnings growth can be distorted by easy comparisons, unusual items and a few large contributors. FactSet noted that excluding Alphabet would reduce the second-quarter blended S&P 500 growth rate from 37.9% to 25.9%. A 25.9% figure would remain strong, but the difference demonstrates why aggregate growth alone does not settle the debate. Investors must examine how much of the improvement is repeatable and how widely it is distributed.
Why Wilson Compares 2026 With 2021
Wilson’s 2021 comparison is not based on identical economic conditions. It is based on the shape of the market cycle. In 2021, the explosive rebound from the pandemic recession produced rapid upgrades to earnings forecasts. As the year progressed, the rate of improvement peaked. Investors moved away from some early-cycle beneficiaries and toward businesses with more dependable profitability.
The analogy is useful because stocks discount the future. Economic data and corporate results can remain strong after the market begins to anticipate slower growth. When the second derivative turns negative—growth is still positive but no longer accelerating—high-multiple stocks can struggle. The market may rotate before an earnings slowdown appears in headline data.
There are also major differences. The 2026 economy carries a much larger AI investment cycle, a different inflation problem, different fiscal policy and a geopolitical shock to energy markets. The Federal Reserve’s policy rate is far above the near-zero rate of 2021. The current S&P 500 is also more concentrated in a small number of extremely large technology and communications companies.
AI makes the comparison especially complicated. The investment boom can support growth in data centers, power equipment, semiconductors, construction and software. It can also raise productivity and margins for companies that adopt the technology effectively. Yet the same spending can suppress free cash flow at the companies funding the buildout. The benefits and costs appear in different places and on different timelines.
In 2021, many businesses were benefiting from reopening and extraordinary policy support. In 2026, the market is testing whether AI-related capital expenditure can become self-financing through cloud revenue, advertising efficiency, software subscriptions and productivity gains. The market may reward adopters that generate measurable savings while becoming less patient with infrastructure providers whose valuations assume sustained scarcity and pricing power.
The 2021 analogy is therefore best treated as a framework, not a forecast based on historical repetition. It suggests that a peak in revisions can produce a quality rotation. It does not prove that the index will follow the same path, that inflation will behave similarly or that technology leadership will recover on the same schedule.
The Earnings Backdrop: Strong Growth, Harder Comparisons
The bullish foundation of Wilson’s 8,000 target is not merely optimism about investor sentiment. It is an expectation that earnings remain strong enough to offset some valuation compression. That is a critical distinction. An index can rise because profits increase, because investors pay a higher multiple for those profits, or because both occur. Wilson’s current framework assumes that profit growth does more of the work as the market becomes less willing to expand multiples for the most crowded leaders.
The second-quarter earnings season initially offered considerable support. FactSet’s July 24 Earnings Insight put blended S&P 500 earnings growth at 37.9%, far above the five-year and ten-year averages cited in the report. Ten of eleven sectors were reporting or expected to report year-over-year earnings growth. Revenue growth was also positive, reducing the risk that the profit increase was entirely the product of cost cutting.
However, three qualifications are necessary. First, blended growth combines actual results from companies that have reported with estimates for those that have not. The number can change materially as the season progresses. Second, the comparison period matters. A company recovering from a weak quarter can post a large percentage increase without establishing a new long-term growth rate. Third, index-level earnings are heavily influenced by the largest companies.
FactSet’s calculation excluding Alphabet illustrates the concentration issue. Removing one company reduced the blended growth rate by 12 percentage points, from 37.9% to 25.9%. The lower figure was still robust, but it showed that an extraordinary aggregate number did not mean every constituent was enjoying extraordinary growth.
The Magnificent Seven remained important, but the rest of the index was contributing more than it had in prior years. FactSet estimated 31.1% earnings growth for the Magnificent Seven and 22.8% for the other 493 companies. The 493-company figure, if realized, would be the group’s strongest since the fourth quarter of 2021. That is exactly the kind of broadening Wilson’s rolling-recovery thesis requires.
Broadening does not automatically produce a broad rally. Stock returns depend on starting valuations, revisions and positioning. A company can report a 20% increase in earnings and still fall if the market expected 25%. Another company can report flat earnings and rise if investors feared a decline. The quality rotation is partly a response to this expectations problem: investors are searching for businesses where forecasts are both positive and credible.
Earnings revisions are more informative than backward-looking growth because they show how analysts are changing future forecasts. A rising revision breadth means more companies are receiving upward than downward estimate changes. Wilson has repeatedly used that measure to support the rolling-recovery argument. His caution on semiconductors reflects the belief that the revision impulse in that group has peaked, not that semiconductor earnings are about to disappear.
A peak in revisions can occur for benign reasons. Analysts may have finally caught up with strong demand, leaving less room for positive surprises. Supply constraints can ease, reducing pricing power while unit growth remains healthy. Capital spending by customers can grow at a slower rate after reaching an enormous base. Each of those conditions can produce good corporate results but weaker relative stock performance.
The earnings season also tests the difference between gross margin and free cash flow. A cloud provider may report rising revenue and operating income while capital expenditure absorbs a much larger share of operating cash. A chipmaker may report exceptional margins while customers begin to question future orders. An industrial supplier may report moderate revenue growth but convert a high share of earnings into cash. In a quality rotation, the third company can outperform despite having the least exciting headline growth.
This is not because investors have stopped caring about growth. It is because the market is assigning a higher value to growth that requires less incremental capital. A dollar of earnings produced with modest reinvestment is financially different from a dollar of earnings that requires continuous multibillion-dollar spending. The latter can still be an excellent investment if returns on capital are high, but the burden of proof is greater.
Why AI Capital Expenditure Has Become a Free-Cash-Flow Test
The AI buildout is simultaneously one of the strongest supports for the U.S. economy and one of the largest risks to current technology valuations. Federal Reserve Chair Kevin Warsh highlighted the scale of the investment in his July congressional testimony. He said equipment investment had increased about 8% over the year ending in the first quarter, while high-technology spending grew nearly 25% on a four-quarter basis. The official testimony linked the acceleration to data-center construction and demand for AI-related equipment and software.
That spending supports semiconductor manufacturers, memory producers, networking companies, utilities, electrical-equipment suppliers, construction firms and real-estate developers. It also contributes directly to business investment in GDP. The macroeconomic benefit can be real even before the ultimate commercial return is known.
For shareholders in the hyperscalers, however, the accounting is more demanding. Capital expenditure appears on the cash-flow statement rather than being fully expensed immediately. A company purchases servers or builds a data center, records the cash outflow as investment and then depreciates the asset over time. Operating income therefore reflects only a portion of the cost in the current period, while free cash flow reflects the full cash payment.
Microsoft’s fiscal third-quarter results provide a clear example. The company reported $82.9 billion of revenue and $31.8 billion of GAAP net income for the quarter ended March 31, 2026. Revenue grew 18%, Azure and other cloud-services revenue grew 40%, and Microsoft said its AI business had surpassed a $37 billion annual revenue run rate. Those are exceptionally strong operating figures.
At the same time, capital expenditure was $31.9 billion. Operating cash flow was $46.7 billion, leaving $15.8 billion of free cash flow after the company’s stated capital expenditure measure. Free cash flow remained substantial, but it was far below operating cash flow because the infrastructure program absorbed so much cash.
This is the type of gap Wilson is emphasizing. It does not prove that the spending is excessive. Microsoft stated that approximately two-thirds of quarterly capital expenditure was for shorter-lived assets such as GPUs and CPUs, while the remainder supported long-lived infrastructure. If that investment creates durable cloud capacity, expands margins over time and protects a strategic position, the current cash burden may be rational.
The market’s concern is that the return is difficult to observe in real time. Cloud revenue includes many products, not only generative AI. Some AI services may initially have lower margins because inference costs are high. Competition can force providers to reduce prices. Hardware can become obsolete quickly. Energy and construction costs can rise. Customers may experiment with AI without adopting it at the scale assumed in long-term forecasts.
A company can therefore report strong earnings and still face multiple compression if investors believe cash returns will arrive later than previously expected. The effect is especially powerful when the stock already trades at a premium valuation. A small change in the assumed long-term margin or cost of capital can produce a large change in present value.
Wilson’s quality framework does not require investors to reject the AI cycle. It requires them to distinguish among four categories:
- Infrastructure builders that sell chips, servers, networking equipment, cooling systems and power components.
- Infrastructure owners that finance data centers and cloud capacity.
- Platform companies that monetize AI through software, advertising, cloud services or subscriptions.
- Adopters that use AI to reduce costs, improve pricing, increase worker productivity or create new products.
The first two groups receive revenue early in the buildout but can be exposed to a slowdown in spending. The third group bears much of the capital cost and must prove monetization. The fourth group may capture productivity benefits without carrying the same infrastructure burden. That is why market attention can move from AI builders to AI adopters even while total AI investment continues rising.
Quality within technology will increasingly depend on unit economics. Investors will examine revenue generated per dollar of capital expenditure, utilization rates, depreciation assumptions, power costs, customer concentration and the duration of contracted demand. They will also watch whether AI improves existing high-margin businesses or creates lower-margin services that cannibalize them.
Free cash flow is not the only answer. A rapidly growing company should sometimes invest aggressively. A mature company that maximizes near-term cash by underinvesting can destroy value. The relevant test is return on incremental invested capital. Are new assets producing enough future operating profit to compensate shareholders for the cash, risk and time involved? The market’s recent reaction to technology earnings suggests that this question has moved from the footnotes to the center of valuation.
Fact Box
Microsoft’s Fiscal Q3 2026 Cash-Flow Trade-Off
- Revenue: $82.9 billion
- GAAP net income: $31.8 billion
- Operating cash flow: $46.7 billion
- Capital expenditure: $31.9 billion
- Free cash flow stated by management: $15.8 billion
- Period: three months ended March 31, 2026
Original source: Microsoft fiscal third-quarter earnings call materials.
The Semiconductor Correction and the Shock From South Korea
Semiconductors are the clearest example of the difference between a strong industry and a strong stock at any price. The AI buildout created extraordinary demand for accelerators, high-bandwidth memory, networking equipment and advanced manufacturing capacity. Earnings estimates rose rapidly, valuations expanded and the sector became central to global equity performance.
By July 2026, the market had begun to question the durability of that acceleration. On July 28, South Korea’s KOSPI fell 10.84%, its largest decline in five months. SK Hynix dropped 14.7% and Samsung Electronics fell 14.4%, according to Reuters. Because the two companies represented more than half of the index’s weight, their declines had an outsized effect.
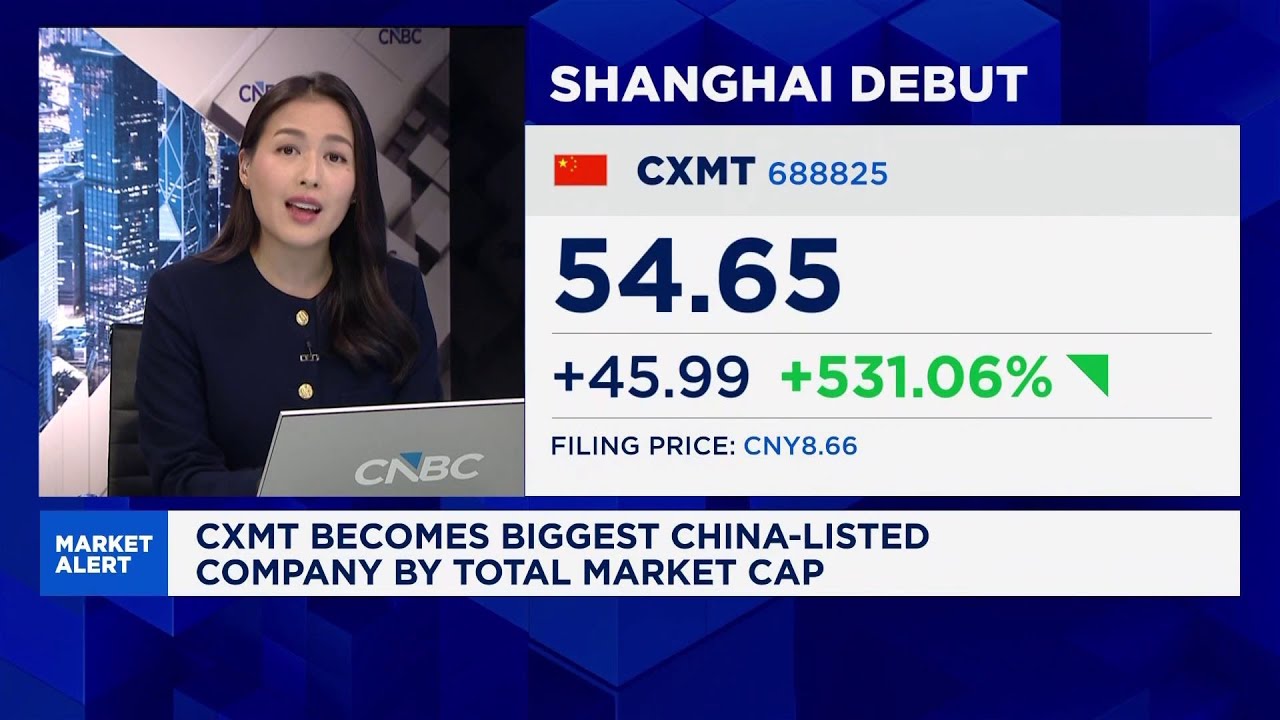
The immediate catalysts included concern about Chinese competition in memory and lithography, the market debut of ChangXin Memory Technologies and broader doubt about the sustainability of AI capital spending. The violence of the move also reflected market structure. Korea’s chip-heavy index, leveraged retail participation and concentrated positioning magnified the decline.
The selloff did not prove that AI demand had collapsed. South Korea had just reported extraordinary export growth, with semiconductor exports rising sharply earlier in the year. It did show that investors were no longer willing to extrapolate peak growth indefinitely. When expectations are extremely high, evidence of future competition can matter more than current revenue.
Memory markets are historically cyclical. Producers expand capacity when prices are high, customers build inventory, supply catches up and pricing weakens. High-bandwidth memory used in AI systems can have better structural demand and tighter qualification requirements than commodity memory, but it is not immune to competition or capital cycles. A stock priced for persistent scarcity is vulnerable when the market sees a credible path toward additional supply.
Advanced logic chips face a different set of risks. Demand can remain strong while the mix changes. Customers may develop custom silicon, cloud companies may seek alternatives to expensive accelerators, software efficiency may reduce compute requirements per task and export restrictions may reshape addressable markets. None of those developments ends AI investment, but each can alter who captures the economics.
Wilson’s view that the semiconductor correction was already “well advanced” is cautiously bullish at the tactical level. Once crowded positions have been reduced and valuations have reset, the sector can rebound even if revisions are no longer accelerating. But a tactical rebound is not the same as renewed structural leadership. The next phase may reward companies with the strongest balance sheets, diversified customers and proven cash conversion rather than the entire chip complex.
The Korea shock also demonstrated why the S&P 500 could look stable while global technology markets were under severe pressure. The U.S. index contains large healthcare, financial, consumer and industrial groups that can offset technology weakness. It also contains technology companies with very different business models. A software company with recurring subscriptions does not respond to memory pricing in the same way as a manufacturer.
For Wilson, that resilience is evidence of an underlying economic and earnings backdrop capable of supporting rotation. A skeptic could read it differently: concentration and passive flows may be delaying a broader correction. Both interpretations remain plausible. The next several weeks of mega-cap earnings, revisions and credit-market behavior are likely to determine which is more accurate.
Why the S&P 500 Can Be a “Quality Index” and Still Be Risky
Wilson described the S&P 500 as the highest-quality index in the world. There is a reasonable basis for that claim. The index contains many of the world’s most profitable companies, requires positive reported earnings for inclusion under normal eligibility rules and is dominated by businesses with global scale, deep capital markets access and substantial intangible assets.
The S&P 500 is not, however, a pure quality-factor portfolio. It is weighted by float-adjusted market capitalization. The largest companies receive the largest weights regardless of whether their current valuation is attractive or their future returns on investment are certain. A market-cap-weighted index can therefore become more concentrated and more sensitive to a small number of assumptions.
By the end of 2025, the ten largest companies represented roughly 41% of the index, according to RBC Wealth Management’s analysis of S&P 500 concentration. That concentration creates both strength and vulnerability. The largest companies generally have strong balance sheets and high profitability, which raises the average quality of the index. At the same time, their combined weight means that an AI spending disappointment, regulatory shock or valuation reset can move the entire benchmark.
A dedicated quality index uses a different construction. The S&P 500 Quality Index selects 100 companies based on return on equity, accruals and leverage. The broad S&P 500 includes all eligible constituents and gives larger weights to larger market values. Investors should not assume that owning the benchmark is the same as owning the 100 highest-scoring quality stocks.
Quality also does not eliminate valuation risk. A financially excellent company can be a poor investment if the price assumes unrealistically high growth. Conversely, a cyclical company with temporarily weak earnings can produce strong returns if the price already discounts the weakness. Wilson’s rotation argument is strongest when quality improvement and reasonable valuation coincide.
The index’s resilience near 7,400 shows that investors still assign high value to U.S. corporate earnings. It does not guarantee that 7,000 will hold. Index support levels are market observations, not contractual floors. If inflation drives bond yields higher, earnings estimates fall or a geopolitical shock damages growth, the market can trade below any strategist’s preferred level.
Still, the composition of the index helps explain why corrections beneath the surface can be much larger than the headline decline. A stock-level bear market can occur inside an index-level consolidation. That divergence is common when leadership rotates and is one reason investors who focus only on the benchmark may underestimate the change taking place.
The Federal Reserve Risk: What Wilson Means by an “Insurance Hike”
The most unusual part of Wilson’s latest argument is his willingness to describe a possible quarter-point rate increase as an “insurance hike.” Central bankers and investors more commonly use the phrase “insurance cut” for a pre-emptive reduction intended to protect growth from a future downturn. Wilson reverses the idea: a limited increase could demonstrate inflation credibility, prevent long-term yields from becoming disorderly and reduce the risk that the Fed later needs to tighten much more aggressively.
The Federal Open Market Committee entered its July 28–29 meeting with the target federal-funds range at 3.50% to 3.75%. The June decision to hold that range was unanimous. The statement described economic activity as solid, job gains as keeping pace with the workforce and inflation as elevated relative to the 2% objective.
Kevin Warsh had taken office as Fed chair only two months earlier. The Federal Reserve said he was sworn in on May 22, 2026, after Senate confirmation. A leadership transition creates uncertainty because markets must learn how the new chair communicates, builds consensus and responds to data. Warsh’s preference for less explicit forward guidance increased the range of plausible outcomes before the July meeting.
A conventional rate hike works through several channels. It raises the overnight policy rate, influences money-market yields, can tighten bank lending and usually increases the discount rate applied to future corporate cash flows. Growth stocks are especially sensitive because a larger share of their estimated value lies far in the future. All else equal, a hike is therefore negative for equity valuation in the short term.
Wilson’s argument is that “all else” may not remain equal. If the Fed appears unwilling to confront inflation, investors can demand a higher term premium on long-dated Treasury securities. Ten-year and thirty-year yields can rise even without an immediate policy move. That can be worse for equity valuations, mortgages and corporate financing than one carefully communicated 25-basis-point increase.
A basis point is one-hundredth of a percentage point. A 25-basis-point hike would raise the target range by 0.25 percentage point, from 3.50%–3.75% to 3.75%–4.00%. The economic effect would depend less on the mechanical move than on what the Fed said about future policy. A one-time increase paired with a data-dependent message would be different from the beginning of a multi-meeting tightening cycle.
The “insurance” logic has three components:
- Credibility: Acting while inflation is high could reinforce the Fed’s commitment to its 2% objective.
- Expectations: A limited move could prevent households, businesses and bond investors from assuming that higher inflation will be tolerated.
- Optionality: A higher policy rate gives the central bank slightly more room to cut later if growth weakens.
There are also strong arguments against a hike. Oil-driven inflation may fade if geopolitical tensions ease, making monetary tightening an unnecessarily blunt response to a supply shock. Employment growth had slowed. Housing was already weak. Higher rates would not produce more oil, reopen shipping lanes or build electrical capacity. Tightening into a supply shock can reduce demand without solving the source of the price increase.
A Reuters poll conducted July 17–21 found that all 104 economists expected the Fed to hold rates at the July meeting. Yet two-thirds of respondents who answered a separate question characterized the chance of a rate hike during 2026 as high. That combination captured the policy tension: a July hike was not the consensus, but the inflation backdrop had made later tightening plausible.
Wilson’s view should not be read as a prediction that a hike would immediately lift stocks. He explicitly allowed for a negative short-term reaction. His claim is that a limited move would not derail the full-year bull case because the economy and earnings could absorb it. That assumption would be tested quickly in credit spreads, long-term yields, bank stocks, small-cap performance and earnings revisions.
The market would also scrutinize the vote. A divided committee could signal uncertainty about the reaction function. A unanimous hold with hawkish language might tighten financial conditions without changing the rate. A surprise increase would challenge the Fed’s long-standing preference for preparing markets in advance. Under Warsh, communication itself has become a policy variable.
Fact Box
Federal Reserve Position Before the July 2026 Decision
- Target federal-funds range: 3.50% to 3.75%
- Previous decision: unanimous hold on June 17, 2026
- July meeting: July 28–29, 2026
- Fed chair: Kevin Warsh, sworn in May 22, 2026
- Long-run inflation objective: 2% PCE inflation
Original source: Federal Reserve FOMC calendar and meeting materials.
Inflation Is Falling in Some Measures but Still Too High in Others
The inflation picture entering the Fed meeting was unusually difficult to summarize because the headline and core measures were moving differently, and the most recent reports covered different months. The Fed’s preferred personal-consumption-expenditures index was available only through May. The consumer-price index was available through June.
The Bureau of Economic Analysis reported that the PCE price index rose 4.1% from May 2025 to May 2026. Excluding food and energy, core PCE rose 3.4%. Both readings were above the Fed’s 2% objective, and the headline measure had accelerated as energy costs increased.
The June CPI report looked more encouraging on a monthly basis. The Bureau of Labor Statistics said the all-items CPI fell 0.4% on a seasonally adjusted basis in June, while core CPI was unchanged. Over twelve months, however, headline CPI was still up 3.5%, core CPI was up 2.6% and energy prices were up 15.7%.
Those figures are not contradictory. PCE and CPI use different weights, formulas and scopes. They also covered different end months. A sharp June drop in energy could reduce the next PCE reading, but the result was not yet available when the July meeting began. The BEA had scheduled the June PCE report and the advance estimate of second-quarter GDP for July 30, the day after the policy decision.
The distinction between headline and core inflation matters because energy prices can be volatile. Core measures try to reveal the underlying trend by excluding food and energy. Yet households pay for gasoline, electricity and food, and a persistent energy shock can spread into transportation, manufacturing and service prices. The Fed cannot simply ignore headline inflation if it changes expectations or wage demands.
Wilson’s market argument assumes that inflation will remain manageable enough for corporate earnings to grow. Moderate inflation can support nominal revenue because companies raise prices. It can also improve operating leverage when revenue rises faster than fixed costs. But high or unstable inflation creates three threats to equities:
- It raises discount rates and lowers the present value of future earnings.
- It pressures household purchasing power and can weaken real demand.
- It squeezes margins when companies cannot pass higher costs to customers.
Quality companies are often better positioned because they have pricing power, low financing needs or more flexible cost structures. That does not make them immune. A high-quality consumer company can lose volume if prices rise too far. A software company can face wage and data-center inflation. An industrial company can suffer if customers delay capital projects.
The inflation debate also affects the composition of the market. Banks may benefit from higher rates if asset yields rise faster than funding costs, but they can suffer if credit losses increase. Energy companies can benefit from higher oil prices, while airlines, transports and chemical companies face higher input costs. Long-duration technology stocks usually prefer lower yields, but profitable software firms may still outperform less cash-generative peers in a quality rotation.
Oil Is the Bridge Between Geopolitics, Inflation and the Market
Wilson identified a sustained rise in oil as one of the clearest threats to his bullish outlook. That is because oil links a geopolitical event to inflation, household spending, corporate margins, bond yields and monetary policy. The impact is broader than the energy sector.
In July, crude prices rose sharply as the conflict involving the United States and Iran disrupted shipping and increased fear around the Strait of Hormuz. Brent crude moved above $90 during the escalation. After the United States paused attacks to allow diplomacy, prices reversed sharply. Reuters reported that Brent settled at $88.36 and West Texas Intermediate at $82.61 on July 27, down 8.7% and 7.5%, respectively, as the immediate risk premium eased.
The decline reduced near-term inflation pressure, but it did not eliminate supply risk. Shipping through the Strait remained impaired, Red Sea routes were disrupted and other production systems had suffered outages. A diplomatic pause can lower prices quickly because financial markets price probabilities. Physical flows can take longer to normalize.
For the S&P 500, the level and duration of the oil move matter more than a one-day change. A temporary spike can hurt sentiment without materially changing annual earnings. A sustained rise can reduce consumer discretionary spending, increase freight and production costs, and keep inflation high enough to force the Fed to tighten.
There is also a distributional effect. U.S. energy producers benefit from higher prices, and the country is less dependent on imported oil than it was in earlier decades. That cushions the aggregate economy. Consumers still pay more at the pump, and many non-energy companies still face higher costs. The net effect depends on how long the shock lasts and whether producers increase supply.
Oil also influences long-term inflation expectations. If bond investors interpret the shock as temporary, yields may remain stable. If they see repeated geopolitical disruptions, fiscal expansion and constrained energy investment, they may demand higher compensation for inflation risk. That is the channel Wilson connects to an “insurance hike”: the Fed may prefer a small policy move to a disorderly increase in long-term yields.
The direction of oil can therefore change the meaning of the same earnings report. A retailer’s strong quarter may look less durable if gasoline prices rise. A bank’s net-interest income may be offset by weaker borrowers. An industrial company’s backlog may be discounted if customers face higher financing and energy costs. Quality becomes more valuable because the range of outcomes widens.
The Labor Market Is Stable, Not Booming
Wilson’s constructive economic view relies on the labor market avoiding a sharp deterioration. Employment supports household income, consumer spending and credit quality. It also gives companies confidence to invest. The June data showed stability but not exceptional momentum.
The unemployment rate was 4.2%, and the number of unemployed people was approximately 7.1 million. Nonfarm payroll employment rose by 57,000 on a preliminary basis. The labor-force participation rate fell to 61.5%, while the employment-population ratio edged down to 59.0%. Long-term unemployment had increased over the prior year.
Those numbers support two competing readings. The bullish reading is that unemployment remains low, layoffs are limited and the economy is still adding jobs. The cautious reading is that job creation has slowed, participation has weakened and a low unemployment rate can mask reduced labor-force engagement.
The Fed’s challenge is that the labor market does not clearly require either easing or tightening. A deep employment contraction would argue for cuts. Accelerating wages and labor shortages would argue for hikes. Current conditions allow the Fed to prioritize inflation, but the margin for error is narrower than it would be with stronger job growth.
For the quality rotation, a stable labor market favors companies with recurring consumer demand and manageable wage exposure. A weakening labor market would increase the value of defensive cash flows but reduce the earnings outlook for cyclical sectors. A renewed hiring boom could support revenue while keeping wage inflation elevated.
The next employment report matters because the market is already priced for a soft landing or rolling recovery rather than a recession. A modestly weak report may support bonds and growth stocks by reducing rate pressure. A severely weak report would challenge earnings estimates. The relationship is nonlinear: bad news can be good for valuation until it becomes bad for profits.
GDP and Business Investment Support the Bull Case, With Important Limits
Real GDP increased at a 2.1% annualized rate in the first quarter after growing only 0.5% in the fourth quarter of 2025. The acceleration supports Wilson’s argument that the economy moved from a soft patch into recovery. Investment, exports, government spending and consumption contributed, while imports subtracted in the GDP calculation.
Business investment was especially important. AI-related equipment and data-center construction created a powerful capital-spending impulse. That spending supports current economic output even if the future investment return is uncertain. From a macro perspective, construction activity, equipment purchases and software investment count when they occur.
The limitation is concentration. An economy can post solid aggregate investment growth while many small businesses, housing-related companies and consumers remain under pressure. AI investment is capital intensive and may not create employment in proportion to the dollars spent. If the buildout slows, other parts of the economy must be strong enough to replace it.
The advance estimate of second-quarter GDP, scheduled for July 30, was therefore a key test. A strong result driven by inventories or trade would have a different quality than one driven by final domestic demand. Investors would examine consumer spending, business fixed investment and inflation rather than relying on the headline annualized rate.
Wilson’s rolling-recovery thesis does not require explosive GDP growth. It requires enough nominal growth and enough earnings breadth to support profit estimates. In a moderately inflationary economy, corporate revenue can grow faster than real GDP. That helps the index, provided margins hold and interest rates do not absorb the benefit through lower valuation multiples.
What Does It Mean to Say 7,000 Will Be “Defended”?
Strategists often identify index levels where they expect buyers to become more active. These levels can reflect previous highs, moving averages, valuation estimates, options positioning, institutional rebalancing or a psychologically important round number. Wilson’s 7,000 level has all of those characteristics. The S&P 500 first crossed 7,000 in January 2026, making the area a visible reference point for investors.
Calling a level “defended” does not mean a bank, central bank or group of investors has promised to buy there. It means Wilson believes the combination of valuation, earnings and positioning would make the risk-reward more attractive. The index can trade below a support level intraday or close below it. A genuine deterioration in fundamentals can make technical support irrelevant.
At 7,000, the market would be approximately 5.6% below the July 27 close. That would be a modest index correction by historical standards, although the drawdown in individual stocks could be much larger. If semiconductor and AI-infrastructure stocks had already fallen substantially, another index decline could bring quality companies into more attractive valuation ranges without requiring an economic recession.
The 7,000 thesis depends on earnings estimates remaining intact. If expected S&P 500 earnings continued to rise, a lower index price would reduce the forward price-to-earnings ratio. If estimates fell at the same time, the apparent valuation improvement could disappear. This is why Wilson watches revisions rather than price alone.
Credit markets would provide another test. A normal equity correction with stable corporate-bond spreads suggests investors are repricing valuation rather than anticipating widespread financial stress. A simultaneous widening in high-yield spreads, tightening in bank lending and rise in defaults would make the correction more economically significant.
Market breadth would also matter. If the index reached 7,000 because a few mega-cap companies fell while the median stock held up, the move could improve concentration risk. If most sectors broke down together, it would challenge the rotation thesis. The same index level can represent very different internal conditions.
Finally, the policy backdrop could alter the meaning of 7,000. A decline caused by one well-telegraphed rate hike might create the tactical opportunity Wilson describes. A decline caused by unanchored inflation expectations or a severe oil-supply disruption would be harder to treat as a routine reset.
What Would Have to Happen for the S&P 500 to Reach 8,000?
An S&P 500 target is the product of two variables: expected earnings and the valuation multiple investors are willing to pay. Any forecast should therefore be translated into an earnings-and-multiple framework rather than treated as a free-standing number.
Suppose the index earns a hypothetical $320 per share over the relevant forward period. An 8,000 target would imply a price-to-earnings ratio of 25 times. If earnings reached $340, the implied multiple would be about 23.5 times. If earnings were only $300, the multiple would need to be roughly 26.7 times. The target becomes easier to justify when earnings rise and harder when the valuation must do most of the work.
These figures are examples, not Morgan Stanley’s disclosed model in the interview. They show why revisions are decisive. A 5% change in the earnings estimate can alter the required valuation materially. The market can also move before reported earnings because investors discount future years.
For 8,000 to be reached by year-end, several conditions would likely need to align:
- Earnings estimates must remain resilient. The market can tolerate slower revision breadth, but a broad wave of downgrades would weaken the target.
- AI capital spending must produce enough visible revenue. Investors do not need every project to pay off immediately, but they need confidence that cash returns are developing.
- Oil must avoid a sustained new surge. A lasting energy shock would pressure consumers, margins and bond yields.
- The Fed must preserve credibility without causing a growth shock. A hold, hike or later adjustment can be compatible with the target if communication prevents disorderly repricing.
- Market leadership must broaden or rotate successfully. If semiconductors remain weak, other sectors must contribute.
- Credit conditions must remain functional. The equity market needs companies to refinance, invest and maintain balance-sheet flexibility.
The most plausible route is not a return to indiscriminate multiple expansion. It is a combination of continued profit growth, stabilization in technology and stronger contribution from high-quality companies outside the former leadership group. Industrials, financials, healthcare, consumer businesses and software could all participate without each sector rising at the same time.
A year-end rally could also be driven by reduced uncertainty. Markets sometimes rise when a feared event occurs but proves less damaging than expected. A Fed decision, an oil de-escalation or clearer mega-cap capital-spending guidance could reduce the risk premium even without changing near-term earnings.
Seasonality may matter at the margin. Late summer and early autumn often produce weaker market performance, while year-end can benefit from institutional rebalancing and improved visibility into the following year. Seasonality is not a fundamental reason to own equities, but it can influence timing when positioning is crowded.
Wilson’s target also assumes that the U.S. equity premium remains unusually strong relative to other regions. The S&P 500’s profitability, liquidity and exposure to global technology justify a premium, but that premium is not unlimited. Higher Treasury yields or stronger growth abroad could attract capital away from U.S. large-cap stocks.
The Bull Case for Wilson’s 8,000 Target
1. Corporate earnings are stronger than the headline anxiety suggests
The strongest argument is the profit data. Second-quarter earnings growth was running well above historical averages, and the 493 companies outside the Magnificent Seven were contributing meaningfully. If that breadth continues, the market can rotate without losing its earnings foundation.
2. The economy has avoided a conventional recession
Real GDP returned to moderate growth, unemployment remained low and business investment was strong. A rolling series of industry downturns may have allowed the economy to adjust without a synchronized collapse. That gives cyclical earnings room to recover.
3. The AI cycle is creating real economic activity
Even if the market debates the ultimate return, current spending is supporting equipment demand, construction, power infrastructure and software. The buildout is not purely a stock-market narrative. It appears in investment data and corporate cash flows.
4. Corrections in former leaders can improve market health
A market dominated by a narrow group becomes fragile. Lower valuations in semiconductors and hyperscalers can reduce concentration risk, especially if earnings growth broadens. A correction that transfers leadership rather than destroying demand can extend a bull market.
5. Quality companies can absorb a higher-rate environment
Businesses with low debt, recurring revenue and strong cash conversion are less dependent on monetary easing. If the Fed holds rates higher for longer, those companies can gain relative share from weaker competitors.
6. A modest policy hike need not cause recession
The federal-funds rate was already below its 2023–2024 peak. One quarter-point increase would tighten conditions but would not automatically create a multi-year hiking cycle. If it stabilizes long-term inflation expectations, the net market effect could become constructive after an initial selloff.
7. The index has shown unusual resilience
The S&P 500 remained near its highs despite war risk, oil volatility and severe semiconductor corrections. That behavior suggests buyers are willing to rotate rather than leave equities entirely. Price resilience is not proof, but it is evidence.
The Skeptical Case: Why 8,000 Could Prove Too Optimistic
1. Valuations leave little room for disappointment
The index entered the period at a historically elevated valuation. High-quality companies can deserve premium multiples, but premium valuations make returns more sensitive to interest rates and revisions. Earnings growth can be strong while stock returns remain modest if multiples contract.
2. Aggregate earnings are unusually concentrated
The difference between the headline S&P 500 growth rate and the rate excluding Alphabet shows how much one company can influence the total. If a few mega-caps slow, the rest of the index may not be able to offset them quickly enough.
3. AI spending could be ahead of monetization
Infrastructure owners are committing extraordinary capital before the market can measure long-term returns. If utilization is lower than expected, hardware becomes obsolete quickly or price competition increases, free cash flow could remain under pressure for longer than valuations assume.
4. Semiconductor competition may be structural
The Korea selloff was triggered partly by concern about Chinese memory and lithography progress. If the competitive landscape changes faster than expected, margins and market shares could normalize. A cyclical correction would then become a structural repricing.
5. Inflation could force more than one hike
Wilson’s “insurance hike” depends on the move being limited. If oil remains high and core inflation reaccelerates, the Fed may need several increases. That would pressure housing, credit and equity valuation more severely.
6. The labor market may be weaker than the unemployment rate suggests
Slow payroll growth and lower participation can precede broader weakness. If consumer income growth slows, revenue estimates for discretionary sectors may fall. The rolling recovery could stall before the quality phase has time to mature.
7. Geopolitical risk can move from sentiment to physical disruption
Markets often recover quickly from headline shocks, but a prolonged interruption to oil shipping would affect actual supply, inflation and industrial activity. The assumption that risk will remain manageable may be too comfortable.
8. Support levels can fail
Seven thousand is a forecast reference, not a floor. If multiple risks arrive together, systematic selling and options hedging can accelerate a decline. The market’s stability near the highs does not guarantee stability during a break.
How a Quality Rotation Changes the Questions Investors Ask
A quality rotation is less about selecting a fashionable sector than changing the financial questions applied to every company. The market begins to care less about the size of the addressable market in isolation and more about how efficiently management can convert opportunity into shareholder cash flow.
For technology companies, the questions include:
- How much incremental revenue is generated for each dollar of AI capital expenditure?
- What share of infrastructure spending is short-lived hardware versus long-lived facilities?
- Are AI services improving or diluting gross margins?
- How much demand is contractually committed, and how concentrated are the customers?
- Does operating cash flow grow fast enough to fund investment without debt or equity issuance?
For industrial companies, the focus shifts to backlog quality, service revenue, pricing, working capital and order cancellations. A large backlog is less valuable if customers can defer projects without penalty. Recurring aftermarket service can be more valuable than one-time equipment sales because it improves cash-flow visibility.
For financial companies, quality involves capital ratios, deposit stability, credit underwriting, fee income and asset-liability management. Higher rates can increase income, but only if funding costs and credit losses remain controlled. A bank that grows loans aggressively at the wrong point in the cycle may look profitable before losses emerge.
For consumer companies, pricing power must be separated from price increases. True pricing power means a company can raise prices without losing excessive volume or damaging the brand. A business that maintains revenue only because prices rise while units fall may have weaker earnings quality than the headline suggests.
For healthcare, investors examine patent exposure, reimbursement, research productivity and the recurring nature of demand. Stable demand can support quality, but a company dependent on one drug or one regulatory outcome can still have concentrated risk.
For energy and materials, balance-sheet discipline matters because commodity prices are volatile. A producer that returns cash and limits expansion at high prices may score better on quality than one that assumes the current price will persist indefinitely.
Across all sectors, working capital deserves more attention. Rapid revenue growth can consume cash through receivables and inventory. A company that reports profit but cannot collect cash from customers may face a financing problem. Quality investors compare the income statement with the cash-flow statement and balance sheet rather than relying on adjusted earnings per share.
Sector Implications Without Turning the Forecast Into a Recommendation
Wilson’s framework can be used to interpret sector behavior, but it does not produce a simple list of winners. Each sector contains high- and low-quality companies, and valuation can override broad characteristics.
Technology
Software may benefit relative to semiconductors if recurring revenue, lower capital intensity and AI adoption become more valuable than infrastructure scarcity. Yet software companies with weak cash flow or excessive stock-based compensation may not qualify as quality. Large cloud providers can regain leadership if they demonstrate improving AI economics.
Industrials
Data centers, grid investment, reshoring and defense spending can support demand. The quality distinction lies in margins, service mix, backlog conversion and working capital. Companies exposed to one capital-spending theme may be more cyclical than diversified operators.
Financials
A stable economy and higher rates can support banks and insurers. The risks are funding costs, commercial-real-estate exposure and consumer credit. Strong capital and conservative underwriting are central to the quality screen.
Consumer discretionary
A rolling recovery can revive demand for goods and housing-related purchases, but high energy costs and slower hiring threaten households. Companies with strong brands, low leverage and flexible inventories are better positioned than those dependent on promotions or subprime credit.
Consumer staples
Staples can benefit from earnings stability during volatility, but their valuations may already reflect defensiveness. Volume trends are critical. Persistent price increases with falling units can signal weakening franchise strength.
Healthcare
Recurring demand and strong cash generation fit a quality rotation. Policy, patent and trial risks remain company specific. The sector can provide diversification from AI and commodity cycles.
Energy
Higher oil prices support cash flow, while de-escalation can reverse gains quickly. Quality depends on cost structure, reserve life, capital discipline and balance-sheet strength rather than the spot price alone.
Utilities
Electricity demand from data centers creates a growth opportunity, but utilities are capital intensive and sensitive to interest rates. Regulatory recovery of investment and financing costs determine whether growth becomes shareholder value.
Historical Lessons From Other Quality Rotations
Quality often outperforms when economic momentum becomes less certain, financial conditions tighten or the market moves from broad recovery to selective growth. The factor’s behavior is not perfectly consistent because definitions differ and valuation matters, but several historical lessons are relevant.
First, quality can begin outperforming before a recession or earnings decline is obvious. Investors pay for visibility when uncertainty rises. Second, the factor can lag during the first stage of a recovery because highly leveraged and economically sensitive companies rebound faster. Third, quality can become overcrowded and expensive, reducing future returns even when the underlying businesses remain excellent.
The post-pandemic cycle showed all three tendencies. Early reopening rewarded companies with the greatest operating leverage. Later, investors moved toward dependable profits as inflation and rates increased. The current transition resembles that pattern but occurs with far greater AI concentration and a different capital-spending cycle.
Historical comparison also warns against treating quality as a synonym for low volatility. A high-quality technology company can have a large drawdown if its valuation contracts. A high-quality bank can fall during a liquidity event. Factor characteristics affect relative performance, not the possibility of loss.
Quality rotations can also happen inside sectors. During a commodity downturn, low-cost producers with strong balance sheets often outperform peers even if the whole sector falls. During a software correction, profitable companies with high retention may outperform unprofitable growth firms. That stock-level dispersion is consistent with Wilson’s claim that the next phase is more company specific.
What Would Invalidate the Quality-Rotation Thesis?
A useful investment thesis should identify evidence that would make it wrong. Wilson’s quality-rotation argument would be weakened by several developments.
A renewed surge in low-quality, high-beta leadership accompanied by improving earnings revisions would suggest the market remained early cycle longer than expected. Quality could still perform, but it would not be the dominant transition.
A broad collapse in earnings estimates would turn a rotation into a more conventional bear market. Quality might outperform relatively while still producing negative absolute returns.
A rapid recovery in semiconductor revisions and relative strength could show that the correction was merely positioning rather than a durable leadership change. That would not invalidate the bull market, but it would challenge the sector-rotation call.
A sharp fall in inflation and bond yields could revive long-duration growth and speculative assets. Quality would remain financially sound but might lag as discount rates fall.
A severe credit event would change the macro regime. In a liquidity crisis, correlations rise and even strong companies sell off as investors raise cash.
Evidence that AI capital expenditure is producing rapidly improving free cash flow would reduce the central concern about hyperscalers. The market could return to rewarding the infrastructure owners rather than rotating away from them.
The thesis is therefore testable through revisions, breadth, cash-flow statements, bond yields and sector leadership. It should not be accepted solely because the phrase “quality” sounds prudent.
What Happens Next
The market entered one of the most information-dense weeks of 2026. The immediate calendar included events capable of changing every part of Wilson’s thesis.
- July 28–29: Federal Open Market Committee meeting and policy decision.
- July 29: Microsoft’s fiscal fourth-quarter earnings release, with investors focused on Azure growth, capital expenditure and free cash flow.
- Late July: Meta, Apple and Amazon results, providing a broader test of AI spending and consumer demand.
- July 30: BEA’s advance estimate of second-quarter GDP.
- July 30: June PCE inflation and personal-income data.
- Early August: July employment data and another round of corporate guidance updates.
The sequencing matters. A hawkish Fed decision could pressure valuations before earnings. Strong technology cash flow could then stabilize the market. Conversely, a Fed hold could support stocks temporarily, only for disappointing capex guidance to renew the correction.
Investors should watch the reaction, not only the result. If strong earnings continue to produce falling share prices, the market is signaling that expectations remain too high. If weak news produces stable prices, much of the risk may already be discounted. That asymmetry is often more informative than the headline.
For the 8,000 target, the most important indicators are forward earnings estimates, the ten-year Treasury yield, credit spreads, oil prices and the relative performance of quality stocks against semiconductors and speculative growth. The index level alone cannot reveal whether the thesis is strengthening.
Three Plausible Paths From Here
Wilson’s target is one outcome inside a wide range rather than a complete forecast by itself. A more useful way to evaluate the call is to identify the market conditions that would produce a bullish, middle or bearish path. These scenarios are not assigned probabilities because the relevant data were still arriving, but they clarify which assumptions matter.
| Variable | Bullish path toward 8,000 | Choppy middle path | Bearish break below 7,000 |
|---|---|---|---|
| Earnings | Forward estimates keep rising and growth broadens beyond the largest companies. | Headline profits grow, but revision breadth flattens and leadership remains narrow. | Analysts cut estimates across multiple sectors and margins weaken. |
| AI investment | Cloud and software revenue make the return on capital more visible. | Revenue remains strong, but free cash flow stays constrained by spending. | Utilization, pricing or demand disappoint while capital commitments remain high. |
| Federal Reserve | Policy preserves credibility without materially damaging growth. | Uncertain communication keeps yields and equity multiples volatile. | Persistent inflation forces repeated tightening or long yields rise sharply. |
| Oil | Diplomacy restores flows and the inflation impulse fades. | Prices remain volatile but below levels that materially damage demand. | A sustained supply disruption lifts costs and inflation expectations. |
| Market leadership | Quality stocks and AI adopters offset weaker semiconductor leadership. | Rotation continues but fails to create a decisive index trend. | Technology weakness spreads and no sector is large enough to compensate. |
The bullish path
The most constructive path would combine a benign Fed outcome with improving evidence that AI spending is generating revenue and productivity. Semiconductor stocks would not need to return immediately to their highs. They would need to stop falling fast enough for other groups to carry the index. Financials could benefit from a stable economy, industrials from investment, healthcare from defensive growth and software from lower capital intensity.
In this scenario, earnings estimates for 2027 would rise as analysts roll their models forward. The market could reach 8,000 even with a slightly lower valuation multiple if profit estimates increase enough. Oil would remain below its conflict peak, allowing headline inflation to moderate. Credit spreads would stay contained, confirming that the correction was about valuation and leadership rather than solvency.
The important feature would be participation. The equal-weighted market, small and midsize companies, and sectors outside mega-cap technology would improve relative to the capitalization-weighted index. A broader rally would reduce dependence on one or two earnings reports and make Wilson’s target more robust.
The choppy middle path
The middle path may be the easiest to underestimate because it can produce dramatic stock-level moves without a large change in the index. Strong earnings in some sectors would offset falling multiples in others. Oil could swing with every diplomatic headline. Bond yields could rise and fall as markets alternate between inflation and growth concerns. The S&P 500 might remain in a wide range while the internal rotation continues.
This outcome would fit Wilson’s expectation of additional chopping around, but it might delay the 8,000 target beyond year-end. Quality stocks could outperform in relative terms without generating spectacular absolute returns. Investors would become increasingly sensitive to guidance, cash flow and balance sheets. Companies missing estimates could suffer large declines, while credible cash-generative businesses would receive a scarcity premium.
A range-bound index would not necessarily mean the forecast had failed fundamentally. It could indicate that earnings growth and valuation compression were offsetting each other. The question would shift from whether 8,000 is reached on schedule to whether the earnings base is still rising beneath the consolidation.
The bearish path
The bearish path requires more than a semiconductor correction. It would involve transmission from market weakness into financing conditions and corporate behavior. A sustained oil shock could keep PCE inflation high, push the Fed toward repeated hikes and lift long-term yields. Higher borrowing costs would pressure housing, small businesses and leveraged companies. Consumers would face weaker real income as energy costs rose.
At the same time, disappointing AI monetization could force investors to reduce valuations for the largest index companies. If management teams maintained capital expenditure despite weaker revenue visibility, free cash flow estimates would fall. If they cut spending sharply, semiconductor and infrastructure suppliers would face order risk. Either response could spread weakness across the ecosystem.
The decisive signal would be broad downward earnings revisions. Once analysts reduce forecasts for technology, consumer, industrial and financial companies together, the rolling-recovery interpretation becomes difficult to maintain. A decline below 7,000 accompanied by widening credit spreads and weaker labor data would be materially different from the tactical pullback Wilson expects.
Why the path matters more than the destination
Two markets can finish at the same index level and leave investors with very different experiences. An 8,000 close driven by five mega-cap companies would preserve concentration risk. An 8,000 close supported by broad earnings growth would be healthier. A temporary fall below 7,000 with stable credit and rising estimates could be less concerning than a close above 7,000 with rapidly deteriorating fundamentals.
That is why a point target should be monitored through its underlying assumptions. Wilson’s forecast is not simply “stocks go up.” It is a sequence: early-cycle leadership fades, quality takes over, the index absorbs a correction, inflation does not force a prolonged tightening cycle and earnings growth ultimately carries the benchmark higher. Each link can be tested separately.
Frequently Asked Questions
What is Mike Wilson’s S&P 500 target for the end of 2026?
Mike Wilson’s stated year-end target is 8,000. In his latest market discussion, he maintained that target while allowing for a correction toward 7,000 first. Using the July 27 close of 7,413.18, the year-end target represented approximately 7.9% upside, while 7,000 represented approximately 5.6% downside. The target is a forecast based on earnings, valuation and market-cycle assumptions; it is not a guaranteed outcome.
Why does Wilson think the S&P 500 can rise after a correction?
His argument is that a near-term correction can reduce excessive valuations and crowded positioning without ending the earnings recovery. If forward profit estimates continue to rise, a lower index price makes the market less expensive. He also expects leadership to rotate toward companies with stronger cash flow and more predictable earnings. The bullish case would weaken if the correction were accompanied by broad earnings downgrades, widening credit spreads or a sustained economic contraction.
What is a quality rotation in the stock market?
A quality rotation occurs when investors begin favoring companies with stable earnings, strong balance sheets, high cash conversion and durable margins over companies whose performance depends more heavily on leverage, economic acceleration or optimistic future assumptions. It can occur across sectors. It is not automatically a move into defensive stocks, and it does not mean growth companies must underperform. The central distinction is the reliability and financial efficiency of the growth.
How is investment quality measured?
Different firms use different methods. Wilson emphasizes free cash flow, balance-sheet strength, earnings stability and predictability. S&P Dow Jones Indices uses return on equity, accruals and financial leverage in its formal quality-index methodology. Other analysts may include gross profitability, return on invested capital, margin stability, debt-service capacity and governance. No single metric is sufficient because high return on equity can be created by leverage, while high near-term free cash flow can result from underinvestment.
Why are semiconductors under pressure if AI demand is still strong?
Stocks respond to changes in expectations, not only to current demand. Semiconductor earnings can remain strong while share prices fall if investors believe the rate of estimate increases has peaked, future competition is rising or customers will slow capital expenditure. The July selloff in South Korean chipmakers also reflected concern about Chinese competition in memory and lithography. A cyclical correction does not prove the AI buildout has ended, but it can signal that valuations had discounted too much future growth.
Why does free cash flow matter so much for AI companies?
AI infrastructure requires large cash outlays for chips, servers, networking, data centers and power. Accounting earnings recognize much of that cost gradually through depreciation, while free cash flow reflects current capital spending. A company can therefore report strong revenue and net income while producing much less cash after investment. Investors are trying to determine whether future AI revenue and margins will justify the spending. The answer depends on utilization, pricing, customer demand, asset life and competitive intensity.
What is an “insurance hike” by the Federal Reserve?
Wilson uses the phrase for a limited rate increase intended to reinforce inflation credibility and prevent a larger rise in long-term bond yields. The concept is analogous to an insurance cut, but in the opposite direction. A 25-basis-point increase could show that the Fed is willing to defend its 2% objective without necessarily beginning a long hiking cycle. The risk is that even one hike could weaken housing, credit and employment if the economy is more fragile than it appears.
What was the federal-funds rate before the July 2026 Fed meeting?
The target range was 3.50% to 3.75%. The FOMC had maintained that range at its June 16–17 meeting in a unanimous vote. The July meeting was scheduled for July 28–29. The policy decision, vote and accompanying communication were especially important because Kevin Warsh had only recently become chair and markets were still learning his approach to forward guidance and consensus building.
What is the biggest risk to the S&P 500 8,000 forecast?
No single risk dominates in every scenario, but the most damaging combination would be persistent inflation, higher long-term yields and falling earnings estimates. A renewed oil shock could contribute to all three by raising costs, weakening consumer demand and forcing the Fed to tighten. A separate risk is that AI capital expenditure fails to generate expected cash returns, causing the largest index companies to lose valuation support. Concentration means weakness in a few mega-caps can have an unusually large benchmark effect.
Does a quality rotation mean the Magnificent Seven are finished leading?
No. Several Magnificent Seven companies have exceptional balance sheets, high margins and powerful cash-generating businesses. They can qualify as quality under many definitions. The issue is whether their future cash flows justify their valuations and capital-spending plans. Leadership may become less uniform: one mega-cap can outperform because AI monetization improves while another lags because spending rises faster than cash flow. A rotation can broaden the market without permanently removing every former leader.
Why can strong earnings cause a stock to fall?
The market price reflects expectations before the earnings release. A company can beat the published consensus but still disappoint the more optimistic assumptions embedded in its valuation. Guidance, margins, capital expenditure and free cash flow can also outweigh headline revenue or earnings per share. When investors believe the rate of improvement has peaked, they may reduce the valuation multiple even though reported profit is rising. This is a central feature of Wilson’s “peak rate of change” argument.
What data should be watched to judge whether Wilson is right?
The most useful indicators include S&P 500 forward earnings estimates, earnings-revision breadth, free cash flow at the hyperscalers, semiconductor relative performance, the ten-year Treasury yield, corporate-credit spreads, oil prices and market breadth. Economic data also matter, especially core PCE inflation, payroll growth, unemployment, consumer spending and business investment. Wilson’s thesis is strongest when earnings remain positive, credit stays stable and leadership broadens even if the headline index consolidates.
Final Assessment
Mike Wilson’s 8,000 target is more credible when understood as an earnings forecast with a changing leadership structure than as a prediction of uninterrupted market gains. The S&P 500 does not need semiconductors, hyperscalers and every early-cycle trade to rise together. It needs enough profit growth across enough financially durable companies to offset valuation pressure in the former leaders.
The available evidence supports part of that case. The U.S. economy was expanding at a moderate pace, unemployment remained low, business investment was strong and second-quarter corporate earnings were growing rapidly. The index had absorbed severe corrections beneath the surface without falling far from its high. Those conditions are consistent with a rotation rather than a completed bull-market top.
The strongest concern is that the market is attempting the transition from an expensive starting point while inflation, oil and Federal Reserve policy remain unusually uncertain. Aggregate earnings growth is impressive but concentrated. AI investment is economically powerful but cash intensive. A modest slowdown in revisions can be healthy; a broad decline would change the interpretation quickly.
Wilson’s 7,000 level is therefore best viewed as a test, not a promise. If the index approaches that area while earnings estimates hold, credit spreads remain contained and quality stocks outperform, the correction would support his thesis. If oil surges, long-term yields rise and earnings forecasts fall together, 7,000 may not provide the expected support.
The central market question is no longer whether AI, technology or the U.S. economy can grow. It is whether the next dollar of growth will produce enough cash to justify the price investors are paying. That is why free cash flow, balance-sheet strength and earnings predictability have moved to the center of the debate. The path to 8,000 depends less on enthusiasm returning everywhere than on the market finding a broader and more financially disciplined group of leaders.
This article is provided for general informational purposes and does not constitute financial, investment, tax, or legal advice.
Sources
- Morgan Stanley: Stock Market Rotation—Why Quality Matters Now
- Morgan Stanley: The Bull Case After the Pullback in Stocks
- Reuters global market data
- Reuters: South Korea’s KOSPI posts biggest fall in five months as chipmakers slump
- Reuters poll on the 2026 Federal Reserve outlook
- Reuters: Oil prices fall after pause in U.S. attacks on Iran
- Federal Reserve: June 17, 2026 FOMC statement
- Federal Reserve: July 2026 Monetary Policy Report
- Kevin Warsh’s July 14, 2026 congressional testimony
- Federal Reserve: Kevin Warsh takes oath of office
- Bureau of Economic Analysis: First-quarter 2026 GDP, third estimate
- Bureau of Economic Analysis: Personal Income and Outlays, May 2026
- Bureau of Labor Statistics: Consumer Price Index, June 2026
- Bureau of Labor Statistics: Employment Situation, June 2026
- FactSet: S&P 500 Earnings Season Update, July 24, 2026
- FactSet: Magnificent Seven and S&P 500 earnings growth
- S&P Dow Jones Indices: S&P Quality Indices Methodology
- S&P Dow Jones Indices: S&P 500 Quality Index
- Microsoft fiscal third-quarter 2026 earnings release
- Microsoft fiscal third-quarter 2026 earnings call materials
Affiliate disclosure: Businessfinance.news may earn compensation from qualifying actions completed through selected links on this website, at no additional cost to the reader. Affiliate relationships do not influence our editorial reporting, analysis, or conclusions.