Crude oil prices suffered one of their sharpest daily reversals of 2026 after the United States paused its latest bombing campaign against Iran and both sides left open the possibility of renewed diplomacy. The move immediately reduced the price traders were willing to pay for the risk of a near-term supply catastrophe in the Persian Gulf. It did not, however, prove that the war was ending, that the Strait of Hormuz was functioning normally, or that the inflation shock facing American households and the Federal Reserve had disappeared.
That distinction explains the most important market signal from July 27. Oil plunged, but U.S. stocks barely moved and Treasury yields declined only modestly. West Texas Intermediate futures settled at $82.61 a barrel, down 7.5%, while Reuters reported that front-month ICE Brent settled at $88.36, down 8.7%. The Associated Press cited a different Brent reference at $85.87. Those figures should not be treated as interchangeable snapshots; oil publications and market-data services can display different contracts, timestamps, or benchmark references. The common message was nevertheless unmistakable: a large portion of the immediate war premium came out of crude in a matter of hours.
The early answer for readers is this: the oil-price collapse is likely to reduce near-term pressure on U.S. gasoline prices, freight costs and headline inflation if it persists. It may make an additional Federal Reserve rate increase less urgent than it appeared when Brent traded above $100. But one trading session cannot reverse months of disruption, elevated annual energy inflation, depleted inventories, expensive shipping routes and uncertainty over the world’s most important oil chokepoint. The decline is economically helpful. It is not yet the same as durable normalization.
The Market Move at a Glance
- WTI crude: settled at $82.61 a barrel on July 27, down 7.5%, according to Reuters.
- Front-month ICE Brent: settled at $88.36, down 8.7%, according to Reuters.
- Brent alternative reference: the Associated Press reported $85.87, illustrating the importance of checking contract and timing conventions.
- U.S. stocks: the S&P 500 rose less than 0.1%, the Dow gained 0.5%, and the Nasdaq fell 0.2%.
- Semiconductors: chip shares sold off as investors focused on artificial-intelligence spending, financing structures and major technology earnings.
- Treasuries: yields slipped, but the move was restrained relative to the collapse in crude.
- Physical constraint: Reuters reported that fewer than 10 commodity vessels per day crossed Hormuz during the weekend, with flows estimated at roughly 15% of the prewar rate.
- U.S. gasoline backdrop: the national average was $4.11 a gallon on July 24, while diesel averaged $5.28, according to EIA’s daily-price page using AAA data.
What Actually Changed Between Washington and Tehran?
The immediate catalyst was President Donald Trump’s decision to suspend a two-week sequence of U.S. airstrikes against Iran. The administration described the pause as an attempt to give diplomacy additional room. Trump said discussions were progressing and warned that military action could restart if negotiations failed. Iran publicly disputed the suggestion that it had requested formal talks, while acknowledging that messages continued to pass through intermediaries.
That is not a signed peace agreement. It is not even a conventional ceasefire with a mutually published text, enforcement provisions and a clear mechanism for resolving violations. It is better understood as a tactical pause in a conflict that had already lasted five months and had repeatedly shifted between escalation, temporary restraint and renewed attacks. Markets reacted because the pause reduced the probability of an immediate worsening. They did not receive enough evidence to assign a high probability to a lasting settlement.
The diplomacy also remained entangled with maritime control. Iran continued to assert authority over shipping through the Strait of Hormuz, while the United States demanded free passage. Reuters reported that Iranian media said six vessels had been turned back for attempting to transit without authorization. Washington’s naval blockade remained in place, and attacks linked to Iran-aligned groups continued elsewhere in the region. Saudi Arabia reported intercepting drones aimed at petroleum targets. Yemen’s Houthis said they had targeted the East-West Pipeline that carries oil toward Saudi Arabia’s Red Sea export infrastructure.
On July 28, Oman was reported to have presented Iran with a proposal for a joint regional mechanism to manage Hormuz, potentially involving voluntary transit fees. That development gave traders another reason to reduce the probability of complete closure. It also underscored how far the parties remained from a simple return to the prewar status quo. The argument was no longer merely about whether ships could move. It concerned who would supervise the route, under what rules, with what fees, and with whose security guarantees.
Israel added another layer of uncertainty. Prime Minister Benjamin Netanyahu arrived in Washington for talks with Trump and indicated that Iran would be at the top of the agenda. The two leaders shared broad concerns about Iran’s nuclear and missile capabilities, but their preferred timing and methods had not always aligned. A U.S. president facing rising fuel prices and a midterm election may have stronger incentives to seek a diplomatic off-ramp than an Israeli government focused on preventing Iran from rebuilding strategic capabilities.
For oil traders, the relevant question was therefore narrower than “Is there peace?” The question was: “Has the probability of a near-term interruption become lower than it was on Friday?” The answer was yes, and futures repriced quickly. For companies, consumers and central bankers, the required question is more demanding: “Will enough oil actually move through the region, for long enough, to rebuild inventories and lower delivered energy costs?” That answer remained uncertain.
Why Oil Can Fall 9% Without the Fundamental Problem Being Solved
Oil futures are forward-looking financial instruments. They respond not only to barrels being produced and shipped today, but also to the probability distribution of future supply, demand, storage and geopolitical outcomes. When traders fear that a chokepoint may close, prices can rise well before the full physical shortage appears. When that probability recedes, part of the premium can disappear just as rapidly.
The July 27 selloff was therefore not a verdict that the world suddenly had abundant crude. It was a repricing of tail risk. The chance of an immediate U.S.-Iran escalation, additional attacks on export terminals, or a wider closure of Hormuz appeared lower after the strike pause. Traders who had bought futures as protection against those outcomes had an incentive to take profits. Short-term speculative positions may also have amplified the decline as prices broke technical levels and risk managers reduced exposure.
This mechanism is common in commodity markets. A futures price combines an estimate of expected physical conditions with compensation for uncertainty. The uncertainty component can be especially large when a conflict threatens infrastructure that cannot be quickly replaced. Hormuz is not just another shipping lane. It is the narrow outlet for several of the world’s largest petroleum exporters. Even countries with alternative pipelines cannot reroute all their normal seaborne volumes.
The speed of the decline also reflected the scale of the preceding rally. Brent had traded above $100 during the previous week as the conflict spread toward the Red Sea and tanker traffic remained constrained. A market that moves rapidly from fear to relief can produce dramatic percentage changes even when prices remain historically elevated. After the July 27 fall, WTI was still above levels that had prevailed before the latest escalation, and U.S. retail gasoline remained expensive.
Another reason for the violent adjustment was that oil is globally fungible only up to a point. Buyers can switch among crude grades and origins, but refinery configurations, shipping distances, sanctions, insurance, storage and contractual obligations limit how quickly substitution can occur. When the risk of losing Gulf barrels increases, refiners bid more aggressively for alternatives. When that risk recedes, the scramble eases. The financial price can move before physical cargo schedules fully normalize.
The most disciplined interpretation is therefore neither “the oil crisis is over” nor “the selloff means nothing.” The move matters because it lowers the immediate cost of crude and can influence wholesale fuel prices almost at once. It also changes expectations for inflation and monetary policy. But the durability of those benefits depends on shipping data, production restarts, insurance costs, refinery margins and diplomatic follow-through.
The Difference Between a Futures Rally and a Physical Recovery
The most important caution in the Reuters oil-market report was that a political pause had not yet put additional barrels on the water. Shipping volumes through Hormuz remained deeply depressed. Kpler data cited by Reuters indicated fewer than 10 commodity vessels per day crossed the strait during the weekend. An SEB analyst estimated flows at roughly 15% of the normal rate of about 20 million barrels a day of crude, condensate and petroleum products.
That gap between financial optimism and physical reality matters because the economic damage from a chokepoint disruption accumulates through several channels. Exporting countries can be forced to shut in production when storage fills. Importing refiners may have to pay more for replacement cargoes. Tankers take longer routes, increasing fuel use and vessel demand. War-risk insurance rises. Companies hold more precautionary inventory. Delivery schedules become less reliable. These costs can remain elevated even after benchmark crude prices fall.
The U.S. Energy Information Administration estimated in its July outlook that Middle Eastern production shut-ins averaged 8.3 million barrels a day in June after peaking at 11.2 million in May. EIA expected most production to return near pre-conflict averages by the end of 2026, with the majority of shut-in output back online in the first quarter of 2027. That forecast assumed continuing improvement in trade flows. A renewed military escalation would make the timetable obsolete.
Physical recovery also requires more than a public announcement. Port operators must restore schedules. Shipowners and insurers must conclude that the risk is acceptable. Crews must be willing to transit. Naval authorities need workable rules. Cargo owners need confidence that vessels will not be detained or diverted. Refineries must rebuild supply chains and inventories. Exporters must restart wells carefully, especially where production was shut in for extended periods.
Some market indicators can improve before these conditions are fully met. Freight rates may decline as fear eases. Prompt crude spreads may soften if traders expect inventory relief. Refinery margins can adjust. But the delivered cost of fuel depends on the entire chain, not only the front-month futures settlement shown in headlines.
This is why consumers should not expect a 7.5% drop in WTI to produce an immediate 7.5% decline at the gasoline pump. Crude is a major input, but retail prices also reflect refining, distribution, taxes, local competition, regional fuel specifications and inventory conditions. EIA specifically warned that low gasoline inventories were keeping wholesale and retail margins elevated, offsetting part of the benefit from cheaper crude.
Why the Strait of Hormuz Still Determines the Global Risk Premium
The Strait of Hormuz connects the Persian Gulf with the Gulf of Oman and the Arabian Sea. At its narrowest navigable point, commercial traffic moves through designated lanes close to Iranian and Omani waters. The geography gives the route strategic importance that is difficult to overstate.
EIA estimated that oil flows through Hormuz averaged about 20 million barrels a day in 2024, equivalent to roughly one-fifth of global petroleum liquids consumption. The strait also carries liquefied natural gas, particularly from Qatar. A prolonged disruption therefore affects oil, refined products, petrochemical feedstocks and gas markets simultaneously.
Saudi Arabia and the United Arab Emirates have pipelines that can bypass part of the route, but spare capacity is limited relative to normal Gulf exports. Iraq, Kuwait, Qatar and Bahrain have fewer alternatives. Even when physical barrels can be rerouted, they may have to travel longer distances or use ports exposed to other security risks. The conflict’s spread toward the Red Sea showed why “alternative route” does not automatically mean “safe route.”
The strategic value of Hormuz creates a nonlinear price response. Losing one million barrels a day in a well-supplied market is different from losing the same amount when inventories are already declining, spare production capacity is uncertain, and refiners are competing for similar crude grades. The price impact also grows if traders fear that a limited disruption could become a wider one.
At the same time, the importance of the strait does not mean every threat produces a permanent price spike. Oil markets adapt. Producers outside the region increase exports. Governments release strategic reserves. Refiners change feedstocks. Consumers reduce demand. High prices create their own corrective forces. The Reuters analysis of why crude had not reached the extremes some forecasters expected during the five-month conflict pointed to weaker Chinese demand, higher U.S. output, strategic-reserve releases and the temporary reopening of Hormuz in June.
The result is a market that can simultaneously contain severe physical stress and mechanisms of resilience. That combination explains why Brent could rise above $100 and then fall almost 9% in one session without either move being irrational. The price was continuously updating the odds of several competing scenarios.
Why the Red Sea Matters Even When Hormuz Improves
Investors often speak about the Middle East oil risk as though it were a single chokepoint story. In 2026, it became a network problem. The Strait of Hormuz controls access from the Persian Gulf. The Bab el-Mandeb strait connects the Red Sea with the Gulf of Aden and the Arabian Sea. The Suez Canal and Sumed pipeline provide critical links between the Red Sea and Mediterranean markets. Trouble at more than one location can eliminate the benefit of rerouting.
Saudi Arabia’s East-West Pipeline allows crude to move from eastern production regions to the Red Sea port of Yanbu. That infrastructure is strategically valuable when Hormuz is constrained. But Houthi attacks on Saudi facilities and threats to Red Sea shipping increase the risk attached to the alternative. A cargo that avoids Hormuz can still face danger near Bab el-Mandeb or require a longer voyage around southern Africa.
Longer voyages affect more than oil-company logistics. They tie up tankers for additional days, reducing effective shipping capacity. They increase bunker-fuel consumption. They can raise freight and insurance costs across commodity markets. Refined products, chemicals, manufactured goods and container shipping may all be affected. These second-order costs can outlast the initial movement in crude futures.
Reuters reported on July 28 that vessel traffic through Bab el-Mandeb was beginning to rise amid hopes for a diplomatic resolution. That was an encouraging operational signal, but it was still early. The return of a handful of tankers is not equivalent to normal traffic, and shipowners may respond differently based on cargo, flag, insurer and perceived political exposure.
For inflation, the network effect matters because transportation costs can spread beyond the energy category. Higher diesel prices raise trucking costs. More expensive marine fuel and insurance increase imported-goods costs. Air carriers face higher jet-fuel expenses. Chemical and plastics producers pay more for hydrocarbon inputs. Food supply chains absorb higher refrigeration and transport expenses. Companies may initially compress margins, but persistent increases eventually appear in consumer prices.
A durable peace process would reduce these costs in layers. Benchmark crude could decline first. Freight and insurance could follow. Inventories would rebuild. Refinery margins might normalize. Retail fuel prices would then catch up. The sequence can take weeks or months, which is why a dramatic one-day futures move should be treated as the beginning of a potential transmission process rather than the end.
Why Oil Did Not Reach $150 Despite a Five-Month War
The conflict threatened the most important petroleum chokepoint in the world, yet Brent’s 2026 peak remained below the all-time nominal high reached in 2008. That outcome surprised some investors who assumed a prolonged confrontation involving Iran would automatically produce a historic price spike.
Several buffers prevented the worst-case scenario. First, global demand was not uniformly strong. Reuters reported that China reduced crude imports and demand, limiting competition for available barrels. A softer demand profile gives the market more capacity to absorb supply losses than it would have during synchronized global growth.
Second, U.S. production and exports provided an alternative source of supply. EIA reported record U.S. petroleum exports in April as overseas buyers responded to disruption around Hormuz. The United States cannot fully replace Gulf exports, and domestic consumers still pay prices linked to global benchmarks, but additional U.S. barrels reduce the size of the worldwide shortage.
Third, governments can release oil from strategic reserves. Such releases do not create new production, but they provide temporary supply and signal that authorities are willing to use emergency inventories. Their effectiveness depends on scale, timing, crude quality and distribution capacity.
Fourth, the conflict did not produce a complete and continuous closure of Hormuz. Flows fell dramatically, but some vessels continued to transit. The June memorandum between the United States and Iran temporarily improved shipping before hostilities resumed. Even partial movement can be decisive when the alternative is zero.
Fifth, high prices reduced demand and encouraged substitution. Consumers drive less, airlines adjust capacity, industrial users conserve energy, and refiners alter purchasing patterns. The response is not immediate or painless, but it limits how long prices can remain disconnected from economic activity.
Finally, financial markets understood that elevated prices would accelerate production outside the conflict zone and weaken future demand. Futures curves therefore reflected both current scarcity and expected adaptation. A $100 prompt barrel does not necessarily imply that traders expect $100 oil several years later.
These buffers remain relevant after the July 27 decline. They support the case for lower prices if diplomacy holds. They also explain why renewed fighting would not automatically produce an unlimited rally. But resilience should not be confused with immunity. If Hormuz and Bab el-Mandeb were simultaneously closed for an extended period, or if major production infrastructure were damaged, the available buffers could be overwhelmed.
The Inflation Effect: Helpful Immediately, Decisive Only If Sustained
Energy prices influence inflation through direct and indirect channels. The direct channel is visible in the Consumer Price Index: gasoline, fuel oil, natural gas and electricity are measured components. The indirect channel works through transportation, manufacturing, agriculture, air travel, delivery services and inflation expectations.
The June 2026 CPI report illustrated both the power and volatility of energy. The overall energy index fell 5.7% during the month, the largest monthly decline since April 2020, and gasoline fell 9.7%. That helped reduce the monthly all-items index even though food and shelter increased. Yet energy prices were still 15.7% above their level a year earlier, and gasoline was 26.7% higher. Headline CPI was 3.5% year over year, while core CPI was 2.6%.
This apparent contradiction is central to the Fed debate. A monthly decline can provide immediate relief, but annual inflation remains elevated when prices are compared with a much lower base. If oil stays near or below the July 27 settlement levels, the year-over-year energy contribution should eventually diminish. If crude rebounds, the improvement could reverse quickly.
The Personal Consumption Expenditures price index, the Fed’s preferred broad inflation measure, had risen 4.1% in the year through May. The June PCE report was scheduled for July 30, after the Fed’s July meeting. Policymakers therefore entered the meeting with incomplete confirmation of how June’s energy decline had affected the PCE measure.
Lower crude helps headline inflation first. Core inflation excludes food and energy, so the immediate mechanical effect does not appear there. Over time, however, cheaper fuel can reduce costs for transportation services, airlines, delivery companies, manufacturers and retailers. Whether those savings reach consumers depends on competition and pricing power. Companies may use lower costs to rebuild margins rather than cut prices, especially after months of volatility.
Inflation expectations are another channel. Gasoline prices are unusually visible. Consumers see them on signs during daily travel, and sharp increases can influence perceptions of the entire economy. A sustained fall can improve sentiment even before official inflation data fully reflect it. That political and psychological effect is one reason presidents pay close attention to pump prices.
The July 27 decline therefore improved the inflation outlook at the margin. It reduced the probability of another immediate energy-driven surge. But it did not remove tariff pressure, housing costs, service inflation or the legacy of earlier fuel increases. The bond market’s muted reaction suggested investors understood that broader inflation risks remained.
What the Oil Drop Could Mean at the Gas Pump
American drivers had not yet received meaningful relief when crude collapsed. EIA’s daily-price page showed a national regular-gasoline average of $4.11 a gallon on July 24 and diesel at $5.28. Those prices reflected crude bought earlier, refinery economics, distribution costs and tight product inventories.
EIA’s July Short-Term Energy Outlook offered a useful baseline. The agency projected average U.S. gasoline prices of about $3.80 a gallon in the third quarter, down from more than $4.20 in the second quarter. It expected prices to approach $3.40 in the fourth quarter as inventories rebuilt and the summer driving season ended. For 2027, EIA forecast an annual average below $3.10.
Those numbers were forecasts, not guarantees. They assumed improving Middle East production and trade flows. They also assumed rising global production would eventually return the market to oversupply. A breakdown in diplomacy could move the path higher. Refinery outages, hurricanes or regional fuel constraints could produce local deviations even if global crude declined.
Crude typically accounts for a large share of the retail gasoline price, but not all of it. Refining margins were unusually high because gasoline inventories were low. EIA estimated that the crude-driven quarter-to-quarter decline could amount to nearly 50 cents a gallon, but part of the benefit would be offset by wider wholesale and retail margins. This explains why consumers may see slower or smaller price declines than futures headlines imply.
Regional differences will also remain significant. States have different taxes, environmental fuel requirements, transportation networks and refinery access. West Coast prices can remain elevated when local refinery capacity is constrained. Gulf Coast markets may respond faster to changes in crude and product supply. Rural consumers can face different competitive conditions from large metropolitan areas.
Diesel deserves separate attention. Freight trucks, farm equipment, construction machinery and many industrial operations depend on distillate fuel. High diesel prices can spread through the economy more broadly than a household gasoline bill. A durable reduction would lower costs for businesses and may eventually ease pressure on food and goods prices.
For household budgets, the arithmetic can be meaningful. A family buying 50 gallons a month saves $20 if the price falls by 40 cents. That may not transform its finances, but it releases cash for groceries, services or debt payments. Across millions of households, the aggregate effect can support consumer spending. The benefit is largest for lower- and middle-income workers who must commute and cannot easily switch transportation modes.
Airlines, Trucking, Shipping and Manufacturing: The Corporate Transmission
The beneficiaries of lower oil are not limited to consumers. Fuel-intensive companies can experience rapid changes in operating costs, although hedging policies and contracts determine how quickly the effects appear in financial results.
Airlines purchase jet fuel, a refined product whose price is influenced by crude, refinery capacity and regional supply. A sustained decline can improve margins, especially for carriers with limited hedges. But airlines may not retain the full benefit. Competition can push fares lower, and demand may change with economic conditions. The June CPI report showed airline fares still 26.5% higher than a year earlier, illustrating how strongly the conflict had affected travel costs.
Trucking companies face diesel expenses directly. Large carriers may use fuel surcharges that pass changes to customers with a lag. Smaller operators can be more exposed because they have less bargaining power and fewer hedging tools. Lower diesel can reduce bankruptcy pressure and improve cash flow, but falling fuel surcharges can also reduce reported revenue even when underlying profitability improves.
Ocean carriers and commodity traders are affected by both fuel and route risk. Cheaper bunker fuel lowers voyage costs, while safer chokepoints reduce insurance and rerouting expenses. If only crude prices fall but war-risk premiums remain high, the delivered-cost improvement will be smaller than benchmark prices suggest.
Manufacturers benefit through transportation and feedstocks. Petrochemicals, plastics, fertilizers and industrial chemicals have direct hydrocarbon exposure. Consumer-goods companies pay for packaging and logistics. Food producers absorb fuel costs in farming, processing, refrigeration and distribution. The timing of pass-through depends on contracts and inventories.
Retailers may see lower inbound freight costs, but they also face tariffs and wage expenses. A decline in oil does not necessarily mean broad goods deflation. It may simply offset another cost increase. This was particularly relevant in July 2026 as the Trump administration promoted new tariffs and affordability became a central political issue.
Energy producers face the opposite effect. Lower crude reduces revenue for upstream companies, especially those with high production costs or weak balance sheets. Oilfield-service firms depend on producer capital spending, although long-cycle projects and international contracts can cushion short-term price moves. Refiners may benefit or suffer depending on the relationship between crude costs and product prices. A lower input price is helpful only if gasoline and diesel margins remain strong.
The Federal Reserve’s Dilemma Did Not Vanish
The Federal Open Market Committee began a two-day meeting on July 28, with its decision and Chair Kevin Warsh’s press conference scheduled for July 29. The previous meeting had left the federal funds target range at 3.5% to 3.75%. The June statement described economic activity as solid and inflation as elevated, partly because of energy-related supply shocks.
Before the oil collapse, futures markets assigned an unusually meaningful probability to a quarter-point rate increase. Reuters reported that the implied probability reached about 40% during July 27 before easing toward 35%. That degree of uncertainty two days before a meeting was unusual in the modern era of forward guidance.
The case for an increase rested on credibility and persistence. Headline inflation remained above target, the labor market was stable, and energy and tariffs threatened additional price pressure. The unemployment rate was 4.2% in June, and the Fed said job gains had kept pace with the workforce. Policymakers could argue that the economy was strong enough to tolerate tighter policy.
The case for holding rested on the risk of reacting too aggressively to volatile supply shocks. Oil had already fallen sharply in June and again on July 27. Core CPI was 2.6% year over year, and monthly core CPI was unchanged in June. Additional tightening would not reopen Hormuz or increase refinery capacity. It could, however, raise borrowing costs for households and businesses.
The central-bank problem is that energy shocks can be both temporary and persistent. A one-time oil increase lifts the price level and then fades from annual inflation if prices stabilize. But repeated shocks can affect wages, expectations and business pricing. Policymakers must decide whether the public still trusts inflation to return toward 2%.
Warsh had also reduced the Fed’s reliance on conventional forward guidance, making market pricing less certain. That approach may restore flexibility, but it increases the risk of a surprise. A surprise hike could strengthen anti-inflation credibility while tightening financial conditions abruptly. A hold could be interpreted as confidence that energy relief would continue—or as reluctance to act before additional data.
The July 27 oil decline changed the balance but did not dictate the outcome. It gave policymakers evidence that geopolitical inflation can reverse quickly. At the same time, annual energy inflation remained high, and the durability of the diplomatic pause was unknown. The most defensible conclusion was that lower oil reduced the urgency of tightening, not that it made monetary policy easy.
Why Treasury Yields Barely Responded
If cheaper oil lowers inflation, Treasury yields might be expected to fall substantially. They did not. Reuters reported that the 10-year yield ended July 27 around 4.64%, only about seven basis points below the prior week’s peak above 4.71%. The 30-year yield remained above 5%, continuing its longest stretch there since 2007.
The limited response can be interpreted in several ways. First, bond investors may have doubted that the U.S.-Iran pause would last. If fighting resumes, the oil decline could reverse. Second, markets may have believed that inflation pressures had broadened beyond energy. Tariffs, housing, services and fiscal policy can keep yields elevated even when crude falls.
Third, long-term yields reflect more than expected Fed policy. They include term premium, fiscal borrowing needs, inflation risk and global demand for U.S. debt. A one-day oil move cannot resolve concerns about deficits or Treasury supply. Reuters noted weak demand at a five-year Treasury auction, reinforcing the idea that structural forces were keeping yields high.
Fourth, lower oil can support real economic activity by improving household purchasing power and corporate margins. That is disinflationary in one sense but growth-supportive in another. Stronger demand can limit the decline in real yields.
Finally, the bond market may have already priced some chance of de-escalation. Oil futures respond directly to supply risk, while Treasuries incorporate a wider set of scenarios. The same news can therefore produce a large commodity move and a small bond move without contradiction.
For borrowers, the practical lesson is that cheaper gasoline does not automatically mean lower mortgage rates, corporate-bond yields or credit-card costs. Those rates depend on the Fed, Treasury markets, credit spreads and lender conditions. Energy relief helps, but it is only one input.
Why Stocks Did Not Rally When Oil Collapsed
Historically, a sharp decline in oil can help broad equities by lowering costs and reducing inflation risk. On July 27, that positive force was overwhelmed by other concerns. The S&P 500 finished almost unchanged, the Dow gained 0.5%, and the Nasdaq fell 0.2%. Nvidia dropped 5%, and the Philadelphia Semiconductor Index fell sharply during the session.
The first explanation is sector composition. Energy companies lose revenue when oil falls, offsetting gains for fuel-consuming businesses. The modern S&P 500 is also dominated by technology and communications companies whose valuations are driven more by earnings growth, capital spending and interest rates than by gasoline costs.
The second explanation was the approaching earnings calendar. Microsoft and Meta were scheduled to report on Wednesday, followed by Amazon and Apple on Thursday. Investors wanted evidence that enormous spending on artificial-intelligence infrastructure would generate durable revenue and cash flow. Lower oil did not answer that question.
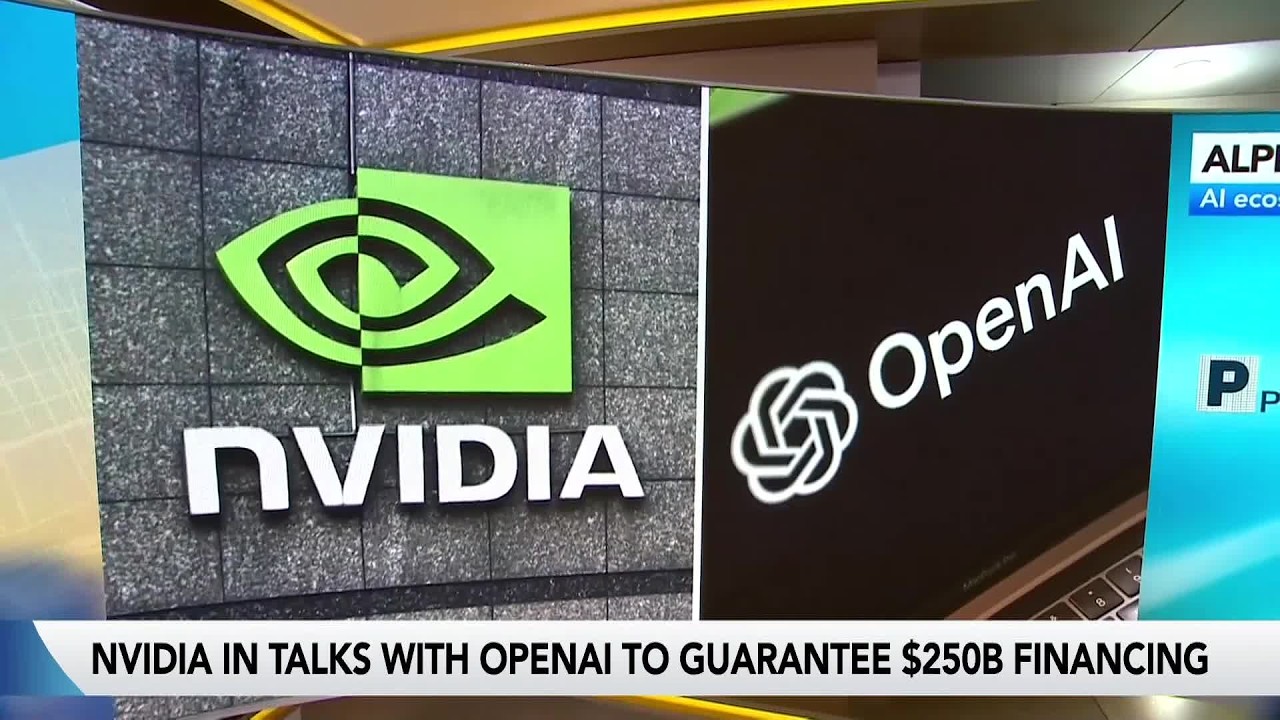
The third explanation was concern about circular AI financing. Bloomberg’s discussion focused on arrangements in which technology suppliers could provide financial support, guarantees or advance commitments that help customers buy their equipment. Nvidia was reported to be considering a major guarantee connected to OpenAI data-center financing, while broader agreements with South Korean partners raised questions about the direction and enforceability of capital flows.
Such arrangements can be economically rational when demand exceeds supply and infrastructure must be built quickly. They can also make it harder for investors to distinguish organic customer demand from demand supported by vendor financing. The issue is not that every partnership is improper. It is that shareholders need clarity on contractual obligations, counterparty risk, cash timing and the sustainability of end-user demand.
The fourth explanation was Fed uncertainty. A rate increase would raise the discount rate applied to long-duration growth stocks. Even if oil relief lowered the probability, markets still saw a meaningful chance of tightening. That limited enthusiasm.
The fifth explanation was geopolitical skepticism. Equity investors may have viewed the pause as temporary. A durable peace agreement could support risk assets, but a tactical pause does not remove the possibility of renewed attacks, shipping restrictions or retaliatory action.
The result was a useful reminder that markets do not trade one headline at a time. Oil, interest rates, earnings, AI capital spending, tariffs and war risk interacted. The positive shock from cheaper crude was real; it was simply not dominant.
AI Spending and Oil Risk Became Competing Market Narratives
The Bloomberg Businessweek Daily discussion that provided the starting point for this feature moved rapidly between crude, semiconductors, Nvidia, Big Tech earnings and the Fed. That sequence was not accidental. It reflected the structure of the 2026 market: geopolitical energy risk influenced inflation and rates, while artificial-intelligence spending influenced the largest companies in the equity indexes.
These narratives are connected. AI data centers require enormous amounts of capital, electricity, equipment, land, cooling and grid infrastructure. Their financing is highly sensitive to interest rates. If expensive oil lifts inflation and forces the Fed to maintain or raise rates, the discount rate applied to future AI profits rises. Financing costs for data centers and power projects also increase. Cheaper oil does not directly solve electricity constraints, but it can reduce macroeconomic pressure surrounding the investment boom.
At the same time, AI infrastructure can create its own energy demand. Natural-gas generation, transmission investment and backup power become part of the capital cycle. EIA expected U.S. natural-gas consumption in the electric-power sector to reach a record in 2027, driven partly by rising electricity demand and expansion of the gas-generating fleet. The connection between technology and energy is therefore becoming more direct.
Investors were questioning whether AI spending had reached a stage where top-line growth alone was insufficient. They wanted evidence of utilization, customer diversity, pricing power, cash returns and durable demand. Alphabet’s disclosure of usage metrics had not prevented a negative stock reaction after higher capital-spending guidance. That raised the bar for Microsoft, Meta, Amazon and Apple.
Nvidia’s role made the question more complicated. The company was not simply selling processors. It was helping coordinate an ecosystem involving foundries, memory suppliers, cloud companies, developers, data-center operators and sovereign projects. Advance orders and financing support can help suppliers expand capacity. They can also concentrate risk if the same participants finance, build and purchase from one another.
The analogy to earlier infrastructure booms is useful but incomplete. Railroads, telecom networks and energy pipelines often required suppliers, financiers and customers to make interdependent commitments before demand was fully visible. Some projects created essential infrastructure and enormous productivity gains. Others produced overcapacity, weak returns and financial losses. The decisive question was not whether spending was circular in a descriptive sense. It was whether underlying users eventually generated enough economic value to support the capital structure.
This helps explain why oil relief could not lift technology shares. The market was confronting a separate valuation test. A cheaper barrel lowers one macroeconomic risk, but it does not prove that hundreds of billions of dollars in AI investment will earn an acceptable return.
Affordability, Tariffs and the Midterm Election
The oil reversal occurred less than 100 days before the U.S. midterm elections, making gasoline prices an economic and political variable. Trump traveled to Michigan to promote affordability and his tariff agenda while touring a General Motors facility. Democrats, led in the House by Hakeem Jeffries, framed the Iran war as a contributor to higher living costs and argued that federal resources should be redirected toward domestic priorities.
Both parties had incentives to claim the affordability issue. Republicans could point to the oil decline as evidence that military pressure and diplomacy were producing results. Democrats could argue that the administration’s choices had contributed to months of higher energy costs and uncertainty. Neither narrative fully captures the market mechanics, but both respond to a genuine voter concern.
Gasoline has unusual political power because it is highly visible, frequently purchased and difficult for many households to avoid. A consumer may not know the current PCE inflation rate or ten-year Treasury yield, but can compare the price on a gas-station sign with last month or last year. The July 24 national average of $4.11 was therefore more than an energy statistic. It was a daily referendum on economic management.
Tariffs complicated the message. Import duties can raise costs for vehicles, components, machinery and consumer goods. The administration argued that tariffs supported domestic production and addressed unfair trade practices. Companies operating in Michigan and other manufacturing states had to assess both the protection offered by tariffs and the higher cost of imported inputs.
Lower oil can offset part of a tariff-related cost increase, but it does not eliminate it. An automaker may pay less to transport components while paying more for the components themselves. A retailer may benefit from lower ocean fuel costs while facing a higher customs bill. A household may save at the pump while paying more for imported goods.
The timing also matters. Crude prices can change instantly, wholesale gasoline prices with a shorter lag, and retail prices over days or weeks. Tariffs may pass through over months as inventories turn over and contracts reset. Voters can therefore experience several cost cycles at once, making it difficult to isolate responsibility.
The political value of the strike pause depends on durability. If gasoline prices decline into the fall, the administration can argue that affordability is improving. If talks fail and crude rebounds, the issue could return with greater force. Markets were effectively assigning a probability to those political outcomes while households waited for the pump price to change.
Who Benefits and Who Loses From a Sustained Oil Decline?
A lower crude price redistributes income across the economy. The overall effect on the United States is mixed because the country is both a major energy producer and a major consumer. The winners and losers depend on the level, speed and cause of the decline.
Households and Consumer-Facing Businesses
Most households benefit from lower gasoline and transportation costs. The effect is strongest for commuters, rural residents and lower-income families who spend a larger share of income on energy. Restaurants, entertainment companies and retailers can benefit when consumers have more discretionary cash.
However, lower oil caused by weak global demand would send a less positive signal than lower oil caused by restored supply. On July 27, the decline was primarily associated with reduced geopolitical risk, which is the more constructive version. If prices later fell because the economy entered recession, consumer businesses might not benefit.
Airlines, Logistics and Delivery Companies
Fuel-intensive transport businesses can experience improved margins, but hedging creates variation. An airline that locked in high fuel prices may receive less immediate benefit than an unhedged competitor. A trucking company using fuel surcharges may see both costs and revenue decline. Parcel-delivery companies may pass some savings to customers through surcharge formulas.
Industrials and Chemicals
Manufacturers using petroleum-based feedstocks can benefit from lower input costs. Packaging, plastics, paints, synthetic materials and fertilizers may become cheaper. Yet the relationship is not one-for-one because regional supply, natural-gas prices and processing margins also matter.
Exploration and Production Companies
Oil producers lose revenue as benchmark prices fall. Companies with low costs, strong balance sheets and hedges are more resilient. Highly leveraged producers or projects requiring high prices can face pressure. A temporary decline may have little effect on long-term capital plans, while a sustained move toward EIA’s 2027 forecast of $65 Brent could lead to slower drilling and more selective investment.
Oilfield Services and Equipment
Service companies depend on producer spending rather than the daily oil price alone. International and offshore projects often have long planning cycles. Short-cycle U.S. shale activity can react faster. Baker Hughes rose after reporting stronger results and guidance even as oil fell, demonstrating that company-specific orders and execution can dominate a single commodity session.
Refiners
Refiners buy crude and sell gasoline, diesel and other products. Their profitability depends on crack spreads, utilization and regional product balances. Lower crude can be positive if product prices remain firm. It can be negative if fuel demand weakens and margins collapse. In July, low gasoline inventories kept margins elevated, limiting retail relief while potentially supporting refiners.
Banks and Credit Markets
Banks with energy exposure may see reduced cash flow among producers, but lower inflation and lower consumer fuel bills can improve credit quality elsewhere. The net effect depends on geography and loan mix. High-yield bond markets may respond negatively if leveraged exploration companies become riskier.
Renewable Energy and Electric Vehicles
Cheaper gasoline can reduce the immediate economic incentive to switch to electric vehicles or improve efficiency. But purchase decisions also depend on regulation, technology, charging infrastructure and total ownership cost. Renewable-power economics are more closely tied to electricity markets, tax policy and financing rates than to crude oil, although lower inflation and rates can help capital-intensive projects.
The sector map shows why broad indexes can react weakly to an oil decline. Benefits and costs offset one another, and the cause of the decline matters as much as the price itself.
How Companies Should Interpret the Signal
Corporate planners should avoid treating the July 27 price as a permanent forecast. The more useful approach is to separate operational decisions by time horizon and identify which assumptions are most sensitive to conflict outcomes.
In the near term, businesses can update fuel surcharges, freight budgets and working-capital estimates using current market prices while preserving a volatility buffer. Procurement teams should track not only Brent and WTI but also diesel, jet fuel, regional gasoline, freight rates and insurance premiums. A company can be exposed to rising delivered costs even when crude declines.
For the next several quarters, scenario planning should include alternative shipping routes, inventory requirements and supplier concentration. Firms dependent on Gulf feedstocks may need diversified sources. Companies with low inventory may benefit from normalization but remain vulnerable to renewed disruption.
Capital investment decisions require a longer view. An energy producer should not cancel a multiyear project because of one session. A transport company should not assume permanently low fuel. The relevant questions are cost curves, balance-sheet resilience and the range of prices under which a project remains viable.
Hedging policy deserves particular attention. Hedging can reduce volatility but also delay the benefit of falling prices. Boards should understand whether hedges are designed to protect cash flow, earnings, customer pricing or debt covenants. A hedge that appears to “lose money” when oil falls may still have achieved its risk-management purpose.
Companies should also examine contractual pass-through. If lower fuel automatically reduces customer surcharges, margin improvement may be limited. If input costs decline faster than selling prices reset, margins may expand temporarily. Analysts evaluating results should distinguish operational improvement from a favorable commodity lag.
Finally, management teams should communicate uncertainty honestly. Specific point forecasts can create false precision in a conflict-driven market. Ranges, sensitivities and scenario disclosures provide more useful information. Investors should be told which costs are hedged, which are floating, how long inventory lasts and what happens if key routes close again.
Four Scenarios for Oil, Inflation and Markets
The most useful framework is not a single prediction but a set of scenarios. Each combines diplomacy, physical flows, oil prices and macroeconomic consequences. The ranges below are analytical illustrations rather than forecasts or investment recommendations.
| Scenario | Diplomatic and Physical Outcome | Oil Implication | Inflation and Fed Implication | Market Implication |
|---|---|---|---|---|
| Durable settlement | A monitored agreement restores regular Hormuz traffic, reduces attacks in the Red Sea and allows production to restart. | Brent trends toward EIA’s lower medium-term forecast as inventories rebuild. | Headline inflation falls, gasoline declines and pressure for additional tightening eases. | Consumer and transport sectors benefit; energy shares face revenue pressure; bond yields may decline if broader inflation also improves. |
| Managed pause | Attacks remain limited, negotiations continue, but shipping stays below normal and legal control of Hormuz remains disputed. | Oil remains volatile in a broad range, with risk premiums returning on negative headlines. | Inflation improves gradually but remains vulnerable. The Fed emphasizes data dependence. | Equities trade more on earnings and rates; energy volatility persists; long yields remain elevated. |
| Renewed limited strikes | Talks fail and attacks resume, but major infrastructure and shipping routes remain partially operational. | Oil rebounds toward or above recent highs, though strategic releases and demand response cap the move. | Headline inflation reaccelerates and the Fed faces stronger pressure to tighten or hold rates high. | Energy shares outperform relative to fuel users; technology valuations face pressure from higher yields. |
| Major chokepoint disruption | Hormuz and Red Sea routes suffer prolonged closure or infrastructure damage, overwhelming alternative pipelines and shipping capacity. | Crude rises sharply and becomes disorderly; refined-product prices may move even more. | Inflation rises while growth weakens, creating a severe stagflationary dilemma. | Broad risk assets weaken, volatility rises, credit conditions tighten and sector dispersion increases. |
Scenario One: A Durable Settlement
The most constructive outcome would include mutually accepted transit rules, credible monitoring, reduced attacks by aligned groups and a path toward broader talks over Iran’s nuclear program. Shipping and production would recover in stages. Insurance costs would fall, and refiners could rebuild inventories.
Under this scenario, EIA’s forecast of Brent averaging $74 in the third quarter and $65 in 2027 would become more plausible. U.S. gasoline could follow the projected path toward $3.40 in the fourth quarter. Lower energy inflation would improve real household income and reduce pressure on the Fed.
The equity effect would not be uniformly positive. Airlines, logistics companies and consumer businesses would benefit, while producers could face lower earnings. Technology stocks might gain indirectly from lower yields, but their performance would still depend on AI returns and earnings.
Scenario Two: A Managed Pause
This may be the most realistic near-term case. The United States and Iran refrain from major escalation, but neither resolves the fundamental dispute. Ships move under temporary arrangements, traffic improves slowly, and intermittent attacks continue.
Oil would likely remain headline-sensitive. Prices could decline on diplomatic progress and rebound on each violation. Companies would retain higher inventories and security costs. Consumers would see partial gasoline relief rather than a complete return to prewar prices.
The Fed would gain time but not certainty. Policymakers could hold rates while waiting for inflation data, yet keep tightening available if energy prices rose again. Treasury yields might remain structurally high because the conflict would be only one of several inflation risks.
Scenario Three: Renewed Limited Strikes
If negotiations collapsed, the United States could resume airstrikes and Iran could retaliate against bases, ships or regional infrastructure. A limited escalation would restore part of the oil risk premium quickly. The July 27 decline showed how much premium can move in one session; the same mechanism works in reverse.
The price response would depend on physical damage. If ships still moved and production continued, crude might revisit recent highs without entering a historic shortage. Governments could release reserves, and high prices would reduce demand. Nevertheless, gasoline and diesel would rise, worsening affordability.
The Fed would face a difficult communications challenge. Raising rates cannot create oil supply, but repeated shocks can unanchor expectations. Holding rates could be criticized as complacent, while tightening could deepen the growth damage.
Scenario Four: A Major Chokepoint Disruption
The severe case involves a prolonged interruption at Hormuz combined with Red Sea insecurity or damage to export infrastructure. Alternative pipelines would be insufficient, and shipowners could refuse transit even without a formal closure.
In this environment, strategic reserves and non-Gulf production would provide only partial relief. Refined-product shortages could become more important than crude benchmarks. Diesel, jet fuel and petrochemical inputs might rise faster than headline oil.
The macroeconomic result would resemble a stagflation shock: higher inflation, weaker real income, lower consumer confidence and pressure on corporate margins. The Fed would have to balance price stability against financial and economic stress. Equity and credit markets would likely become much more volatile.
The Indicators That Matter More Than Political Rhetoric
Statements from presidents and foreign ministers can move markets, but operational data determine whether relief becomes real. Readers following the story should focus on a small set of measurable indicators.
Daily Vessel Transits
The number and type of vessels crossing Hormuz and Bab el-Mandeb provide the clearest evidence of normalization. Tankers matter more than total ship counts for the oil balance. Vessel size, destination and cargo are also important. A few small product tankers do not replace normal traffic by very large crude carriers.
Production Restarts and Shut-In Volumes
Exporting countries may need time to restore output after storage constraints forced shut-ins. EIA’s estimates of Middle Eastern production losses and recovery will be essential. Company and ministry statements should be compared with tanker loadings and independent tracking data.
War-Risk Insurance and Freight Rates
Insurance and tanker rates reveal how private operators assess danger. A diplomatic announcement that does not lower these costs is less economically meaningful. Declining premiums indicate that underwriters and shipowners believe risk is becoming manageable.
Crude Futures Curves
The relationship between near-term and later contracts can show whether traders view the problem as immediate scarcity or lasting tightness. A steep premium for prompt barrels suggests inventories are scarce. A flatter curve may indicate improved supply expectations.
Refinery Margins and Product Inventories
Gasoline and diesel prices depend on refining capacity and inventories. EIA’s weekly petroleum data can show whether product stocks are rebuilding. Narrower crack spreads would increase the chance that lower crude reaches consumers.
U.S. Retail Gasoline and Diesel
The national average is politically important, but regional data are more useful for households and businesses. A sustained decline over several weeks would confirm that futures relief is reaching the physical market.
Inflation Expectations
Market-based measures, consumer surveys and business surveys can indicate whether lower fuel is improving confidence. Policymakers care not only about current inflation but also about whether people expect it to persist.
Fed Communications
The July 29 statement and Warsh press conference would reveal whether policymakers considered the oil decline sufficient to change their assessment. Language about supply shocks, expectations and future policy would be more informative than a single rate decision.
Diplomatic Structure
A durable agreement should include more than optimistic language. Investors should look for written transit rules, monitoring, dispute-resolution procedures, treatment of fees, naval coordination and a timetable for broader negotiations.
Historical Lessons From Oil Shocks
History does not provide a mechanical forecast, but it offers useful distinctions. Oil shocks have different economic effects depending on whether they originate in supply disruption, demand collapse, deliberate production restraint or financial stress.
The 1970s shocks combined supply restrictions with economies that used more oil per unit of output, stronger wage-price dynamics and less credible monetary policy. The result was persistent inflation and weak growth. Today’s U.S. economy is less energy-intensive, but households and transport systems remain exposed to gasoline and diesel.
The 1990 Gulf War produced a sharp oil spike followed by a rapid reversal as military outcomes became clearer and supply fears eased. That episode demonstrates how geopolitical premium can disappear faster than physical conditions change.
The 2008 oil peak occurred near the end of a global credit and commodity boom. Prices then collapsed as the financial crisis destroyed demand. Lower oil was not bullish because it reflected recession. This is why the cause of a decline matters.
The 2014–2016 collapse was driven by rising supply, including U.S. shale, and a shift in producer strategy. Consumers benefited, but energy-sector investment and employment weakened. Credit stress appeared among leveraged producers.
The 2020 collapse was uniquely shaped by pandemic demand destruction. WTI futures briefly traded below zero because storage and contract mechanics became binding. That event showed that futures prices can reflect logistical constraints as much as long-term resource value.
The 2022 shock following Russia’s invasion of Ukraine affected crude, natural gas, electricity and food. Governments used reserves, subsidies and monetary tightening. The experience reinforced the importance of energy networks and the difficulty of separating temporary shocks from broader inflation.
The 2026 U.S.-Iran conflict combines elements of several episodes. It is a supply-route shock, a geopolitical-risk shock and an inflation-expectations shock. It has also interacted with tariffs, high public borrowing needs and an AI investment boom. No historical analogy captures the full combination.
The key lesson is that the first price move is rarely the final economic effect. A spike can reverse while annual inflation remains high. A decline can help consumers while hurting producers. Monetary policy can respond to expectations even when it cannot fix the original supply problem.
What the July 27 Session Revealed About Market Priorities
The most revealing feature of the session was not the oil decline alone. It was the hierarchy of market attention. Crude traders responded directly to the diplomatic pause. Bond investors acknowledged it but remained focused on broader inflation and fiscal risk. Equity investors concentrated on technology earnings, AI financing and the Fed.
This divergence suggests that the oil shock had become one part of a larger uncertainty regime. Markets were no longer treating energy as the only macroeconomic variable. They were evaluating whether high interest rates, tariffs and capital spending could coexist with strong earnings and consumer demand.
Small-cap stocks outperformed during parts of the session, which may reflect their sensitivity to domestic costs and rates. The Dow benefited from a different sector mix than the Nasdaq. Energy shares weakened. Semiconductor shares fell on AI concerns. These crosscurrents produced a nearly flat S&P 500.
The session also illustrated why broad market narratives can mislead. “Oil down is good for stocks” is directionally reasonable but incomplete. The effect depends on why oil fell, which sectors dominate the index, what the Fed is expected to do and what company-specific news is arriving simultaneously.
For financial analysis, the correct approach is to identify transmission channels rather than repeat correlations. Lower oil reduces costs and inflation risk. Lower energy earnings offset some benefits. If lower oil reduces rates, growth stocks may gain. If bond investors distrust the decline, that channel is weaker. If AI concerns dominate, technology can fall anyway.
July 27 was therefore a lesson in conditional relationships. Markets reacted rationally to different parts of the same information set.
Frequently Asked Questions
Why did oil prices fall so sharply on July 27, 2026?
Oil fell because the United States paused its latest airstrikes against Iran, reducing the perceived probability of an immediate escalation that could further disrupt the Strait of Hormuz and regional oil infrastructure. Traders removed part of the geopolitical risk premium that had pushed Brent above $100 during the previous week. Profit-taking and position adjustment likely amplified the move.
Did the United States and Iran reach a peace agreement?
No. The parties paused attacks and exchanged messages through intermediaries, but there was no comprehensive signed peace agreement. Iran disputed reports that it had requested formal talks. Major disputes remained over Hormuz transit, maritime authority, Iran’s nuclear program and regional security.
What price did Brent crude settle at?
Reuters reported that front-month ICE Brent settled at $88.36 on July 27, down 8.7%. The Associated Press cited a Brent figure of $85.87. The difference likely reflects a different benchmark reference, contract or timestamp. Financial articles should identify the contract and data source rather than combine the figures as though they were the same settlement.
What happened to WTI crude?
Reuters reported that U.S. West Texas Intermediate settled at $82.61 a barrel, down $6.70, or 7.5%. Prices moved lower again during July 28 trading as hopes for a diplomatic framework continued.
Is the Strait of Hormuz open?
Some vessels continued to move through the strait, but traffic remained far below normal. Reuters cited data indicating fewer than 10 commodity vessels per day crossed during the weekend and estimated flows at roughly 15% of the prewar rate. Iran and the United States continued to dispute transit rules.
How much oil normally passes through Hormuz?
EIA estimated that roughly 20 million barrels a day of oil passed through the strait in 2024, equivalent to about 20% of global petroleum liquids consumption. The route also carries significant liquefied natural gas volumes.
Will gasoline prices fall immediately?
Wholesale fuel prices can react quickly, but retail gasoline usually follows with a lag. Refinery margins, inventories, taxes and distribution costs affect the final price. EIA expected average gasoline prices near $3.80 in the third quarter and around $3.40 in the fourth quarter, but those forecasts depend on continued improvement in supply and shipping.
Why was gasoline still above $4 if oil fell?
The national regular-gasoline average was $4.11 on July 24, before the major crude decline. Retail stations were selling fuel refined and distributed under earlier cost conditions. Low gasoline inventories and high margins also limited the immediate benefit from lower crude.
Does lower oil automatically reduce inflation?
It reduces direct energy inflation if the decline persists. It can also lower transportation and production costs over time. But inflation depends on housing, food, wages, tariffs, services and expectations as well. A one-day oil decline does not guarantee that overall inflation returns to the Fed’s 2% target.
What was the latest U.S. inflation rate?
The June CPI was 3.5% higher than a year earlier. Core CPI, excluding food and energy, was up 2.6%. Energy prices were 15.7% higher than a year earlier even after falling sharply during June. The May PCE price index was up 4.1% year over year, with the June PCE release scheduled for July 30.
Could lower oil prevent a Federal Reserve rate increase?
It reduced the urgency of an increase but did not determine the decision. The Fed also considered annual inflation, labor-market strength, tariffs, expectations and financial conditions. The federal funds target range before the July meeting was 3.5% to 3.75%.
Why did Treasury yields not fall more?
Bond investors may have doubted the durability of the pause and remained concerned about broader inflation, fiscal borrowing and long-term term premiums. Lower oil can also support growth, which offsets part of the disinflationary effect on yields.
Why did stocks not rally?
Technology and semiconductor concerns dominated the session. Investors were focused on Big Tech earnings, AI capital spending, Nvidia-related financing reports and the possibility of a Fed increase. Energy shares also declined with oil, offsetting benefits for fuel-consuming sectors.
What is circular AI financing?
The phrase describes arrangements in which companies within the same AI ecosystem finance, guarantee or commit to purchases from one another. Such structures can accelerate infrastructure development, but investors want to know whether demand is independently sustainable and how financial obligations are distributed.
Does cheaper oil help technology companies?
Indirectly, it can. Lower energy inflation may reduce interest-rate pressure, supporting valuations and financing. But AI data-center economics depend more directly on electricity, chips, utilization, customer demand and capital costs than on crude oil alone.
Which businesses benefit most from lower oil?
Airlines, trucking companies, delivery businesses, manufacturers, chemical producers and consumer-facing firms can benefit. The actual effect depends on hedges, contracts and competitive pricing. Households also benefit from lower gasoline and transportation costs.
Which businesses are hurt?
Oil producers can lose revenue, and highly leveraged operators may face financial pressure. Oilfield-service companies may see weaker future spending if prices remain low. Refiners can benefit or suffer depending on product margins rather than crude prices alone.
Why did Baker Hughes rise while oil fell?
The company reported results and guidance that exceeded expectations, and investors focused on its order outlook and company-specific execution. A stock’s response can diverge from the daily commodity move when earnings information is more important.
Could oil fall toward $65?
EIA forecast Brent averaging $65 in 2027 as production recovered and inventories accumulated. That outcome depends on improving Middle East trade flows and rising supply. It is a forecast, not a guaranteed price target.
Could oil return above $100?
Yes. Renewed attacks, a major shipping interruption, infrastructure damage or a breakdown in talks could restore the risk premium. The speed of the July decline demonstrates how quickly prices can also move in the opposite direction.
Why is diesel so important?
Diesel powers freight trucks, farm machinery, construction equipment and many industrial operations. High diesel costs can spread into food and goods prices. EIA’s July 24 daily-price page showed a national average of $5.28 a gallon.
What role does China play in the oil outlook?
China is one of the world’s largest crude importers. Reuters reported that weaker Chinese demand helped prevent oil from rising more dramatically during the conflict. Stronger or weaker Chinese consumption can therefore change the global balance even if Middle East supply is unchanged.
Why can the United States still have expensive gasoline if it produces so much oil?
Oil and refined products trade in global markets. U.S. refiners use different crude grades, and domestic producers sell at prices influenced by international conditions. Shipping disruptions abroad can raise the opportunity cost of petroleum in the United States.
What should readers watch next?
The most important indicators are Hormuz vessel traffic, production restarts, war-risk insurance, freight rates, gasoline and diesel inventories, refinery margins, the Fed’s July decision, the June PCE inflation report and the structure of any written diplomatic agreement.
The Bottom Line
The July 27 oil collapse was economically significant because it removed part of the immediate fear that the U.S.-Iran war would produce a larger supply catastrophe. It improved the near-term outlook for gasoline, transportation costs and headline inflation. It also reduced some of the pressure on the Federal Reserve to respond aggressively to another energy surge.
But the market’s restrained response outside crude was equally important. Stocks did not rally because AI spending, technology earnings and valuation concerns remained unresolved. Treasury yields did not collapse because investors were unsure the diplomatic pause would last and because inflation risk extended beyond oil.
The physical market still lagged behind the financial one. Hormuz traffic was far below normal, production remained shut in, and Red Sea routes were exposed to attack. A genuine normalization requires ships, barrels, insurance and inventories—not only statements.
The most accurate interpretation is therefore conditional. If diplomacy produces enforceable transit rules and sustained reopening, the oil decline can become the start of a broader disinflationary process. If the pause fails, the risk premium can return rapidly. The 9% move was not an all-clear. It was the market’s latest estimate of how much danger had temporarily receded.
How Investors Can Read the Oil Signal Without Turning It Into a Trade Call
A single-session collapse in crude is useful information, but it is not a complete investment thesis. The responsible way to interpret the move is to ask which assumptions changed, which assets are directly exposed, and which risks remain independent of oil. That framework is more durable than trying to convert a geopolitical headline into an immediate buy-or-sell conclusion.
Separate Price Direction From Economic Cause
Falling oil can be constructive when it reflects restored supply or reduced geopolitical risk. It can be negative when it reflects collapsing demand. July 27 was primarily a relief move tied to diplomacy, so the initial macroeconomic interpretation was favorable: lower expected inflation, reduced transport costs and less immediate pressure on household budgets. That does not guarantee that every company or index benefits.
Investors should compare crude with measures of demand. Industrial activity, freight volumes, airline bookings and consumer spending help distinguish supply relief from recession fear. If oil declines while economic indicators remain stable, the move is more likely to support consumption. If oil and cyclical assets fall together, the signal may be weaker growth.
Distinguish Benchmark Exposure From Earnings Exposure
An oil producer’s revenue may be linked directly to Brent or WTI, but corporate earnings also depend on production volumes, hedges, royalties, taxes and costs. An airline’s fuel bill depends on jet fuel rather than crude alone. A refiner’s profitability depends on product margins. A chemical company may benefit from lower feedstocks but suffer if customer demand weakens.
This is why sector labels are insufficient. Two companies in the same industry can have opposite reactions because of balance sheets, hedges, geography and contract structures. The daily commodity move should be mapped onto the company’s actual cash-flow drivers.
Watch the Yield Channel
For many equities, the most important effect of oil is indirect. If lower energy prices reduce inflation expectations and Treasury yields, valuation multiples may rise. If yields remain high because of fiscal or tariff concerns, the benefit is smaller. On July 27, the modest bond response limited this channel.
Technology stocks were particularly sensitive because a large portion of their value depends on future earnings. Higher discount rates reduce the present value of those earnings. A sustained oil decline could support the sector through lower rates, but only if investors also gain confidence in AI returns and corporate cash flow.
Consider Credit Before Equity
Commodity moves can affect debt capacity before they affect reported earnings. Highly leveraged energy producers may face weaker interest coverage if oil remains low. Fuel-intensive companies may experience the opposite. Credit spreads, borrowing-base reviews and debt maturities can reveal stress earlier than headline profit measures.
Banks and private-credit funds should assess concentration. A portfolio heavily exposed to shale producers has different sensitivity from one focused on airlines or transport. The same oil move can improve one borrower’s credit quality and weaken another’s.
Avoid False Precision in Price Targets
Conflict markets produce wide distributions. A precise forecast such as “Brent will be $78 in three months” can imply more certainty than the evidence supports. Scenario ranges are more appropriate. Analysts can estimate outcomes under reopening, managed disruption and renewed conflict, then evaluate which companies remain resilient across all three.
EIA’s forecast provides a transparent official baseline, but it is conditional. Its projected decline toward $65 Brent in 2027 depends on production recovery and inventory accumulation. The forecast should be used as one scenario, not as a guaranteed destination.
Do Not Confuse Volatility With Opportunity
Large price changes attract attention, but volatility also increases the probability of error. Market prices can reverse before a position can be adjusted. Options become expensive. Liquidity can deteriorate. Political statements may arrive outside normal trading hours.
A disciplined investor therefore focuses on risk capacity, diversification and time horizon. The article’s analysis can help readers understand transmission channels, but it cannot determine whether a particular security is suitable for a particular person. That requires financial objectives, tax circumstances, liquidity needs and tolerance for loss.
Use Confirming Evidence
The strongest confirmation of the July 27 move would be rising vessel traffic, falling insurance costs, rebuilding inventories and lower retail fuel prices. Without those developments, futures may be pricing an outcome that has not yet occurred. Market participants should treat physical data as a test of the financial narrative.
The same principle applies to the equity side. AI spending should be tested against cloud revenue, utilization, customer adoption and cash generation. Lower oil and lower rates can improve the environment, but they do not replace company fundamentals.
What the Bloomberg Discussion Got Right—and What Required Qualification
The Bloomberg program captured the central contradiction of the day: crude was collapsing, yet the rest of the market was not responding with the enthusiasm normally associated with a major reduction in energy risk. Its guests also highlighted the overlap among war, inflation, politics, AI spending and the Fed. Several points were especially valuable, while others required additional context to prevent overinterpretation.
Correct: Oil Was Pricing a Tactical Pause
The program’s description of the market as pricing a pause rather than a permanent change was supported by later reporting. The United States had suspended strikes, but no final agreement existed. Iran continued to assert control over Hormuz, and aligned groups carried out or claimed attacks elsewhere. The distinction between de-escalation and resolution was essential.
Correct: Equities Had Other Priorities
Bloomberg emphasized that mega-cap earnings and the Fed were dominating stock-market attention. The closing data confirmed this view. The Dow rose, the S&P was almost flat, and the Nasdaq fell as Nvidia and other semiconductor shares weakened. Oil relief was not strong enough to override concerns about AI spending and monetary policy.
Correct: Circular Financing Deserved Scrutiny
The discussion of Nvidia and OpenAI focused on whether financial support from a supplier could help customers purchase the supplier’s technology. That is a legitimate analytical question. Vendor financing is not automatically evidence of weak demand, and advance commitments can solve real infrastructure bottlenecks. Investors still need details about guarantees, obligations, counterparties and the share of demand supported by financing.
Correct: Worker Value Depends on How AI Is Used
The KPMG segment distinguished workers who use AI to amplify judgment from those who simply delegate tasks. That framework is relevant to financial work. Analysts who challenge assumptions, verify sources and apply domain expertise can produce more value than users who accept automated output without scrutiny.
The oil story itself demonstrates why. A transcript contained two different Brent references, rapidly changing political claims and statements that were not equivalent to confirmed facts. Human judgment was needed to identify the contract discrepancy, distinguish diplomacy from peace, and compare futures prices with physical shipping.
Qualification: The Brent Figures Were Not a Single Clean Settlement
The supplied editorial notes cited Brent near $85.87, while Reuters reported front-month ICE Brent settling at $88.36. A rigorous article should not choose one number without explanation. The correct practice is to identify the source, contract and timestamp. The discrepancy did not change the conclusion that Brent fell sharply, but it mattered for accuracy.
Qualification: A Lower Oil Price Does Not Immediately Equal Lower Consumer Inflation
The program correctly connected crude with inflation, but the transmission requires time. Retail gasoline reflects earlier crude costs and refinery margins. Transportation and goods prices may adjust over months. Companies can retain savings as margin. The Fed also focuses on broader inflation and expectations.
Qualification: The Stock-Oil Relationship Is Conditional
The presenters noted that stocks often rise when oil falls. That relationship depends on the cause and index structure. Energy producers lose when crude declines. Technology companies may be driven by rates and earnings. If oil falls because of recession, stocks can fall too. July 27 was a case in which positive supply-risk news coexisted with separate technology concerns.
Qualification: Political Claims Needed Attribution
Trump said the United States was having good talks with Iran, while Iranian officials disputed the characterization of formal negotiations. Both statements were newsworthy, but neither could be treated as definitive proof of the private diplomatic process. The article therefore attributes the claims and relies on observable shipping and market data for confirmation.
Qualification: AI Job Security Is Not Guaranteed by Better Prompting Alone
The KPMG research suggested that workers who use AI as a thought partner can outperform baseline outputs. That does not guarantee employment. Business models, labor demand, regulation and technology will continue to change. The durable lesson is that subject-matter knowledge, critical thinking and verification remain valuable—not that any specific interaction style eliminates displacement risk.
The Broader Editorial Lesson
A live financial program must move quickly among breaking stories. A long-form article has a different responsibility. It can slow the sequence, identify which facts were confirmed, explain conflicting data and connect market prices to physical operations. The best use of the video was therefore as a map of the day’s questions rather than as a substitute for research.
That approach produces a more useful conclusion. The oil decline mattered, but its economic significance depended on whether diplomacy changed physical flows. The Fed mattered, but its decision depended on more than one commodity move. AI financing mattered, but its risk depended on contractual detail and end-user demand. Workers’ use of AI mattered, but only when combined with expertise and judgment. Each theme required a separate test.
Editorial Outlook
The next phase of this story will be decided by evidence that is less dramatic than a presidential statement but more economically important: the daily return of tankers, the reopening of export terminals, the decline of war-risk premiums, the restoration of production and the rebuilding of gasoline and diesel inventories. Those indicators will determine whether July 27 becomes a turning point or merely another temporary reversal in a volatile conflict.
For U.S. readers, the most visible test will be the gas station. For the Federal Reserve, it will be the combination of headline inflation, core inflation and expectations. For companies, it will be the delivered cost of fuel, freight and materials. For investors, it will be whether lower energy risk translates into lower yields and stronger earnings rather than being overwhelmed by AI, tariff and fiscal concerns.
Until those confirmations arrive, the correct stance is analytical caution. The oil market delivered meaningful relief, and the continuation of talks improved the probability of a better outcome. But a price chart cannot enforce a ceasefire, guarantee a shipping lane or rebuild an inventory tank. The economic opportunity is real precisely because the remaining risk is real as well.
Sources
- Bloomberg Television — Bloomberg Businessweek Daily, July 27, 2026
- Reuters — “TRADING DAY: Oil plunges, stocks ’n’ bonds shrug,” July 27, 2026
- Reuters — “Oil prices settle at lowest in over a week, as US pauses attacks on Iran,” July 27, 2026
- Reuters — “Trump says US and Tehran having ‘good talks’ as drones hit Iran’s neighbours,” July 27, 2026
- Reuters — “Oil touches over one-week low as pause in attacks brings hope of US/Iran deal,” July 28, 2026
- Reuters — “Oman presented regional mechanism for Hormuz to Iran, source says,” July 28, 2026
- Reuters — “Stocks mixed, oil and Treasury yields drop on Iran-US pause,” July 27, 2026
- Reuters — “Why oil prices haven’t gone crazy despite 5 months of US-Iran war,” July 20, 2026
- Reuters — “AI anxiety sparks tech rout, broad selloff in Asian markets,” July 28, 2026
- Associated Press — “How major US stock indexes fared Monday 7/27/2026”
- U.S. Energy Information Administration — Short-Term Energy Outlook, July 2026
- U.S. Energy Information Administration — World Oil Transit Chokepoints
- U.S. Energy Information Administration — Daily Energy Prices
- U.S. Energy Information Administration — Global Energy Security Data
- U.S. Bureau of Labor Statistics — Consumer Price Index, June 2026
- U.S. Bureau of Labor Statistics — Employment Situation, June 2026
- Federal Reserve — FOMC Statement, June 17, 2026
- Federal Reserve — July 2026 Calendar and FOMC Schedule
- U.S. Bureau of Economic Analysis — Personal Consumption Expenditures Price Index
- U.S. Bureau of Economic Analysis — Economic Release Schedule
Affiliate disclosure: Businessfinance.news may earn compensation from qualifying purchases or actions completed through certain links on this website. This does not influence our editorial analysis, reporting, or conclusions.
SEO-PACKAGE
SEO-TITLE: Oil Plunges After U.S.–Iran Pause: Inflation, Fed and Market Impact
URL-SLUG: oil-plunge-us-iran-pause-inflation-fed-markets
WORDPRESS TAGS: oil prices, crude oil, Brent crude, WTI crude, U.S.-Iran conflict, Strait of Hormuz, inflation, Federal Reserve, interest rates, gasoline prices, energy markets, stock market, Treasury yields, Middle East, Nvidia, artificial intelligence, Big Tech earnings, Kevin Warsh, Donald Trump, market analysis
IMPORTANT PEOPLE MENTIONED: Donald Trump, Kevin Warsh, Benjamin Netanyahu, Hakeem Jeffries, Jensen Huang, Ed Ludlow, Carol Massar, Tim Stenovec, Chris Kennedy, Joe Mathieu, Rahsaan Shears
FOCUS KEYWORD: oil price plunge after U.S.-Iran pause
META DESCRIPTION: Oil plunged after the U.S.-Iran strike pause. Here’s what it means for inflation, gasoline, the Fed, stocks and the Strait of Hormuz.