The August stock market rally began with a forceful move on Wall Street on Monday, August 3, 2026. The Dow Jones Industrial Average closed at a record, the S&P 500 climbed back to within a fraction of its own high, and the Nasdaq Composite surged more than 2%. The immediate catalyst was a sharp fall in crude oil after President Donald Trump said he had paused planned attacks on Iran while diplomatic contacts were pursued. Lower oil prices pulled Treasury yields down, eased fears of another inflation shock and gave investors room to rebuild positions in technology and other growth stocks.
Research cutoff: August 4, 2026, 5:40 a.m. EDT (11:40 a.m. CEST).
The simplest answer to why stocks rose is therefore straightforward: the market temporarily priced a lower probability of an imminent escalation in the U.S.-Iran war, a smaller near-term energy shock and less pressure on the Federal Reserve to raise interest rates aggressively. That shift arrived at the same time as a strong corporate earnings season, improving U.S. manufacturing data and renewed evidence that the largest cloud-computing companies are generating real revenue from artificial intelligence.
But the rally did not settle the larger debate. By early Tuesday, August 4, Iran was still denying that direct negotiations with the United States were taking place, shipping through the Strait of Hormuz remained severely constrained, a vessel reported being struck near the waterway and oil prices had begun to rebound. The bond market also remained uneasy after the Federal Reserve’s July meeting, when Chair Kevin Warsh offered little forward guidance and long-dated Treasury yields jumped. In other words, Monday’s move was a powerful repricing of risk, not proof that the underlying risks had disappeared.
This distinction matters. A durable advance would require several developments to reinforce one another: credible diplomatic progress, sustained improvement in Gulf shipping, lower energy inflation, a Federal Reserve that preserves its inflation-fighting credibility, continued earnings growth and evidence that artificial-intelligence investment can produce cash returns rather than only higher capital expenditure. Monday showed how quickly markets can rally when those conditions appear more likely. Tuesday’s early reversal in oil showed how quickly that optimism can be tested.
Key Takeaways
- Main development: U.S. stocks rallied sharply on August 3 as oil prices and Treasury yields fell on hopes of de-escalation between the United States and Iran.
- Market close: The Dow rose 1.32% to a record 53,178.41, the S&P 500 gained 1.48% to 7,600.50 and the Nasdaq Composite advanced 2.13% to 25,913.90.
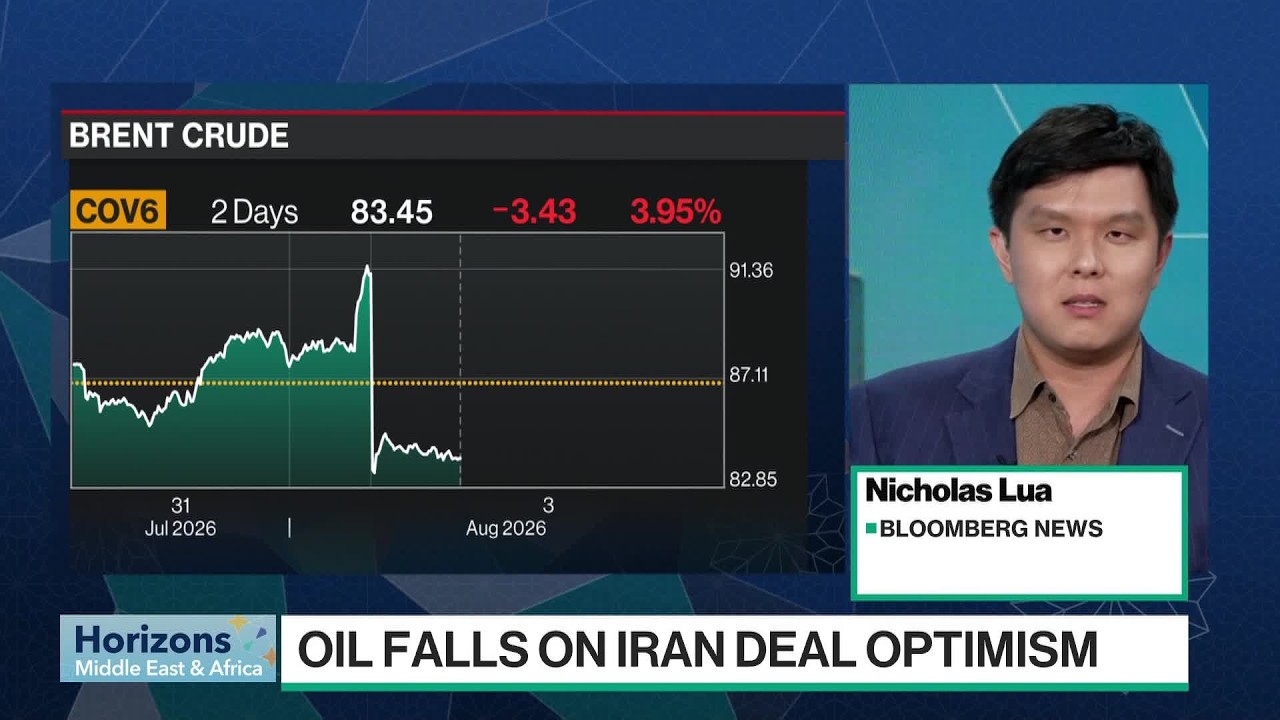
- Oil move: Front-month Brent fell 7.0% to settle at $83.77 a barrel, while U.S. WTI declined 5.1% to $80.34, according to Reuters.
- Why it mattered: Cheaper oil reduced the immediate inflation premium embedded in bonds and equities, helping growth stocks recover after a volatile July.
- What supported the rally: Strong second-quarter earnings, Amazon’s surge above a $3 trillion market value, improving manufacturing activity and broad market participation strengthened the move.
- Why the rebound remains fragile: Iran disputed the existence of direct talks, Hormuz traffic remained depressed and Brent rebounded above $84 early Tuesday.
- What comes next: Investors face June job-openings data on August 4, the ISM services report on August 5, the July employment report on August 7 and the July consumer-price report on August 12.
Market Snapshot
U.S. close on August 3, 2026
- Dow Jones Industrial Average: 53,178.41, up 693.38 points or 1.32%
- S&P 500: 7,600.50, up 110.78 points or 1.48%
- Nasdaq Composite: 25,913.90, up 540.04 points or 2.13%
- Communication services: up 4.3%, the strongest S&P 500 sector
- Energy: down 1.2%, the weakest S&P 500 sector
- U.S. exchange volume: 19.36 billion shares, above the 20-session average of 17.66 billion
Original source: Reuters market report for August 3, 2026
The August 3 Stock Market Rally in One Sentence
The August 3 stock market rally was a coordinated relief move across equities, bonds and commodities: investors sold oil, bought Treasuries and returned to technology shares after a weekend shift in U.S. rhetoric reduced the perceived probability of immediate military escalation with Iran.
That description is more precise than saying stocks rose because “peace talks began.” Whether formal U.S.-Iran talks were actually under way was disputed. Trump said negotiations were occurring and that planned attacks had been suspended. Iranian Foreign Ministry spokesperson Esmaeil Baghaei said no negotiations with Washington were taking place and no meetings were scheduled. Iran acknowledged only discussions with Oman about management of the Strait of Hormuz.
Markets often move before diplomatic facts are fully established. Prices reflect changes in probabilities, not only confirmed outcomes. On Monday, the probability that the next major event would be a U.S. strike appeared to fall. That was enough to reduce the geopolitical premium in crude oil. Because energy prices had become a central input into U.S. inflation expectations, the oil decline also reduced pressure on Treasury yields. Lower yields, in turn, increased the present value investors were willing to assign to future corporate earnings, especially in technology.
The chain can be summarized as follows: fewer expected attacks led to a lower expected risk of prolonged disruption in the Strait of Hormuz; a lower disruption risk led to cheaper oil; cheaper oil reduced the expected inflation path; a softer inflation path reduced the expected need for higher interest rates; and lower discount rates improved the relative appeal of long-duration equities.
Each link in that chain is conditional. If diplomacy fails, oil can rise again. If oil rises, the Federal Reserve may face greater pressure to tighten. If yields rise, richly valued technology companies can come under renewed pressure even when their earnings remain strong. Monday’s rally was therefore best understood as the market showing what it would pay for de-escalation—not as a final judgment that de-escalation had been achieved.
What Happened Across Markets on August 3
The rally was broad enough to be more than a single-stock event. Reuters reported that advancing stocks outnumbered decliners by 2.62 to 1 on the New York Stock Exchange and by 3.01 to 1 on Nasdaq. The Russell 2000, which represents smaller U.S. companies and tends to be more sensitive to domestic financing conditions, rose 1.7%. The equal-weighted S&P 500 gained about 1%, indicating that the move extended beyond the index’s largest companies.
At the same time, leadership was clearly concentrated in growth and communication-services shares. Communication services rose 4.3%, helped by Meta Platforms and Alphabet. Amazon gained 4.6% and crossed a $3 trillion market capitalization for the first time. Microsoft extended a sharp post-earnings rebound. The Nasdaq’s 2.13% advance outpaced the Dow and S&P 500, consistent with a market in which lower yields were especially beneficial to companies whose valuations depend heavily on long-term growth.
Energy stocks moved in the opposite direction. The S&P 500 energy sector fell 1.2% as crude prices plunged. That divergence was logical rather than contradictory. Lower oil can support the broader economy by reducing input costs and household fuel expenses while simultaneously reducing the expected revenue and cash flow of producers. Airlines, transportation companies, chemical manufacturers and other fuel-intensive businesses can benefit, while exploration-and-production companies and oilfield-service providers may lose some pricing power.
The Dow’s record close also reflected company-specific news. Boeing rose sharply after the Federal Aviation Administration certified the 737-7, clearing the smallest member of the 737 MAX family for commercial service. The certification removed a long-standing regulatory obstacle and improved visibility for deliveries to Southwest Airlines and other customers. It did not erase Boeing’s safety, production and balance-sheet challenges, but it was a concrete operational milestone rather than a purely speculative catalyst.
After the closing bell, the earnings picture remained supportive. Palantir reported second-quarter revenue of about $1.94 billion, up 93% from a year earlier, and raised its 2026 revenue outlook to between $8.150 billion and $8.158 billion. Onsemi reported $1.604 billion in quarterly revenue, up 9% year over year, non-GAAP earnings of $0.74 a share and $425.4 million in free cash flow. Both reports reinforced the idea that investors were willing to reward technology companies when revenue, margins and cash generation could be demonstrated.
The day’s message was therefore not simply “risk on.” It was more selective: falling oil and yields supported the whole market, but the largest gains flowed toward companies with visible earnings momentum, credible artificial-intelligence exposure or a meaningful company-specific catalyst.
Why Oil Was the Most Important Price on the Screen
In ordinary market conditions, a single-day move in crude may be treated as one factor among many. In the summer of 2026, oil had become the organizing variable for inflation, interest rates and geopolitical risk. The war involving the United States and Iran had severely disrupted flows through the Strait of Hormuz, a route that before the conflict handled roughly one-fifth of global daily oil and liquefied-natural-gas supply. The International Energy Agency described the disruption as the largest supply shock in the history of the global oil market.
The economic importance of Hormuz goes well beyond Iranian exports. The strait is the primary seaborne route for oil and gas produced by Saudi Arabia, the United Arab Emirates, Kuwait, Qatar, Iraq, Bahrain and Iran. A prolonged blockage can remove not only current barrels from the market but also access to much of the world’s spare production capacity. Alternative pipelines can bypass part of the route, but not enough to replace normal seaborne flows.
That is why diplomatic language can generate unusually large price moves. On Monday, front-month Brent futures fell $6.35, or 7.0%, to settle at $83.77 a barrel, while U.S. West Texas Intermediate crude fell $4.33, or 5.1%, to $80.34. The direction was unambiguous: traders removed a significant portion of the immediate war premium.
The decline mattered for inflation because the United States had already experienced a substantial energy shock. The Bureau of Labor Statistics reported that consumer energy prices were 15.7% higher in June than a year earlier, with gasoline up 26.7%. Headline CPI was 3.5% year over year even though gasoline fell sharply during June itself. The Federal Reserve’s preferred PCE price index was up 3.7% in June, and core PCE was up 3.3%. Both measures remained well above the central bank’s 2% goal.
When oil falls, the first effect appears in wholesale energy markets and gasoline prices. The second effect reaches transportation and production costs. The third affects inflation expectations, wage negotiations and corporate pricing decisions. The fourth reaches monetary policy. A one-day crude decline does not mechanically lower all those variables, but it changes the probability distribution around them.
For investors, the timing is critical. The Federal Reserve meets again on September 15 and 16. Before then it will receive two additional monthly inflation readings and two employment reports. A sustained retreat in oil would make it easier for policymakers to argue that the 2026 energy shock is fading. A renewed rise would make it harder to dismiss inflation as temporary, particularly when core PCE is still above 3% and manufacturing activity is accelerating.
Why lower oil can lift both stocks and bonds
Stocks and bonds do not always rise together. Strong economic data can lift equities while pushing bond prices down and yields up. A recession scare can produce the opposite combination. On August 3, however, the same development benefited both markets: lower oil reduced the risk of an inflationary supply shock without immediately implying a collapse in demand.
Bond investors responded by buying Treasuries, which pushed yields lower. Equity investors then benefited from two channels. First, lower yields reduced the discount rate applied to future earnings. Second, lower energy costs improved the expected margin outlook for many companies and the purchasing-power outlook for consumers. The combination was particularly helpful for growth shares, small caps and discretionary businesses.
The favorable interpretation depends on why oil is falling. Oil that declines because global demand is collapsing can be a recession signal and may hurt stocks. Oil that declines because supply routes are reopening or military risk is receding can be disinflationary without being recessionary. Monday’s market treated the move as the second type.
Fact Box
The inflation backdrop before Monday’s oil decline
- June CPI: down 0.4% month over month, up 3.5% year over year
- June core CPI: unchanged month over month, up 2.6% year over year
- June energy CPI: down 5.7% month over month, but up 15.7% year over year
- June gasoline CPI: down 9.7% month over month, but up 26.7% year over year
- June PCE inflation: 3.7% year over year
- June core PCE inflation: 3.3% year over year
Original sources: U.S. Bureau of Labor Statistics June CPI report and Bureau of Economic Analysis June PCE report
Why the Diplomatic Rally Was Immediately Vulnerable
Monday’s price action rested on a diplomatic premise that was never fully verified. Trump said talks were occurring and described the moment as a final opportunity for Iran to reach an agreement. Iran denied that direct negotiations were taking place or scheduled. Tehran said its only active discussions concerned Oman and the management of the Strait of Hormuz.
That contradiction did not prevent markets from rallying because the most immediate fact was that the United States had not carried out the threatened attacks. A canceled strike has economic value even when the negotiating process is unclear. It reduces the near-term probability of retaliation against regional energy infrastructure, military bases or commercial shipping.
Yet by early August 4, the limits of the relief trade were visible. Reuters reported that Brent had rebounded 1.24% to $84.81 a barrel by 0800 GMT, while WTI was up 0.37% at $80.64. Shipping traffic through Hormuz remained little changed at deeply depressed levels. A cargo vessel reported being hit by an unknown projectile near the strait off Oman. Those developments did not erase Monday’s decline, but they demonstrated that the physical supply problem had not been solved.
Financial markets can move on rhetoric for a day; a durable revaluation requires evidence. For oil, that evidence would include more tanker transits, lower insurance costs, fewer attacks, clearer rules for passage and a credible mechanism for enforcing any agreement. For bonds, it would include sustained declines in inflation expectations rather than a single session of lower yields. For stocks, it would include continued earnings growth without a renewed surge in financing costs.
The market’s early-Tuesday response was therefore rational. Oil recovered only part of Monday’s fall because diplomacy was uncertain, not because escalation had definitely resumed. Equities could still retain much of their advance if investors believed the probability of a major immediate strike remained lower. But the burden of proof had shifted back toward the diplomatic process.
Physical flows matter more than headlines
The most reliable test of de-escalation is not the number of statements issued by either government. It is whether energy actually moves. Before the war, Hormuz handled about 20 million barrels per day of oil and related liquids. The IEA estimated that flows averaged only about 2.7 million barrels per day during March, April and May after the conflict began. That collapse forced producers and consumers to redraw trade routes, draw down inventories and pay higher freight and insurance costs.
Even a partial reopening could produce a large economic benefit. More barrels reaching Asia would reduce scarcity premiums, improve refinery planning and lower the need for emergency rerouting around Africa. More Qatari LNG reaching global buyers would also ease pressure on gas and electricity markets. But until the physical data improve, the oil market will continue to attach a premium to the possibility that diplomatic language fails to translate into passage.
This is why the August 3 rally should not be dismissed as irrational, but neither should it be mistaken for confirmation. It was a forward-looking response to a lower perceived risk. The follow-through depends on whether the world’s most important energy chokepoint begins functioning more normally.
The Bond Market Was the Rally’s Real Stress Test
The equity headlines on August 3 were dramatic, but the deeper question was whether the Treasury market would cooperate. Stocks can rally for many reasons: short covering, earnings surprises, lower oil, momentum strategies, or simple relief after a difficult month. A durable re-rating of risk assets is harder when long-term borrowing costs are rising and investors are demanding a larger premium to hold government debt.
That is why the decline in Treasury yields mattered at least as much as the drop in crude. Lower yields reduce the discount rate applied to future corporate cash flows, which is especially important for growth companies whose expected profits sit farther in the future. They also reduce the immediate pressure on mortgages, corporate refinancing, leveraged finance, and public-sector interest expense. In practical terms, a stock market that wants to pay higher multiples for technology earnings needs the bond market to stop moving violently against it.
The relief on Monday came after an unusually difficult Federal Reserve week. On July 29, the Federal Open Market Committee left the federal funds target range unchanged at 3.5% to 3.75%, but the vote was 9–3. Three officials preferred a quarter-point increase. That split sent a clear message: even after softer monthly inflation readings, the central bank did not view the inflation problem as conclusively solved.
The communication around the decision added to the unease. Chair Kevin Warsh offered less forward guidance than markets had become accustomed to under previous Fed leadership. Investors were left to infer how much weight the committee would place on oil, tariffs, labor demand, inflation expectations, and financial conditions. The absence of a precise reaction function may be intellectually defensible, particularly in a volatile geopolitical environment, but it raises the price of uncertainty. When investors cannot forecast the central bank’s next move with confidence, they tend to demand extra compensation for holding longer-maturity bonds.
That compensation is often described as the term premium. A Treasury yield can be thought of as a combination of expected short-term interest rates over the life of the bond plus a premium for inflation uncertainty, fiscal supply, volatility, and the risk that investors need to sell before maturity. A central bank can influence the expected path of short rates. It cannot fully dictate the term premium, especially when markets are worried about inflation credibility and the volume of debt coming to market.
The bond market’s response after the July meeting was therefore more than a routine repricing of the next Fed move. The 30-year Treasury yield moved above 5.20% for the first time since the middle of 2007, according to Reuters. Options markets also reflected a sharp increase in demand for protection against further bond losses. That combination—higher long yields and more expensive volatility protection—suggested that investors were not merely debating whether the Fed would hike once in September. They were debating whether the entire long-term rate regime had shifted.
Why Long-Term Yields Matter for Stocks
Higher Treasury yields can pressure equities through several channels. They make bonds more competitive with stocks, raise corporate borrowing costs, reduce the present value of future earnings, tighten mortgage and consumer-credit conditions, and increase the financing burden on leveraged businesses. The impact is rarely uniform: profitable companies with strong balance sheets usually handle higher rates better than speculative companies dependent on repeated external financing.
Why Monday’s Yield Decline Helped
On August 3, lower oil prices eased one of the most immediate inflation threats. If energy costs remain lower, headline inflation can cool, businesses face less pressure from freight and input costs, and consumers retain more disposable income. That does not automatically eliminate underlying inflation, but it reduces the probability that the Fed must respond to another energy shock with tighter policy.
The yield decline also coincided with an extraordinary U.S.–Japan effort to support the yen. Reuters reported that Japan sold almost $60 billion and the United States sold an estimated $5 billion to $10 billion in coordinated intervention. The direct purpose was to interrupt the yen’s slide, not to support U.S. government bonds. Yet the operation had an important secondary interpretation in Treasury markets.
Japan is one of the largest foreign holders of U.S. government debt. When the yen falls sharply, Japanese authorities and financial institutions can face pressure to raise dollars or rebalance foreign assets. Market participants therefore worry that defending the currency could eventually involve selling Treasuries. By joining the intervention, the United States reduced the amount of adjustment Japan had to carry alone and signaled that disorderly currency weakness would not simply be tolerated. Some bond investors interpreted that as lowering the immediate risk of forced Japanese Treasury sales.
That linkage should be described carefully. The intervention itself is a confirmed policy action. The idea that it prevented Treasury liquidation is a market inference rather than a formally stated objective. It nevertheless illustrates how interconnected the present market has become: a currency move in Tokyo can affect demand for U.S. debt, which can influence mortgage rates, technology valuations, and the S&P 500 within hours.
One Better Day Did Not Resolve the Supply Problem
Even with Monday’s rally, the Treasury market still faced a large structural challenge: the government must finance substantial deficits at a time when inflation remains above target and the Fed is no longer suppressing volatility through extensive forward guidance. The U.S. Treasury projected $739 billion of privately held net marketable borrowing for the July–September quarter, $68 billion more than estimated in May. It projected another $628 billion for the October–December quarter.
Those figures do not guarantee higher yields. Treasury demand depends on a wide range of forces, including banks, pensions, insurers, foreign reserve managers, households, money-market funds, and relative yields abroad. But heavier supply increases the importance of price. If marginal buyers require more compensation, auctions can clear at higher yields even when the Fed is not changing its policy rate.
This is the central tension for the August equity rebound. Stocks benefited on Monday from the idea that inflation risk had eased. Bonds still had to absorb the consequences of fiscal borrowing, uncertainty about the Fed, and the possibility that oil could reverse. A lasting stock-market advance would be easier if long yields stabilized because inflation genuinely improved—not merely because traders temporarily covered bearish positions.
A Stronger Economy Can Be Good for Profits and Difficult for Bonds
The macroeconomic backdrop complicated the optimistic interpretation. The Institute for Supply Management reported that its July manufacturing purchasing managers’ index rose to 55.6, up 2.3 percentage points and the highest reading since May 2022. A reading above 50 indicates expansion. Manufacturing employment also expanded for the first time in 33 months.
For companies, that was encouraging. A broadening industrial recovery can support orders, transportation, capital spending, machinery demand, and cyclical earnings. It can also improve the quality of a market rally by reducing dependence on a small group of technology companies. For bond investors, however, the same report raised a less comfortable possibility: if activity remains robust, the economy may be able to tolerate higher rates, and the Fed may have less urgency to ease.
This is an example of “good news” becoming ambiguous for markets. Strong manufacturing is positive for revenue and employment. Yet when inflation is above target, strong demand can keep wages and prices firmer than the Fed wants. The resulting effect on stocks depends on whether earnings upgrades are large enough to offset a higher discount rate.
The broader data offered a mixed picture rather than a simple boom. The Bureau of Economic Analysis estimated that real gross domestic product grew at a 1.5% annualized rate in the second quarter, down from 2.1% in the first quarter. The June personal consumption expenditures price index was 3.7% higher than a year earlier, while the core measure excluding food and energy was up 3.3%. Consumer-price data for June showed headline CPI down 0.4% from May but still 3.5% higher than a year earlier; core CPI was unchanged on the month and up 2.6% year over year.
Those numbers explain why policymakers could reasonably disagree. Monthly inflation had improved, partly because energy prices fell sharply, but annual inflation remained too high. Growth had moderated but not collapsed. Manufacturing had accelerated. The labor market had not yet delivered enough evidence to determine whether demand was cooling or reaccelerating.
The August Data Calendar Became a Market Catalyst
Several scheduled releases were therefore capable of changing the narrative quickly. The Bureau of Labor Statistics was due to publish the July Job Openings and Labor Turnover Survey on August 4, productivity and labor-cost data on August 6, and the July employment report on August 7. July CPI was scheduled for August 12 and producer prices for August 13.
The sequence mattered. A strong employment report combined with firm wages could reinforce expectations for a September rate increase. Softer hiring and cooling labor costs could do the opposite, particularly if oil remained lower. CPI would then determine whether the improvement was broad or mainly energy-driven.
Investors watching the August rally should therefore avoid treating any single number as decisive. The most constructive combination for equities would be continued earnings growth, moderate hiring, easing wage pressure, and disinflation outside energy. A less comfortable combination would be strong activity, renewed oil inflation, and a labor market tight enough to force the Fed into additional tightening.
That is why the market’s response function can appear inconsistent. A strong jobs report may lift economically sensitive stocks but hurt long-duration technology shares if yields rise. A weak report may initially support bonds but raise questions about corporate demand. The decisive issue is not whether a data point is “good” or “bad” in isolation. It is whether the data alter the balance between earnings growth and the cost of capital.
Earnings Gave the Rally a Fundamental Base
Oil and bonds explained why investors were willing to take more risk on August 3. Earnings explained why they had something credible to buy. The rebound was not occurring in an information vacuum. Corporate America was reporting unusually strong profit growth, and the largest technology platforms were showing that demand for artificial-intelligence infrastructure remained substantial.
According to LSEG data cited by Reuters, second-quarter earnings for the 304 S&P 500 companies that had reported by Monday were on track to rise 29.3% from a year earlier. Approximately 85.2% had exceeded analyst expectations. Those figures were well above the long-run experience of a typical reporting season and gave investors a reason to look through some of the macro volatility.
There is an important distinction between an earnings rebound and a valuation rebound. Stock returns can be driven by higher profits, higher price-to-earnings multiples, or both. During the earlier phase of the AI rally, investors often paid increasingly high multiples for projected growth. By the start of August, after a difficult July, the market had become more selective. Prices had fallen in several momentum names while reported earnings continued to advance. That meant part of the August move could be justified by an improved relationship between price and earnings rather than by optimism alone.
This does not mean the entire market had become cheap. The largest U.S. growth companies still carried demanding expectations, and index concentration remained high. It means the hurdle had changed. Investors were no longer simply asking whether AI would be transformative. They were asking which companies could convert spending into revenue, which could protect margins, and which had the balance sheets to fund the next stage.
Amazon’s Rally Illustrated Both the Opportunity and the Accounting Complexity
Amazon was one of the clearest examples. The shares rose 4.6% on August 3 and pushed the company’s market value above $3 trillion for the first time. The enthusiasm followed a second quarter in which net sales increased 20% to $200.6 billion and Amazon Web Services revenue rose 37% to $42.2 billion. AWS operating income reached $16.6 billion, demonstrating the extraordinary profitability of cloud infrastructure when utilization and scale improve.
Yet the headline net-income figure required context. Amazon reported $62.6 billion of net income, but that included $53.4 billion of pre-tax other income, largely related to the value of its investment in Anthropic. That was economically meaningful, but it was not equivalent to recurring operating profit generated by retail or cloud customers. Investors evaluating the quarter had to separate the revaluation gain from the underlying business.
Free cash flow offered another caution. Amazon said trailing-12-month free cash flow fell to negative $7.6 billion, primarily because purchases of property and equipment rose as the company invested in AI. The market rewarded Amazon because AWS growth, margins, and strategic positioning suggested those investments could create future returns. But the cash-flow figure demonstrated the scale of the wager.
This is a recurring theme across the hyperscalers: reported revenue can be strong at the same time that capital intensity rises even faster. The companies may be producing excellent operating results while also committing unprecedented sums to data centers, networking equipment, power, cooling, and chips. A responsible analysis must hold both facts at once.
Microsoft and Alphabet Showed AI Moving Into Revenue
Microsoft’s fiscal fourth-quarter results strengthened the case that AI infrastructure was becoming a commercial platform rather than remaining an experiment. Quarterly revenue reached $90.0 billion, up 18% year over year. Microsoft Cloud revenue increased 27% to $59.3 billion, and Azure passed $100 billion in annual revenue for the first time. Commercial remaining performance obligations reached $678 billion, giving the company a large contracted backlog.
Alphabet delivered a similarly forceful cloud result. Google Cloud revenue rose 82% to $24.8 billion in the second quarter, while cloud operating income reached $8.8 billion. The magnitude of the acceleration suggested that demand was not limited to one vendor and that businesses were continuing to shift workloads toward AI-enabled cloud services.
These results matter because they answer one of the market’s central questions: who is paying for the infrastructure? Cloud customers, software developers, governments, and enterprises were increasingly purchasing capacity and services. Revenue growth at Azure, AWS, and Google Cloud showed that the investment cycle had a real demand side.
However, the existence of demand does not settle the question of return on capital. Hyperscalers can grow revenue while industry-wide capacity expands so quickly that future pricing becomes more competitive. They can also build facilities before electricity connections, chips, or customer workloads are available. The quality of the AI trade therefore depends not only on growth but on utilization, pricing power, depreciation, and the length of customer commitments.
Meta Showed the Cost Side of the AI Race
Meta’s second-quarter results highlighted the other side of the equation. The company reported capital expenditures of $31.08 billion for the quarter, while total costs and expenses rose 55% from a year earlier. Meta’s advertising engine remained powerful, and AI can improve recommendations, targeting, engagement, and creative tools. Even so, the increase in spending showed how quickly the financial profile of a platform can change when management decides that infrastructure capacity is strategically essential.
The relevant question is not whether the spending is “too high” in the abstract. It is whether the incremental operating profit generated by better products and greater usage eventually exceeds the cost of the capital, equipment, energy, and depreciation. That calculation may take years. In the meantime, the market will use quarterly revenue growth, margins, free cash flow, backlog, and customer adoption as imperfect proxies.
The AI Earnings Checklist
Investors looking beyond headline revenue can watch five practical indicators: cloud backlog, data-center utilization, free cash flow after capital spending, operating-margin direction, and evidence that customers are deploying AI in production rather than running short trials. Strong results across all five would support a durable expansion. Revenue growth accompanied by weakening cash flow and rising external financing would deserve more caution.
The AI Trade Was Rotating From Infrastructure to Adoption
The Bloomberg discussion that inspired this article captured an important change in market thinking. The first phase of the AI investment cycle rewarded the companies that supplied the scarce infrastructure: advanced semiconductors, networking equipment, servers, cloud capacity, and data-center real estate. The next phase may increasingly reward companies that use those tools to improve productivity.
That is a broader and potentially healthier opportunity set. Financial-services companies can apply AI to fraud detection, underwriting, customer service, compliance, and software development. Healthcare organizations can use it in imaging, clinical documentation, drug discovery, trial design, and administrative workflows. Manufacturers can deploy predictive maintenance, quality control, supply-chain optimization, and robotics. Retailers can improve inventory, pricing, recommendations, and logistics.
The investment case is not that every company using AI becomes a technology stock. It is that successful adoption can raise output per employee, lower error rates, reduce working capital, or improve revenue conversion. Those gains would eventually appear in ordinary financial statements through higher margins, faster growth, or lower capital requirements.
The difficulty is measurement. Companies often describe pilots and partnerships before they disclose financial effects. Productivity gains can also be offset by implementation costs, software fees, model errors, cybersecurity requirements, or the need for human review. The market may therefore overestimate near-term benefits even when the long-term technology is genuinely important.
A rotation toward adopters would also change the structure of the rally. Instead of a narrow advance led by chip designers and a handful of platforms, leadership could broaden toward banks, industrials, healthcare, consumer businesses, and software companies with demonstrable use cases. That broadening would reduce concentration risk and give the index more ways to grow earnings.
Palantir Became a Test of AI Monetization
Palantir’s results after the August 3 close offered one of the strongest examples of revenue converting from narrative into reported performance. The company said second-quarter revenue reached $1.94 billion, up 93% from a year earlier. U.S. government revenue rose 90% to $809 million, while U.S. commercial revenue increased 149% to $764 million. Palantir raised its full-year revenue forecast to approximately $8.15 billion to $8.158 billion from about $7.65 billion.
The shares jumped in after-hours trading because the report combined growth, profitability, and a higher outlook. That combination matters more than any single promotional statement. It suggested that customers were not merely testing Palantir’s software but expanding contracts and integrating it into operations.
Even so, Palantir remained a high-expectation stock. Rapid growth can justify a premium valuation, but it can also create vulnerability if customer concentration rises, government procurement slows, competition intensifies, or future growth merely returns toward normal. The result strengthened the company-specific case; it did not eliminate valuation discipline.
Onsemi Added an Industrial Dimension
Onsemi reported second-quarter revenue of $1.604 billion, up 9% year over year, and non-GAAP earnings of $0.74 per share. Free cash flow was $425.4 million. The company’s exposure to automotive and industrial markets made the report useful beyond the pure AI narrative. It indicated that parts of the semiconductor industry tied to power management, sensing, vehicles, and industrial applications could improve even when they were not at the center of generative-AI enthusiasm.
This distinction is important. The semiconductor industry is not one trade. Advanced accelerators can face different demand, supply, margin, and geopolitical conditions from analog chips, power semiconductors, memory, or automotive components. A broad technology recovery is more credible when multiple end markets participate rather than when the entire sector depends on a single product cycle.
External Financing Is the Next Risk to Watch
The scale of planned AI investment is beginning to exceed internally generated cash flow at some companies and projects. FactSet estimated that hyperscaler cash capital expenditure could exceed $690 billion in fiscal 2026 and approach $800 billion on a calendar basis when leases and prepayments are included. Reuters has also documented growing pressure on Big Tech free cash flow as investment accelerates.
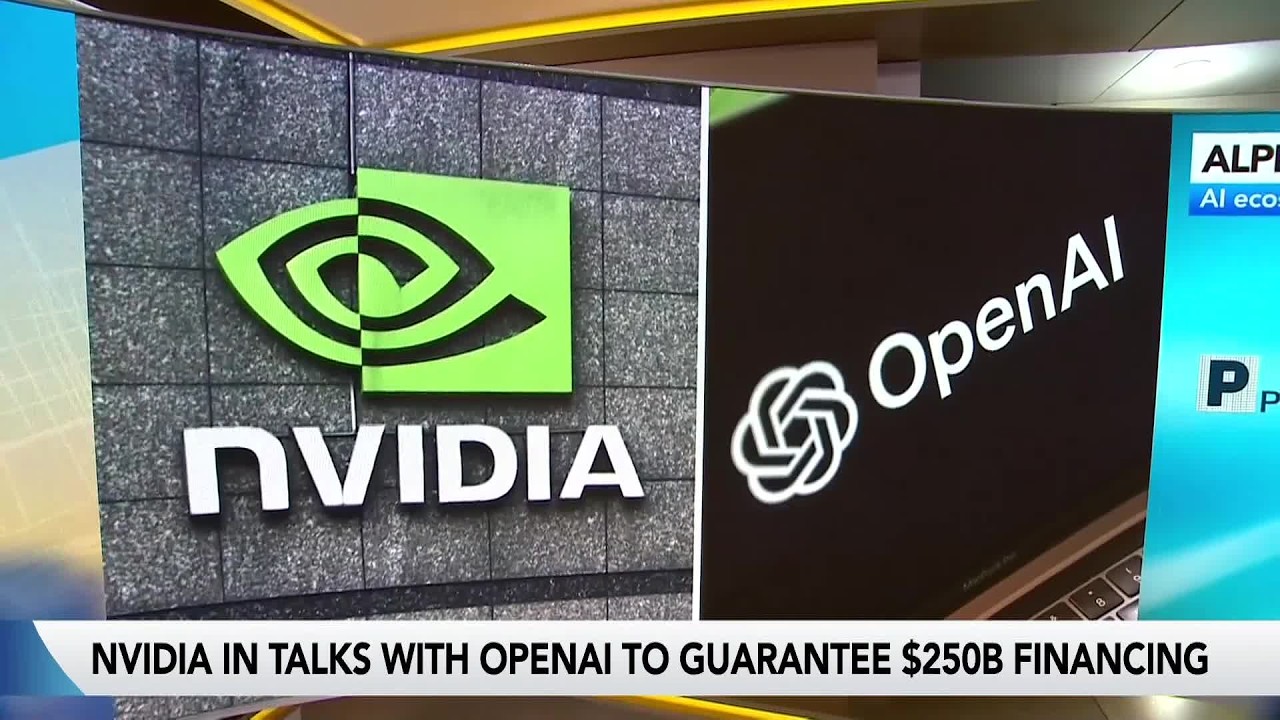
External financing is not inherently a warning sign. Debt can be an efficient way to fund long-lived assets when expected returns exceed borrowing costs. The risk emerges when projects rely on optimistic demand forecasts, assets become obsolete faster than expected, or financing structures recycle capital within a small ecosystem of customers, suppliers, cloud providers, and model developers.
That is where a company-specific disappointment could become a macro event. If an AI developer cuts capacity plans, the effect can travel through chip orders, data-center construction, utilities, private credit, and equipment suppliers. If lenders become less willing to finance projects, the slowdown can spread beyond the original borrower. The more leverage and contractual interdependence the system accumulates, the less isolated each earnings miss becomes.
For now, the leading platforms were reporting enough demand to keep the buildout moving. The August rally reflected that evidence. The next stage will be judged by cash generation, not only revenue growth.
Market Breadth Improved, but Leadership Was Still Uneven
The August 3 rally was broader than a simple move in one or two megacap technology stocks. On the New York Stock Exchange, advancing shares outnumbered decliners by roughly 2.6 to 1, while the ratio on Nasdaq was about 3 to 1. The Russell 2000 gained 1.7%, the S&P MidCap 400 rose, and the equal-weighted S&P 500 advanced about 1%. Those measures suggested that investors were adding risk outside the largest index constituents.
Breadth matters because a capitalization-weighted index can rise even when many underlying companies are falling. When small caps, midcaps, and equal-weighted indices participate, the move is more likely to reflect a generalized improvement in financial conditions. Lower oil and lower yields were especially helpful to smaller companies, which tend to have less bargaining power, more floating-rate debt, and greater sensitivity to domestic demand.
Still, leadership was far from uniform. Communication-services stocks rose 4.3%, making the sector the strongest part of the S&P 500. Energy fell about 1.2% as lower crude prices reduced expected producer revenue. Consumer staples and healthcare also lagged. That pattern was consistent with a risk-on session: investors favored growth and cyclical exposure while reducing the relative appeal of defensive sectors.
The divergence also showed why “lower oil is good for stocks” is incomplete. Lower fuel costs can help airlines, logistics companies, manufacturers, restaurants, retailers, and consumers. They can hurt exploration-and-production companies, oilfield-service providers, refiners under certain margin conditions, and regions dependent on energy investment. The index-level effect depends on which channel dominates.
Amazon’s $3 Trillion Milestone Was Powerful but Concentrated
Amazon’s move above a $3 trillion market value was symbolically important. It joined a very small group of companies that had reached that scale and reinforced the idea that cloud and AI infrastructure were becoming core economic utilities. Yet the milestone also illustrated concentration risk. When a few companies represent a large share of index value, their earnings and capital-spending decisions can dominate the experience of investors who believe they own a diversified market.
Concentration is not automatically irrational. Large companies become large because they generate substantial cash flow, build durable competitive advantages, or operate in enormous markets. The risk is that index investors may unknowingly accept a large exposure to the same underlying factors: cloud demand, semiconductor supply, AI capital expenditure, long-term yields, and regulatory policy.
A broader rally in industrials, financials, healthcare, and consumer companies would reduce that dependency. The August 3 participation outside megacaps was therefore encouraging, but one day was not enough to establish a new regime.
Boeing Provided a Company-Specific Industrial Catalyst
Boeing shares rose sharply after the Federal Aviation Administration certified the 737-7. Boeing said the aircraft could seat 135 to 160 passengers and fly up to 3,800 nautical miles, with Southwest Airlines as the launch customer. Certification removed a major regulatory obstacle and improved the prospect that Boeing could deliver aircraft, collect cash, and broaden the 737 MAX family.
The market response was understandable because delivery timing has a direct effect on Boeing’s working capital and customer relationships. But certification was not a complete repair of the company’s financial or operational challenges. Production quality, supplier performance, delivery cadence, regulatory oversight, and balance-sheet improvement remained essential.
The stock nevertheless demonstrated an important feature of the broader market: individual corporate catalysts were still capable of generating substantial moves. That is a healthier environment than one in which every share rises or falls solely with a macro factor. It means investors are distinguishing between business outcomes, even while oil and yields set the overall risk tone.
The Session’s Losers Were Equally Informative
Energy shares declined with crude even as the broader market rose. That divergence is useful. A functioning market should reward or penalize businesses according to the factors that affect their economics rather than move every security in the same direction. The August 3 session combined a powerful macro rally with meaningful sector differentiation, suggesting that both market-wide and company-level analysis still mattered.
What July’s Selloff Changed
August began after a turbulent July in which momentum stocks, especially those tied to AI and high-duration growth, experienced a sharp unwind. The selloff reduced leverage, lowered prices, and challenged the assumption that every AI-linked company deserved the same premium. By Monday, the S&P 500 had posted three consecutive gains and moved back above several closely watched moving averages.
Technical levels do not alter a company’s intrinsic value, but they can affect positioning. Trend-following funds, volatility-control strategies, options dealers, and discretionary traders often respond to moving averages and realized volatility. When an index recovers key levels after a forced unwind, systematic selling can slow and short positions can be covered. That can amplify a fundamentally justified rebound.
The valuation reset also changed the risk-reward calculation. A company can report the same earnings at two very different share prices. When price falls and earnings estimates rise, the forward valuation becomes less demanding. That does not guarantee future returns, but it reduces the amount of perfection already embedded in the stock.
More importantly, the selloff encouraged differentiation between “quality” AI exposure and speculative exposure. In this context, quality generally means stable earnings, positive cash flow, manageable debt, defensible margins, and evidence of real customer demand. The term should not be used as a substitute for analysis; even a profitable company can be overpriced. But the shift toward balance-sheet strength made sense in a market where long yields remained high.
Why a Momentum Washout Can Be Constructive
Momentum strategies buy assets that have been rising and sell assets that have been falling. They can perform well for long periods, but crowded positioning creates vulnerability. When a reversal begins, funds may reduce exposure simultaneously, options hedging can reinforce the move, and leveraged investors can become forced sellers.
A washout can clear some of that pressure. It transfers shares from investors who must sell because of risk limits to investors willing to hold through volatility. It also lowers the hurdle for positive surprises. The August rebound benefited from that reset: earnings did not need to create a brand-new narrative; they needed to show that the old narrative retained economic substance.
The danger is that a technical rebound can be mistaken for a complete correction of fundamentals. If oil rises again, yields resume their climb, or AI spending fails to generate returns, the same crowded factors can unwind again. The healthier interpretation is that July removed some excess, not that it removed every risk.
Three Scenarios for the Rest of August
The path from here depends on a small number of variables with unusually large cross-market effects. Scenario analysis is more useful than a single-point forecast because the probabilities can change with each diplomatic statement, inflation release, earnings report, and Treasury auction.
Scenario One: De-escalation, Lower Oil and a Controlled Soft Landing
In the most constructive scenario, U.S.–Iran contacts produce verifiable steps toward de-escalation. Commercial traffic through the Strait of Hormuz improves, insurance costs begin to fall, and the oil risk premium declines. Brent crude settles below the levels that had driven the inflation scare, while gasoline prices ease for consumers.
At the same time, labor data show moderation without a collapse in hiring. Wage growth cools, productivity improves, and July CPI confirms that inflation pressure is broadening lower beyond energy. The Fed can then remain patient in September or communicate a limited path of tightening without destabilizing long-term yields.
Corporate earnings remain strong, AI cloud revenue continues to grow, and the market broadens toward industrials, financials, healthcare, and smaller companies. Under this scenario, the August 3 rally would look like the start of a more durable advance rather than a one-day relief event.
The key confirmation would be physical rather than rhetorical: more ships moving through Hormuz, lower freight and insurance premiums, stable Treasury auctions, and improving market breadth. Press conferences alone would not be enough.
Scenario Two: A Volatile Muddle-Through
In the middle scenario, negotiations remain ambiguous. Oil fluctuates in a wide range, perhaps consistent with the $80 to $90 Brent range cited by Goldman Sachs while markets wait for clarity. Hormuz traffic remains impaired but not completely halted. Neither side achieves a decisive diplomatic breakthrough, yet neither escalates enough to create a fresh supply shock.
Inflation improves slowly, but growth and employment remain firm enough to keep the September Fed meeting “live.” Long-term Treasury yields stay elevated and volatile. Stocks can still rise when earnings beat expectations, but valuation expansion is limited by the bond market.
This environment would favor selectivity. Companies with strong cash flow, pricing power, and low refinancing needs could outperform. Highly leveraged businesses and long-duration speculative shares would remain vulnerable. Sector leadership would rotate rapidly as oil, yields, and data changed.
This may be the most realistic baseline because it does not require every uncertainty to resolve at once. Markets can function and companies can grow even when geopolitics and policy remain unsettled. The cost is higher volatility and a lower tolerance for disappointment.
Scenario Three: Renewed Escalation and a Return of the Inflation Shock
In the adverse scenario, diplomacy fails and military or maritime incidents intensify. Hormuz traffic falls further, infrastructure is damaged, or insurers withdraw additional coverage. Oil rises sharply and remains elevated long enough to affect gasoline, diesel, jet fuel, chemicals, and freight.
The inflation effect reaches consumers and corporate margins. Headline CPI reaccelerates, inflation expectations rise, and the Fed signals that additional tightening is necessary. Treasury yields climb not only because of expected policy rates but because investors demand more inflation and fiscal risk premium.
Technology valuations would face pressure from the higher discount rate. Airlines, retailers, restaurants, transportation companies, and lower-income consumer businesses would encounter higher costs or weaker demand. Energy producers could outperform at first, but a sufficiently severe shock would eventually threaten global growth and credit quality.
AI investment would not necessarily stop, but financing would become more expensive. Projects dependent on external capital could be delayed, and the market would scrutinize free cash flow more aggressively. Under this scenario, the August 3 rally would be remembered as a temporary repricing of diplomatic hope rather than the beginning of a stable trend.
The Risks Investors Should Not Ignore
Diplomatic Headlines Can Move Faster Than Verifiable Policy
The first risk is straightforward: statements about talks can be inconsistent, strategically ambiguous, or intended for domestic audiences. President Trump said discussions were occurring, while Iranian officials denied direct negotiations with the United States and described only limited contacts involving Oman and Hormuz. Markets initially priced the optimistic version, then reconsidered as the denials emerged.
Investors should distinguish among three levels of evidence: a public expression of willingness, an agreed negotiating framework, and implemented measures that change physical conditions. Only the third level reliably affects supply risk.
Oil Can Fall on Hope and Rise on Logistics
Crude prices reflect expected future supply and demand, not only current production. A diplomatic headline can remove several dollars of risk premium immediately. But tanker traffic, port operations, storage, insurance, sanctions, and military risk determine whether barrels can actually reach buyers. If logistics remain impaired, the price decline may prove temporary.
The Fed’s Credibility Is a Market Variable
Fed independence and transparency affect more than the next policy meeting. They influence inflation expectations and the term premium embedded in long bonds. A central bank can choose not to provide precise forward guidance, but it still needs a coherent framework that allows markets to understand how incoming data affect decisions. Persistent confusion can raise borrowing costs even when the policy rate is unchanged.
Fiscal Supply Can Keep Long Yields High
Large Treasury borrowing needs do not make a crisis inevitable, but they increase sensitivity to demand. If foreign buyers, banks, or pension funds require better prices, long yields can remain high despite slower inflation. Equity investors focusing only on Fed policy may therefore miss an independent source of discount-rate pressure.
AI Capital Spending Can Outrun Cash Returns
The leading platforms have strong balance sheets, but the broader ecosystem includes developers, data-center operators, utilities, equipment suppliers, private lenders, and special-purpose financing structures. Revenue forecasts can be wrong, hardware can depreciate quickly, and electricity constraints can delay projects. The larger the buildout becomes, the more important underwriting discipline will be.
Index Concentration Can Hide Portfolio Risk
An investor holding an S&P 500 fund owns hundreds of companies, but the performance can still depend heavily on a small group of megacaps. Those companies share exposure to AI spending, cloud demand, regulation, electricity, and long-term yields. Diversification by number of holdings is not the same as diversification by economic driver.
Strong Earnings Growth May Be Hard to Repeat
A 29.3% year-over-year earnings-growth rate is impressive, but comparisons can become more difficult as prior-year profits improve. Investors should focus on the future path of revenue, margins, and guidance rather than extrapolating an unusually strong quarter indefinitely. Markets often price the rate of change, not simply the level.
What Businesses and Households Can Learn From the Market Move
The August rally was not only relevant to traders. Oil, interest rates, and AI spending affect operating decisions throughout the economy.
For businesses, lower oil can reduce transportation and materials costs, but a single-day move is not a budgeting assumption. Companies exposed to fuel should consider whether hedging, supplier contracts, or pricing plans remain appropriate across a range of energy outcomes. Businesses refinancing debt should pay attention to long-term Treasury yields rather than assuming that a stable Fed policy rate means stable borrowing costs.
For households, lower crude may eventually reduce gasoline and travel costs, but the pass-through is neither immediate nor complete. Mortgage rates depend more directly on longer-term bond yields and mortgage-backed securities than on the federal funds rate alone. A Fed pause can coexist with expensive mortgages if the term premium remains high.
For long-term investors, the session reinforced the value of separating a company’s operations from the market factor affecting its valuation. A profitable cloud platform can report excellent growth and still fall if yields surge. An energy producer can execute well and still decline when crude drops. Understanding both levels reduces the temptation to attribute every price move to management quality.
None of this means investors should trade around each headline. It means portfolio risk should be evaluated against plausible scenarios: higher oil, higher yields, slower AI spending, or a broader economic rebound. The objective is not to predict every event but to avoid relying on one outcome.
Valuation Math: Why Earnings and Yields Must Be Read Together
A common mistake is to discuss stock valuations without reference to the bond market. A price-to-earnings ratio expresses how much investors are willing to pay for a dollar of corporate profit. Its inverse, the earnings yield, provides a rough comparison with the yield available on bonds. The comparison is imperfect because stocks can grow and bonds have contractual payments, but it helps explain why long-term rates exert such influence.
When Treasury yields rise, investors can earn more from a security backed by the U.S. government. Stocks must then offer a sufficiently attractive combination of earnings yield and future growth to compensate for greater uncertainty. A company with rapidly expanding profit can still justify a premium. A company valued mainly on distant possibilities becomes harder to defend.
This is why the August 3 combination was unusually supportive. Earnings estimates were rising while Treasury yields were falling. Both sides of the valuation equation moved in favor of stocks. If the same companies had reported strong earnings while the 30-year yield surged, the market reaction could have been far less positive.
The relationship also explains the emerging preference for quality. A profitable platform with recurring revenue, a strong balance sheet, and visible backlog can withstand a higher discount rate better than a company that needs years of external funding before reaching positive cash flow. In a low-rate environment, investors may tolerate distant payoffs. In a high-rate environment, they demand evidence sooner.
Multiple Expansion Is Not the Same as Earnings Growth
A stock can rise because the business earns more or because investors pay a higher multiple for the same earnings. The first source of return is generally more durable, although even earnings can be cyclical. The second is more dependent on sentiment, liquidity, and interest rates.
The strongest version of the August bull case would involve continued profit growth with only moderate multiple expansion. That would allow prices to rise without requiring increasingly optimistic assumptions. A weaker version would rely on investors restoring the highest July valuations before cash flow catches up.
The distinction is especially important for index investors. A handful of megacaps can lift the S&P 500 through multiple expansion even if earnings growth is less broad. Equal-weighted performance and sector-level profit growth help reveal whether fundamentals are spreading through the economy.
Inflation Volatility Can Raise the Discount Rate Even When Average Inflation Falls
Markets do not price only the expected average inflation rate. They also price uncertainty around that expectation. If oil can move 5% to 7% in a day because of geopolitical headlines, investors face a wider range of possible inflation and Fed outcomes. That uncertainty can increase the term premium even when the central forecast is for disinflation.
For stocks, lower inflation volatility can be almost as valuable as lower inflation itself. Stable prices make corporate planning easier, reduce the risk of abrupt policy changes, and allow investors to apply more confidence to future cash flows. The durable bullish signal would therefore be not merely lower oil, but a less volatile energy and bond environment.
Private Credit Shows How Higher Rates Reach the Real Economy
The Bloomberg program also examined private credit, an area that often receives less attention than public stocks and Treasuries but is central to understanding how monetary policy reaches companies. Private credit funds lend directly to businesses outside the broadly syndicated loan and public bond markets. The loans are frequently floating-rate, which means the borrower’s interest expense changes as benchmark rates move.
That structure can be attractive to lenders when rates rise because coupon income increases. It can be difficult for borrowers because debt-service costs increase even when revenue does not. The result is a delayed transmission mechanism: a rate increase today may not cause an immediate default, but it can gradually reduce hiring, capital investment, acquisitions, and distributions to owners.
Fitch Ratings said the U.S. private-credit default rate rose to a record 6.0% in the 12 months through June, up from 5.7% in the previous quarter, according to Reuters. The agency recorded 32 default events in the second quarter involving 20 new borrowers. In the Bloomberg discussion, Randy Schwimmer of Churchill Asset Management emphasized that default definitions differ. Some methodologies count maturity extensions, payment-in-kind interest, and restructurings as default events or distress indicators even when a borrower has not missed a cash payment. Others use a narrower payment-default definition.
This is not merely a debate about terminology. A maturity extension can prevent a destructive liquidation and ultimately improve recovery. It can also reveal that the original capital structure is no longer sustainable. Payment-in-kind interest preserves short-term cash but increases the principal owed. A lender may agree to amend terms because the underlying business remains viable, yet the amendment still indicates stress.
Investors comparing private-credit performance should therefore ask what the reported rate includes, how loans are valued, and whether interest income is being paid in cash. A portfolio with few formal payment defaults may still contain borrowers that require repeated amendments. Conversely, a methodology that counts every consensual restructuring as a default may overstate permanent losses.
Why the August Rate Outlook Matters to Private Borrowers
If the Fed delivers one or two additional rate increases and benchmark yields stay elevated, floating-rate private loans can produce high nominal income. Schwimmer suggested that senior credit yielding around 9% on an unlevered basis could approach 9.5% to 10% if rates rose. That income is appealing, but it is not free. The borrower must generate enough operating cash to pay it.
The healthiest private-credit portfolios are likely to be those underwritten with conservative leverage, durable cash flow, and realistic exit assumptions. Businesses that were financed on the expectation of rapid rate cuts may face greater pressure. The same is true for assets whose valuations depended on cheap refinancing or aggressive multiple expansion.
This matters to the stock market because stress can travel through the credit channel. A private borrower may cut orders from public suppliers, delay software purchases, reduce employment, or sell assets. Private-equity sponsors may slow acquisitions when financing costs rise. Banks and insurers can have exposure through fund financing, asset-backed structures, or partnerships. The public and private markets are not sealed off from one another.
Service Businesses May Be Resilient, but Not Immune
Private lenders often favor recurring service businesses such as HVAC maintenance, pest control, veterinary clinics, and other locally delivered services. These companies can be less exposed to tariffs and international supply chains than goods producers. Demand may also be recurring or difficult to postpone.
However, resilience is not the same as invulnerability. A highly leveraged service company can still struggle if labor costs rise, customer churn increases, acquisitions underperform, or interest expense absorbs too much cash. AI may reduce administrative costs in some businesses while creating new competitive pressure in others. Underwriting still depends on the price paid, the debt burden, and the quality of management.
The private-credit discussion reinforces the article’s broader conclusion: the level of rates matters, but the path and volatility matter too. A stable 9% financing cost can sometimes be planned for. A rapid move from 7% to 10%, accompanied by uncertain refinancing markets, is much harder. Monday’s decline in Treasury yields offered relief, yet the Fed, inflation, and fiscal supply kept the medium-term cost of capital unsettled.
Lower Oil Changes Corporate Margins Unevenly
The immediate market response treated cheaper crude as broadly positive, but the effect on corporate earnings varies by business model. Fuel-intensive companies can benefit quickly when spot prices decline, although hedging programs and contractual lags may delay the improvement. Airlines, parcel carriers, trucking companies, cruise operators, chemical producers, and manufacturers all have different exposure to crude, refined products, and natural gas.
Retailers and restaurants can benefit indirectly. When households spend less at the pump, they have more room for discretionary purchases. Freight and packaging costs may also ease. Yet the benefit depends on whether companies retain the savings as margin or pass them to customers through lower prices and promotions.
Energy producers face the opposite effect. Lower realized prices can reduce revenue, cash flow, drilling activity, and shareholder distributions. The sensitivity differs according to production costs, hedges, balance-sheet leverage, and the mix of oil and gas. Integrated companies may have refining or trading operations that partly offset upstream weakness.
Financial companies experience a more complex effect. Lower oil can reduce inflation and credit risk for consumers, but a sudden collapse caused by weak demand could signal recession. Banks with exposure to energy borrowers may prefer a stable, profitable oil price rather than an extreme move in either direction.
The source of the price change therefore matters as much as the direction. Oil falling because supply routes are normalizing is usually constructive for the economy. Oil falling because global demand is collapsing carries a very different message. On August 3, the dominant interpretation was the first: geopolitical risk had eased. The subsequent uncertainty showed why investors needed confirmation.
Consumers Feel Crude Through More Than Gasoline
Crude oil affects household budgets through gasoline, airfare, delivery charges, heating fuels, plastics, and the cost of goods moved across long distances. The pass-through takes time and can be obscured by refining margins, taxes, local distribution, and seasonal demand. A one-day futures move will not immediately appear at every filling station.
Still, sustained lower energy prices can improve real disposable income. The effect is often most meaningful for lower- and middle-income households because fuel and utilities consume a larger share of their budgets. That can support restaurants, retailers, travel, and other discretionary sectors.
The inflation benefit can also influence borrowing costs. If lower energy helps reduce headline inflation without weakening employment, mortgage and auto-loan rates may eventually improve through the bond market. But the relationship is indirect. Long-term yields can remain high because of fiscal supply or term premium even while gasoline falls.
For corporate planners and households alike, the prudent assumption is a range rather than a single forecast. The oil market was pricing a conflict, a constrained chokepoint, and uncertain diplomacy. Any of those inputs could change abruptly.
How to Distinguish a Relief Rally From a Lasting Regime Change
Relief rallies and durable bull-market advances can look identical during their first session. Both feature rising prices, stronger breadth, falling volatility, and rapid recovery in the shares that had been under the greatest pressure. The difference becomes visible only through follow-through.
Price Confirmation
A lasting change should survive more than the first burst of short covering. The index does not need to rise every day, but pullbacks should attract buyers and prior resistance should begin to act as support. If the entire advance disappears after the next oil headline or Treasury auction, the move was primarily positional.
Fundamental Confirmation
Earnings estimates should continue to rise or at least remain stable. A market can temporarily rally while analysts cut future profit forecasts, but that combination usually requires lower rates or expanding valuation multiples to do most of the work. The more durable configuration is rising prices supported by improving revenue, margins, and guidance across several sectors.
Cross-Market Confirmation
Stocks, bonds, credit, currencies, and commodities should tell a reasonably consistent story. Lower oil combined with stable inflation expectations and orderly Treasury trading would support the de-escalation thesis. Lower oil accompanied by widening credit spreads and collapsing industrial commodities might instead point to weak demand. Cross-market agreement helps identify the reason behind the price move.
Liquidity Confirmation
Healthy rallies tend to occur with functioning funding markets and manageable volatility. If repo markets, Treasury auctions, corporate issuance, or foreign-exchange markets show stress, equity strength may be fragile. The coordinated yen intervention demonstrated that liquidity and currency stability can influence U.S. assets even when the immediate problem begins overseas.
Breadth Confirmation
Participation should persist beyond the largest companies. Small caps do not have to lead every day, and defensive sectors will sometimes lag. But a sustainable expansion is easier when banks, industrials, consumer companies, healthcare, and midcaps can produce earnings growth of their own. Breadth reduces the burden placed on the AI complex.
Policy Confirmation
Markets need evidence that fiscal, monetary, and geopolitical policy are not working at cross-purposes. Lower oil can ease inflation, but heavy Treasury borrowing can still raise long yields. Strong growth can support profits, but unclear Fed communication can increase volatility. A durable regime change requires enough policy coherence that businesses and investors can plan around a plausible range of outcomes.
These tests are intentionally demanding. A rally does not need to pass all of them immediately to continue. They provide a framework for deciding whether a higher market reflects an improved economic path or merely a temporary reduction in fear.
What to Watch Next
The most useful way to evaluate whether the August rebound is becoming durable is to follow a small dashboard of observable indicators rather than the daily volume of commentary.
1. Strait of Hormuz Traffic
Ship counts, tanker tracking, insurance availability, and reported transit volumes matter more than broad promises of de-escalation. A sustained increase in passage would show that the supply-chain risk premium can genuinely fall. Continued minimal traffic would keep the market vulnerable to another oil spike.
2. Brent and WTI After the Initial Relief Move
The direction after the first reaction is informative. On August 4, Brent and WTI edged higher as the status of talks remained uncertain. If crude repeatedly rebounds from diplomatic selloffs, it suggests the physical market is unwilling to price a full normalization. If prices continue lower alongside improving traffic, the disinflationary effect becomes more credible.
3. The 10-Year and 30-Year Treasury Yields
Equity investors should watch whether long yields remain stable when data are strong. If yields rise sharply after every positive economic release, the market may struggle to expand valuations. If inflation data improve and long bonds respond constructively, earnings can play a larger role in stock prices.
4. Treasury Auctions and Foreign Demand
Auction tails, bid-to-cover ratios, indirect-bidder participation, and post-auction trading can reveal whether buyers are comfortable absorbing supply. No single auction is definitive, but a pattern of weak demand would reinforce term-premium concerns.
5. Labor-Market Cooling Without Contraction
Job openings, payroll growth, unemployment, hours worked, and wage growth should be read together. Moderate hiring and slower wage inflation would support a soft-landing outcome. A sudden employment collapse would threaten earnings, while renewed acceleration could increase the probability of Fed tightening.
6. Inflation Beyond Energy
Lower gasoline is helpful, but the Fed will also focus on housing, services, wages, and other persistent components. A durable disinflation trend requires more than a temporary energy reversal.
7. AI Free Cash Flow and Backlog
Revenue growth confirms demand, but backlog quality, contract duration, utilization, and free cash flow show whether the buildout is creating economic value. Investors should pay attention to changes in capital-expenditure guidance and the proportion financed externally.
8. Market Breadth
Continued strength in equal-weighted indices, small caps, industrials, financials, and other non-megacap groups would make the rally more resilient. A return to leadership by only a few large technology names would leave the index vulnerable to company-specific disappointment.
Frequently Asked Questions
Why did the stock market rally on August 3, 2026?
Stocks rallied because several supportive forces arrived together. Oil prices fell sharply on hopes of U.S.–Iran diplomacy, reducing immediate inflation fears. Treasury yields declined, making growth-stock valuations easier to support. Corporate earnings were strong, particularly in technology and cloud computing, and the July momentum selloff had reduced prices and positioning. The combination triggered broad buying and short covering.
How much did the major U.S. indices gain?
The Dow Jones Industrial Average rose 693.38 points, or 1.32%, to 53,178.41. The S&P 500 gained 110.78 points, or 1.48%, to 7,600.50. The Nasdaq Composite advanced 540.04 points, or 2.13%, to 25,913.90. The Russell 2000 rose about 1.7% to 2,981.91.
Why does a drop in oil prices help technology stocks?
Lower oil can reduce inflation pressure and lower the expected path of interest rates. Technology stocks, especially high-growth companies, are sensitive to the discount rate applied to future cash flows. When bond yields fall, those future profits are worth more in present-value terms. Lower energy costs can also support consumer spending and corporate margins, although the benefit varies by industry.
Was the decline in oil based on a confirmed peace agreement?
No. The initial move was based on hopes for talks and de-escalation, not a completed agreement. Iranian officials subsequently denied that direct negotiations with the United States were underway, while U.S. officials maintained that discussions were occurring. Physical traffic through the Strait of Hormuz remained severely disrupted. That is why oil partly rebounded on August 4.
Why is the Strait of Hormuz so important?
The strait is the main maritime outlet for major Persian Gulf oil and liquefied-natural-gas exporters. Before the conflict, roughly 20 million barrels per day of oil and petroleum products moved through the route, according to the International Energy Agency. When traffic is disrupted, buyers must compete for alternative supply, shipping costs rise, and the global energy market attaches a larger risk premium to crude.
Did the Federal Reserve cut interest rates before the rally?
No. The Fed held its target range at 3.5% to 3.75% on July 29. Three officials preferred a quarter-point increase. The rally occurred because market yields fell on Monday and because investors interpreted lower oil as reducing future inflation risk. The Fed’s next move remained uncertain.
Why were bond investors concerned about Fed communication?
Chair Kevin Warsh provided limited forward guidance after the July meeting. Investors were unsure how the Fed would balance inflation, oil, growth, and labor-market data. Less predictable policy can increase interest-rate volatility and the premium investors demand to hold long-term bonds. The concern was therefore not only the next rate decision but the reliability of the policy framework.
Were earnings strong enough to justify the rally?
Earnings provided substantial support. Among the S&P 500 companies that had reported, profits were estimated to be up 29.3% from a year earlier, and about 85.2% had beaten expectations. Amazon, Microsoft, Alphabet, Palantir, and other technology companies reported strong revenue or backlog growth. However, valuations, capital spending, and free cash flow still determine whether the gains can continue.
What does Amazon’s $3 trillion valuation say about the AI trade?
It shows that investors place enormous value on AWS, cloud infrastructure, and Amazon’s position in AI. The second quarter included 37% AWS revenue growth and strong cloud operating income. At the same time, Amazon’s trailing free cash flow was negative because capital spending rose, and much of reported net income came from an Anthropic-related valuation gain. The milestone reflects both genuine operating strength and high expectations.
Is AI spending already generating real revenue?
Yes, at leading providers. Azure annual revenue passed $100 billion, AWS grew 37%, Google Cloud grew 82%, and Palantir reported rapid government and commercial growth. These results show that customers are paying for AI-related infrastructure and software. The unresolved issue is whether the long-term return on the industry’s enormous capital expenditure will remain attractive after depreciation, financing costs, and competition.
What would confirm that the rally is durable?
The strongest confirmation would be a combination of improving Hormuz traffic, sustainably lower oil, stable long-term Treasury yields, continued earnings growth, cooling inflation outside energy, and broader participation beyond megacap technology. Any one of those can support a rally temporarily. A durable advance is more likely when several improve together.
What could reverse the rally?
A renewed Middle East escalation, another oil-price spike, firm inflation, weak Treasury auctions, aggressive Fed tightening, or evidence that AI capital spending is failing to generate cash returns could reverse the move. High index concentration means disappointing results from a small number of megacap companies could also have an outsized effect.
Final Assessment: A Rational Rally Built on Conditional Assumptions
The August 3 stock-market rally was not simply a burst of speculative enthusiasm. It had a coherent foundation. Oil fell sharply, Treasury yields eased, corporate earnings were strong, AI revenue was becoming more visible, and July’s momentum unwind had reduced some excess positioning. Market breadth improved, small caps participated, and company-specific results continued to matter.
But each supportive factor came with a condition. Oil needed diplomacy to translate into safer shipping. Lower yields needed inflation and Treasury demand to cooperate. AI revenue needed to grow fast enough to justify exceptional capital expenditure. Earnings needed to remain strong as year-over-year comparisons became more difficult. Broader participation needed to persist beyond a single session.
The most important lesson is that the rally connected several markets that are often discussed separately. The Strait of Hormuz influenced oil. Oil influenced inflation expectations. Inflation expectations influenced the Fed and Treasury yields. Yields influenced technology valuations. Technology earnings influenced the entire index. Currency intervention in the yen added another link through foreign demand for U.S. debt.
That chain can work in both directions. De-escalation and disinflation can reinforce each other, creating room for earnings to drive stocks higher. Renewed disruption can push oil, inflation, and yields upward together, tightening conditions even if corporate demand remains healthy.
For now, the August rebound deserves to be taken seriously—but not taken for granted. It was a rational repricing of a better possible outcome. Whether it becomes a durable trend will be determined by verifiable shipping flows, inflation data, bond-market stability, and cash returns from the largest investment cycle in modern technology.
Sources
- Reuters — Wall Street closes higher as oil falls and technology shares rally, August 3, 2026
- Reuters — Oil drops and stocks gain amid Iran peace hopes, August 3, 2026
- Reuters — Oil edges higher as U.S.–Iran talks remain uncertain, August 4, 2026
- Reuters — Status of U.S.–Iran talks uncertain as vessel is reported struck near Hormuz, August 4, 2026
- Reuters — Iran says there are no current direct talks with the United States, August 3, 2026
- U.S. Energy Information Administration — World oil transit chokepoints
- International Energy Agency — Strait of Hormuz and oil security
- International Energy Agency — How global oil supplies adjusted after the Strait of Hormuz shock
- Federal Reserve — FOMC statement, July 29, 2026
- Reuters — Uncertainty follows the Fed decision as Chair Warsh limits guidance, July 29, 2026
- U.S. Treasury — Marketable borrowing estimates for the third and fourth quarters of 2026
- Reuters — How coordinated U.S.–Japan intervention affected the yen market, August 3, 2026
- Institute for Supply Management — July 2026 Manufacturing PMI
- Institute for Supply Management — PMI report release-date calendar
- Bureau of Economic Analysis — Advance estimate of second-quarter 2026 GDP
- Bureau of Economic Analysis — Personal income and outlays, June 2026
- Bureau of Labor Statistics — Consumer Price Index, June 2026
- Bureau of Labor Statistics — Employment Situation release schedule
- Amazon Investor Relations — Second-quarter 2026 results
- Microsoft Investor Relations — Fiscal fourth-quarter 2026 results
- Alphabet Investor Relations — Second-quarter 2026 earnings call
- Meta Investor Relations — Second-quarter 2026 results
- Reuters — Private-credit earnings hold up as defaults and redemptions remain elevated, July 31, 2026
- FactSet — Hyperscalers tap external financing as AI capital expenditure outruns cash flow
- Palantir Investor Relations — Second-quarter 2026 business update
- Onsemi Investor Relations — Second-quarter 2026 results
- Boeing — FAA certification of the 737-7, August 3, 2026
Affiliate disclosure: Businessfinance.news may earn compensation from qualifying actions completed through selected links on this website, at no additional cost to the reader. Affiliate relationships do not influence our editorial reporting, analysis, or conclusions.