Last updated: August 3, 2026, 4:42 a.m. ET
Big Tech’s latest earnings season delivered a verdict that was more discriminating than the familiar claim that investors have suddenly turned against artificial-intelligence spending. Microsoft and Amazon announced enormous infrastructure commitments and were rewarded. Alphabet produced exceptional cloud growth but initially lost ground after lifting its capital-expenditure plan. Meta’s advertising engine remained powerful, yet its free cash flow nearly disappeared. Apple reported record-like product demand and unusually strong profit growth, only to be hit by a weaker outlook and an AI-driven component squeeze. Tesla returned to revenue growth, but lower automotive economics and negative free cash flow made its long-dated AI ambitions harder to value.
The common thread was not whether a company spent heavily. It was whether investors could see a credible bridge from today’s spending to tomorrow’s durable revenue, margins and cash flow. Microsoft offered the clearest bridge: Azure growth accelerated to 43%, annual Azure revenue crossed $100 billion, Microsoft Cloud revenue reached $59.3 billion for the quarter, and Microsoft 365 Copilot exceeded 30 million paid seats. Amazon then reinforced the same argument. AWS revenue increased 37% to $42.2 billion, its fastest growth in 18 quarters, while management said AWS, its broader AI business and its custom-chip business had each exceeded a $25 billion annualized run rate.
Those results helped define what technology analyst Lisa Martin described in a Schwab Network discussion as the industry’s emerging “return on investment” phase. The useful version of that thesis is not that every dollar of AI capital expenditure must already produce an identifiable dollar of profit. Data centers are long-lived assets, customer migrations take time, and much of the infrastructure being installed in 2026 will support contracts and workloads extending into 2027 and beyond. The standard has nevertheless changed. Demand alone is no longer sufficient. Investors increasingly want evidence of utilization, contracted backlog, paid adoption, improving unit economics and a path through depreciation, energy and financing costs to free cash flow.
That shift matters because the four largest U.S. hyperscale spenders—Microsoft, Alphabet, Amazon and Meta—are now guiding to or discussing combined 2026 capital programs of roughly $700 billion or more, depending on accounting definitions and the treatment of leases. The figure is not perfectly comparable across companies. Microsoft changed the expected useful life of certain data-center buildings and altered how some future leases will be classified. Amazon’s forecast includes technology infrastructure beyond generative AI. Meta includes finance-lease principal payments in the capex measure it emphasizes. Alphabet’s range includes servers, data centers and other technical infrastructure. Even with those caveats, the scale is large enough to affect chip supply, memory prices, electrical grids, corporate margins and the earnings profile of the wider stock market.
Key Takeaways
- The market did not reject AI spending: Microsoft and Amazon both raised or sustained extraordinary investment plans and still rallied because Azure and AWS showed accelerating, measurable growth.
- Cloud monetization became the clearest proof point: Microsoft, Amazon and Alphabet all reported very strong cloud performance, but the timing, magnitude of new spending and cash-flow implications produced different reactions.
- Meta faced a different burden of proof: Its AI infrastructure primarily supports advertising, recommendations and future products rather than an established external cloud business. Quarterly free cash flow fell 91% to $784 million.
- Apple exposed the second-order cost of the AI boom: It is not matching hyperscaler capex, but shortages and rising prices for advanced chips, DRAM and NAND are pressuring its supply chain and outlook.
- Tesla remains a timing trade as much as an earnings story: Revenue improved, but operating margin fell to 1.4% and free cash flow was negative $1.09 billion as spending on AI compute, robotaxis and manufacturing accelerated.
- The next test is cash conversion: Revenue growth can justify capacity expansion for a time, but depreciation, power, memory, networking and financing costs eventually have to be absorbed without permanently weakening returns on capital.
Fact Box
The AI ROI Scorecard Investors Used
- Demand: Is growth accelerating, and is capacity still constrained?
- Monetization: Are customers paying for cloud capacity, software seats, advertising improvements or autonomous services?
- Backlog quality: Are commitments diversified, durable and likely to convert into revenue?
- Margins: Can revenue absorb depreciation, chips, power, networking and labor?
- Cash conversion: Does operating cash flow remain strong after capital expenditure?
- Execution: Is management delivering on previous promises rather than merely expanding the vision?
Primary evidence: Company filings and earnings materials from Microsoft, Alphabet, Amazon and Meta.
The Earnings Season That Changed the AI Spending Debate
For much of the generative-AI investment cycle, the market’s first question was whether demand was real. That question has not disappeared, but the latest numbers made the answer increasingly difficult to dispute. Azure grew 43%. Google Cloud grew 82%. AWS grew 37%. Alphabet said Google Cloud backlog reached $514 billion. Amazon reported AWS backlog of roughly $496 billion. Microsoft ended its fiscal year with $678 billion of remaining performance obligations across the company, although the figure included a substantial concentration related to OpenAI and therefore requires careful interpretation.
These are not small experimental businesses. They are large, global platforms growing at rates normally associated with much younger companies. Synergy Research Group estimated that enterprise spending on cloud infrastructure services reached about $128.6 billion in the first quarter of 2026, up by more than $35 billion from a year earlier. The annualized market had moved beyond half a trillion dollars. Amazon remained the largest provider, while Microsoft and Google were growing faster. That industry backdrop helps explain why investors were willing to tolerate investment levels that would have looked implausible only a few years ago.
Yet the earnings reactions showed that cloud growth alone was not the entire test. Alphabet’s 82% Google Cloud expansion was the fastest among the major platforms, and the segment’s operating margin climbed to 35.6% from 20.7% a year earlier. Even so, Alphabet shares fell about 5% in premarket trading after the company raised its 2026 capex range to $195 billion to $205 billion from $180 billion to $190 billion and indicated that 2027 spending would rise significantly again. Investors were not denying the existence of demand. They were recalculating the amount of capital required to serve it and the period over which that capital would earn an adequate return.
Microsoft’s report arrived one week later and changed the benchmark. Its spending was not smaller. Quarterly capital expenditure reached $41 billion, and management expected the following quarter to exceed $50 billion. The difference was the density of evidence surrounding the investment. Azure growth accelerated. Copilot paid-seat adoption grew. annual Azure revenue crossed $100 billion. Commercial bookings and remaining performance obligations expanded sharply. Management also projected Azure growth of about 45% in constant currency for the next quarter. The spending increase was paired with an unusually visible revenue engine.
Amazon then validated the idea that Microsoft’s result was not unique. AWS grew faster than it had in more than four years, operating profit remained robust, backlog expanded and management described capacity as the principal constraint on growth. Amazon raised expected 2026 capital expenditure to about $220 billion from $200 billion. Its free cash flow turned negative, but the market’s immediate reaction was strongly positive because the cloud segment showed that the company was filling the new capacity and signing customers before the facilities were fully available.
Meta, Apple and Tesla demonstrated why the same analytical template cannot be applied mechanically to every company. Meta has an extraordinary advertising machine, but no mature public-cloud division through which it can directly rent out most of its new compute. Apple buys advanced components and develops its own silicon, yet its capital model remains far lighter than those of the hyperscalers. Tesla’s AI ambitions are tied to autonomy, robotaxis, robotics and a company-operated fleet, which creates a much longer and more uncertain path between capital spending and recognized revenue. The market was comparing several different business models under one convenient “AI spending” label.
Big Tech Earnings at a Glance
| Company | Reported period | Revenue | AI or cloud proof point | Capital/cash-flow pressure | Initial market message |
|---|---|---|---|---|---|
| Microsoft | Fiscal Q4 ended June 30, 2026 | $90.0 billion, up 18% | Azure +43%; Microsoft 365 Copilot above 30 million paid seats | $41 billion quarterly capex; next quarter expected above $50 billion | Spending viewed as supported by accelerating growth |
| Alphabet | Q2 ended June 30, 2026 | Approximately $119.7 billion, up 24% | Google Cloud +82%; cloud margin 35.6%; backlog $514 billion | 2026 capex raised to $195–$205 billion; free cash flow under pressure | Excellent demand, but a larger and longer investment bill |
| Amazon | Q2 ended June 30, 2026 | $200.6 billion, up 20% | AWS +37%, fastest in 18 quarters; AWS revenue $42.2 billion | 2026 capex raised to about $220 billion; trailing free cash flow negative | Cloud acceleration outweighed cash-flow concerns |
| Meta | Q2 ended June 30, 2026 | $60.8 billion, up 28% | Ad impressions +14%; average ad price +12% | Free cash flow $784 million, down 91%; 2026 capex $130–$145 billion | Strong ads, but insufficient near-term cash proof for the buildout |
| Apple | Fiscal Q3 ended June 27, 2026 | $109.4 billion, up 16% | R&D +32%; new foundation models developed with Google and Gemini | Advanced-chip, DRAM and NAND shortages; softer September-quarter outlook | AI boom seen as a supply-chain cost before it becomes a revenue engine |
| Tesla | Q2 ended June 30, 2026 | $28.2 billion, up 26% | FSD subscriptions 1.48 million; Texas AI compute more than doubled in H1 | Operating margin 1.4%; capex $5.8 billion; free cash flow negative $1.09 billion | Investors questioned the timeline between AI vision and cash returns |
Sources: Company earnings releases, filings and investor materials. Revenue growth is year over year. Capital-expenditure measures and fiscal periods are not fully comparable across companies.
Why Similar Spending Produced Opposite Stock Reactions
A stock’s earnings reaction is not a score assigned to the quarter in isolation. It is the repricing of a stream of future cash flows relative to expectations embedded before the release. A company can beat revenue and earnings estimates and still fall if its guidance weakens, its capital requirements rise faster than expected or management reveals a new constraint. It can also report negative free cash flow and rally if the market concludes that the spending is temporary, productive and backed by signed demand.
That distinction explains much of the apparent inconsistency. Alphabet’s report arrived first among the three major public-cloud providers. It established that AI demand was stronger than many forecasts, but it also reset the expected price of serving that demand. The company lifted its annual capex range by $15 billion at the midpoint and warned of further growth in 2027. The report therefore contained two positive signals—faster cloud growth and higher cloud profitability—and one valuation-negative signal: the cash cost of maintaining that trajectory had increased again.
Microsoft’s release then offered investors a richer set of monetization indicators. Azure growth accelerated to 43%, above market expectations. Microsoft 365 Copilot had more than 30 million paid seats, and management said net seat additions had more than doubled sequentially. Azure annual revenue exceeded $100 billion. The company also generated $55.4 billion in quarterly operating cash flow and $19.6 billion in free cash flow after its extraordinary investment. The market could point to both present monetization and a plausible next-quarter continuation.
Amazon’s result added another important piece: AWS growth was not merely keeping pace with the expanding market; it reaccelerated to the fastest rate in 18 quarters. That made Amazon’s capital spending look less like an open-ended wager and more like a response to a capacity shortage. Management said much of its planned 2027 capacity was already committed. The logic was simple: when customers have contracted for compute that does not yet exist, building the data center has a more visible economic purpose than building first and searching for demand later.
Meta lacked the same external-cloud evidence. Its revenue rose 28%, which is exceptional for a company of its size, and the advertising metrics supported management’s argument that AI improves ranking, engagement and ad performance. But quarterly costs and expenses rose 55%, operating income declined 8%, and free cash flow fell to $784 million. The market was being asked to value gains that were partly embedded in a large advertising system while absorbing a capital program more commonly associated with public-cloud providers. The link between the spending and incremental revenue was harder to isolate.
Apple’s decline had still another cause. Its reported quarter was strong, but its next-quarter guidance disappointed. The company expected revenue growth of 9% to 11%, below the roughly 12% consensus cited by Reuters, and warned that supply constraints were limiting its ability to meet demand. Apple’s AI problem was therefore not simply that it lagged in consumer assistants. The broader AI infrastructure boom was competing for advanced semiconductor, memory and storage capacity that Apple needs for iPhones, Macs and other devices. The market reaction was a response to future product availability, pricing and services growth, not a rejection of the completed quarter.
Tesla’s reaction reflected the longest duration and widest range of possible outcomes. Its core automotive business generated more revenue but less operating profit per dollar of sales. At the same time, Tesla accelerated investment in AI compute, robotaxis, Cybercab production and robotics. Investors were being asked to look past a 1.4% operating margin and negative free cash flow toward businesses whose scale, timing, regulation and unit economics remain uncertain. That is a fundamentally different proposition from renting cloud capacity under multi-year contracts.
What Counts as AI Return on Investment?
“AI ROI” can become an empty slogan unless it is tied to measurable economics. For a cloud provider, the first layer is straightforward: revenue from compute, storage, databases, networking, model access and software services. Azure, AWS and Google Cloud can sell a customer the underlying infrastructure, the developer platform and the application layer. The same physical data center may support several forms of monetization, from training a frontier model to serving an enterprise application or hosting a conventional database workload.
The second layer is utilization. A server that is purchased but not deployed produces no revenue. A deployed server that runs below economically planned utilization may still grow sales while earning a poor return. Investors therefore need evidence that capacity is being filled, that customers are moving from reservations to consumption and that supply constraints represent genuine demand rather than construction delays. Backlog can help, but backlog quality matters. A five-year commitment from a diversified enterprise customer is economically different from a large commitment concentrated in one frontier-model company whose own financing depends on continuing access to capital.
The third layer is margin after the complete cost stack. AI infrastructure requires accelerators, CPUs, networking equipment, memory, storage, cooling, buildings, land, power connections, engineering and ongoing replacement. Revenue growth can coexist with falling gross margins if the price of compute declines faster than the cost per token or if depreciation catches up with the installed base. Microsoft’s cloud gross margin was 65%, down partly because of AI infrastructure investment. Alphabet’s Google Cloud margin improved sharply, but management warned that third-party capacity would create near-term pressure. AWS remained highly profitable, but Amazon’s companywide free cash flow moved deeply negative.
The fourth layer is incremental productivity. Meta does not need to sell cloud capacity externally for AI investment to generate a return. Better recommendation systems can increase time spent, ad impressions and conversion. Generative tools can improve ad creation and widen the pool of advertisers. Automated moderation and coding tools can reduce operating costs. The difficulty is attribution. When revenue increases, how much came from AI rather than pricing, macroeconomic demand, product changes or market-share gains? When headcount falls, how much is durable productivity rather than a one-time restructuring? The more indirect the benefit, the higher the burden on management to provide credible operational evidence.
For Apple, AI ROI can appear through device replacement cycles, premium pricing, services retention and lower development costs. Apple does not need to build a public cloud comparable with Azure to earn a return. It can integrate models into the operating system, use its installed base as distribution and outsource parts of the foundation-model layer. Its collaboration with Google on next-generation Apple Foundation Models is evidence of that more selective approach. The trade-off is strategic dependence: buying or partnering can reduce capital requirements, but it may also surrender part of the economics and limit differentiation.
For Tesla, the ROI categories include higher software revenue per vehicle, a company-operated robotaxi fleet, licensing, insurance data, Optimus robots and manufacturing efficiency. These opportunities could be large, but they are contingent. A paid FSD subscription is current revenue. A supervised driver-assistance feature that may eventually support autonomy is not the same as a functioning unsupervised robotaxi network. A factory line for Cybercab is a tangible investment, yet its return depends on regulatory approvals, safety performance, fleet utilization, pricing and maintenance costs. The analytical mistake is to combine current and hypothetical revenue as though they have the same probability and timing.
The Capital-Expenditure Comparison—and Its Accounting Traps
| Company | Current 2026 or fiscal-year indication | Important qualification |
|---|---|---|
| Microsoft | Approximately $175 billion for calendar 2026, after an accounting-classification update | Longer expected building lives change some future leases from finance to operating classification; the investment plan was not reduced. |
| Alphabet | $195 billion to $205 billion | Includes servers, data centers and technical infrastructure; management expects significant further growth in 2027. |
| Amazon | Approximately $220 billion | Supports AWS, AI, custom chips, fulfillment and other technology infrastructure; not every dollar is generative-AI spending. |
| Meta | $130 billion to $145 billion | Company measure includes principal payments on finance leases; infrastructure also supports recommendations, ads and core services. |
At the midpoint of the disclosed ranges and indications, the four companies approach $725 billion. The figures are directional rather than strictly comparable because accounting definitions, fiscal calendars and asset categories differ.
Capital expenditure is a cash-flow measure, but it becomes an earnings expense gradually through depreciation. That timing difference is central to the current debate. A company can report strong operating profit while spending far more cash than it expenses through the income statement. As the installed base grows, depreciation catches up. If revenue growth slows before that happens, margins can weaken even without another acceleration in cash spending.
Useful-life estimates add another layer. Extending the estimated useful life of data-center buildings reduces annual depreciation and can change lease classification, but it does not eliminate the economic obligation to maintain, power and eventually replace the facility. Conversely, accelerators and networking equipment can become economically obsolete faster than the building that houses them. Microsoft said roughly two-thirds of its quarterly capex related to short-lived assets such as CPUs and GPUs. That mix makes capacity productive quickly, but it also creates a substantial future replacement cycle.
Free cash flow also differs by company definition. The common simplified measure is operating cash flow minus purchases of property and equipment. Some companies include finance-lease principal payments; others discuss them separately. Amazon’s trailing free cash flow was negative even as AWS operating income remained strong. Meta’s quarterly free cash flow fell to $784 million partly because capital expenditure surged. Microsoft produced $19.6 billion after capex during the quarter. Comparing those figures without reading the definitions can create a false ranking.
Another trap is to treat every data-center dollar as equivalent. A facility built near available power, with committed customers and a favorable chip supply agreement, has a different prospective return from a facility delayed by interconnection queues or dependent on expensive third-party capacity. Alphabet acknowledged that using third-party infrastructure would weigh on near-term margins. Amazon emphasized that demand exceeded available supply. Microsoft discussed balancing near-term accelerator purchases with long-lived buildings. The same capex line can therefore represent very different economics.
Microsoft Became the Hyperscaler Benchmark
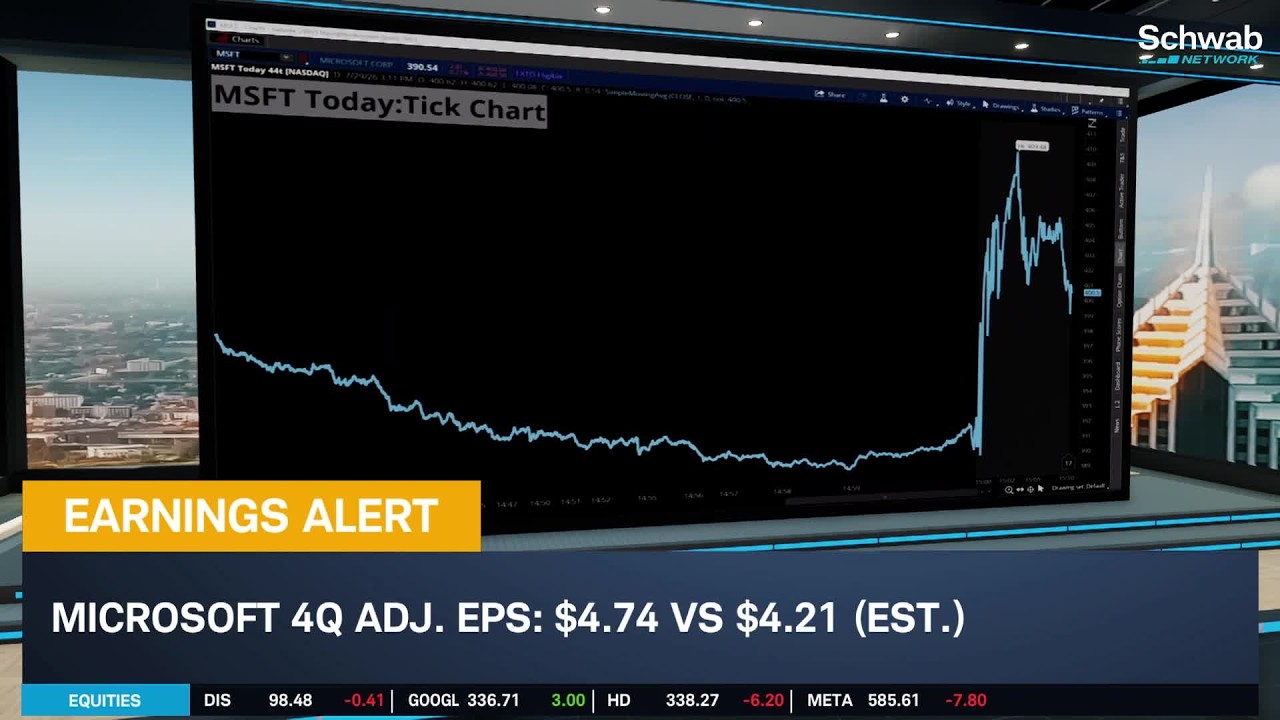
Microsoft’s fiscal fourth-quarter report was the most complete demonstration of the market’s new AI standard. Revenue reached $90.0 billion, up 18% from a year earlier. Operating income rose 18% to $40.6 billion. GAAP net income increased 31% to $35.8 billion, while diluted earnings per share rose 32% to $4.81. Microsoft Cloud revenue increased 27% to $59.3 billion. Azure and other cloud services grew 43%, and the Intelligent Cloud segment generated $39.3 billion of revenue, up 32%.
The scale of the annual figures was equally important. For fiscal 2026, Microsoft generated $331.8 billion in revenue, an 18% increase. Microsoft Cloud revenue reached $214 billion, up 27%. Azure surpassed $100 billion in annual revenue and grew 41%. That milestone moved the AI discussion away from product demonstrations and toward a mature commercial platform with enough scale to fund the next investment cycle.
Microsoft also provided evidence at the application layer. Microsoft 365 Copilot exceeded 30 million paid seats, and net additions more than doubled from the prior quarter. Paid seats are not the same as active use, customer retention or incremental profit, but they are substantially stronger evidence than a count of free users or trials. The product sits inside a suite that already has enterprise procurement relationships, identity controls, compliance tools and distribution. That reduces the customer-acquisition burden and gives Microsoft an efficient route from model capability to recurring software revenue.
The quarter did not remove the capital risk. Microsoft spent $41 billion on capital expenditure, including finance leases, and expected more than $50 billion in the September quarter. It said about two-thirds of the June-quarter total related to short-lived assets, mainly CPUs and GPUs. Cloud gross margin was 65%, and company gross margin was 67%; both were pressured by AI infrastructure. The economics therefore remain demanding even when revenue is accelerating.
What distinguished Microsoft was that the investment was matched by current cash generation and forward indicators. Operating cash flow was $55.4 billion. Free cash flow was $19.6 billion. Remaining performance obligations reached $678 billion, although the headline growth rate was inflated by OpenAI-related commitments. Management disclosed that RPO growth excluding OpenAI was 25%, and said sequential growth came entirely from companies outside frontier-model firms. That qualification matters because it addresses a central skepticism: whether hyperscaler demand is broad enterprise adoption or a circular concentration among a small group of heavily financed AI laboratories.
The company also guided Azure growth to approximately 45% in constant currency for the next quarter. Guidance can be missed, and Microsoft’s capacity constraints mean some demand may shift between periods. Still, a company that is spending heavily while forecasting further acceleration offers a clearer argument than one asking investors to wait for an unspecified future inflection. The market’s response—an after-hours rise of about 9%, followed by a much larger regular-session gain—reflected the combination of present performance and forward visibility.
Why Azure Is More Than a Single Growth Number
Azure’s growth rate attracts attention, but the platform’s strategic importance comes from its position across the enterprise stack. Microsoft can sell infrastructure, databases, analytics, cybersecurity, development tools, model access and productivity software to the same customer. The value of a Copilot seat may therefore extend beyond the direct subscription price. It can increase consumption of Azure services, strengthen retention within Microsoft 365 and create demand for governance and security products.
This bundling power is an advantage, but it complicates ROI measurement. Some AI revenue appears directly in Azure consumption. Some appears in Microsoft 365 subscriptions. Some helps defend existing prices or reduces churn. Some supports GitHub, Dynamics and security products. Management can demonstrate adoption across the portfolio, yet outside investors cannot fully allocate the capital cost to each revenue stream. The broad ecosystem creates multiple monetization paths while making exact attribution harder.
Microsoft’s OpenAI relationship adds both strategic leverage and concentration risk. Access to leading models helped Microsoft move early, while OpenAI’s infrastructure commitments expanded backlog. At the same time, a material share of RPO tied to one partner can make the headline figure look more diversified than it is. Microsoft’s decision to disclose ex-OpenAI growth was therefore not a minor footnote. It provided evidence that enterprise demand beyond frontier-model training remained healthy.
The benchmark established by Microsoft was not “spend any amount and investors will approve.” It was more demanding: show accelerated consumption, paid application adoption, diverse contracted demand, strong operating cash flow and a near-term growth outlook that supports the next tranche of capacity. Few companies can meet all of those conditions simultaneously. That is why the result raised the standard for every subsequent hyperscaler.
Alphabet Proved Demand—and Raised the Cost of Believing It
Alphabet’s second-quarter report was, on its face, an unusually strong set of operating results. Total revenue was approximately $119.7 billion, up 24% from a year earlier. Google Services revenue rose 15% to $94.5 billion. Google Search and other advertising increased 17% to $63.3 billion, YouTube advertising grew 13% to $11.1 billion, and subscriptions, platforms and devices advanced 15% to $12.9 billion. The core advertising machine was not being displaced by AI; it was expanding while the company invested around it.
Google Cloud was the standout. Revenue increased 82% to $24.8 billion. Operating income more than tripled to $8.8 billion, and the segment’s operating margin climbed to 35.6% from 20.7%. Backlog reached $514 billion, an increase of more than $50 billion from the previous quarter. Alphabet said Cloud growth accelerated even when excluding the initial recognition of sales involving its TPU systems, which means the result was not solely an accounting benefit from a new hardware-revenue stream.
These numbers directly support the argument that demand for AI infrastructure is real. Alphabet said its systems were processing 22 billion tokens per minute, up by six billion sequentially. Nearly 90% of the Fortune 100 used Gemini Enterprise, according to management. The company remained supply constrained. Those disclosures describe a business with both broad usage and a shortage of capacity, not a speculative platform searching for customers.
The market’s concern was the scale and persistence of the investment required. Alphabet increased its expected 2026 capital expenditure to a range of $195 billion to $205 billion, up from $180 billion to $190 billion. Management also expected a significant increase in 2027. The midpoint of the new range was more than twice Alphabet’s full-year capex only two years earlier. The spending is not a one-quarter response; it is becoming the operating structure of the business.
Alphabet also warned that free cash flow would remain under pressure and that the use of third-party capacity would weigh on margins in the near term. That is an important distinction from the transcript’s suggestion that Alphabet had simply reported negative free cash flow. The company’s official discussion was more precise: cash conversion was being compressed by investment, while the cloud segment itself was strongly profitable. Describing the entire company as having negative free cash flow without specifying the measurement period would overstate what the filings established.
Why an 82% Cloud Growth Rate Was Not Enough
Alphabet’s result arrived before Microsoft and Amazon, so it performed two jobs for the market. First, it confirmed that enterprise and developer demand remained exceptionally strong. Second, it reset expectations for the capital intensity of the entire industry. Investors had to increase both the numerator and denominator in their valuation models: more prospective revenue, but also more equipment, depreciation, energy and financing expense.
The initial share decline therefore did not mean that the market considered Google Cloud weak. Reuters reported that Alphabet shares fell about 5% in premarket trading after the capex increase. The reaction was closer to a debate over the price of growth. A cloud business can expand rapidly and still destroy value if the assets required to produce that growth earn less than the company’s cost of capital. Alphabet’s improving cloud margin argues against that bearish conclusion today, but the larger buildout extends the period over which the economics must be tested.
Google’s integrated business model creates several possible returns. AI can support Cloud revenue, improve Search answers, increase advertising relevance, strengthen YouTube recommendations, support subscriptions and reduce internal development costs. That diversification is valuable. It also means that a simple comparison between capex and Google Cloud revenue understates the benefits. A data center may serve Search, Gemini, YouTube and external customers at different times.
The complication is that Search economics are unusually attractive. Traditional search advertising requires far less incremental compute per query than many generative experiences. If AI-generated answers become the default interface, Alphabet may have to spend more to defend a revenue stream that previously required less infrastructure. Even if the new product protects market share, the return can look weaker than the old model because the company is paying more to preserve an existing dollar of revenue. That is economically different from creating a wholly new cloud dollar.
Alphabet’s strongest response to that concern is the combination of continued Search growth and expanding Cloud profitability. Search revenue increased 17%, while Cloud operating margin rose nearly 15 percentage points. The company was not merely substituting an expensive answer engine for a deteriorating advertising franchise. The skeptical response is that the full depreciation burden of the 2026 and 2027 buildout has not yet flowed through the income statement. Both observations can be true.
Backlog, TPU Sales and the Quality of Growth
Google Cloud’s $514 billion backlog is a major indicator, but it should not be read as guaranteed near-term revenue. Backlog includes contractual commitments that may be recognized over several years and may contain termination rights, consumption assumptions or customer concentration. The relevant questions are how quickly it converts, how much comes from the largest AI laboratories and whether pricing remains attractive as competitors add capacity.
The first recognition of TPU system sales also deserves context. Selling custom AI systems can increase revenue and deepen customer relationships, but hardware usually carries different margins and working-capital requirements from software or cloud consumption. Alphabet said most of the associated revenue would be recognized in 2027. Investors therefore need to distinguish between current Cloud acceleration and future contracted system delivery.
Custom silicon is strategically important because it can lower dependence on third-party accelerators and improve cost per unit of compute for workloads optimized to the architecture. It can also create a differentiated product for external customers. The risk is that the pace of model change makes hardware bets obsolete faster than expected. A custom chip earns an attractive return only if software ecosystems, customer demand and production yields support enough utilization over its useful life.
Alphabet’s quarter ultimately strengthened the case that it belongs in the top tier of enterprise AI providers. It did not settle the return question. The company showed revenue, margin and backlog evidence that many skeptics had demanded, then increased the required investment before those skeptics had time to declare victory. That is why Alphabet both validated the AI cycle and intensified anxiety about it.
Amazon Made Negative Free Cash Flow Look Investable
Amazon’s second-quarter report may have been the clearest example of the difference between cash burn caused by deterioration and cash burn caused by expansion. Net sales increased 20% to $200.6 billion. Operating income rose 43% to $27.5 billion. AWS revenue increased 37% to $42.2 billion, the segment’s fastest expansion in 18 quarters. The cloud business had an annualized revenue run rate of roughly $169 billion and remained the company’s main source of operating profit.
At the same time, Amazon’s trailing free cash flow moved to negative $7.6 billion from positive $18.2 billion a year earlier. Capital expenditure surged as the company built data centers, acquired servers, expanded custom-chip capacity and continued investment in logistics and fulfillment. In a conventional earnings framework, a swing of more than $25 billion in free cash flow would be an obvious warning. Amazon shares nevertheless rose sharply because the AWS acceleration suggested that the investment was meeting contracted demand rather than compensating for a weakening franchise.
Management raised expected 2026 capital expenditure to approximately $220 billion from $200 billion. CEO Andy Jassy said demand continued to exceed available infrastructure. Amazon also said AWS, its AI business and its custom-chip business had each passed a $25 billion annualized revenue run rate. Those categories overlap and should not be added together as separate revenue streams, but the disclosure still indicates commercial scale beyond a single model provider or experimental workload.
AWS backlog rose to approximately $496 billion, according to Amazon’s disclosures and Reuters reporting. The company said much of its 2027 capacity was already committed. That is the evidence investors wanted: customers reserving capacity before the assets are fully deployed. It does not eliminate execution risk, but it narrows the range of demand outcomes compared with a speculative build.
The AWS Economic Model
AWS has long demonstrated that infrastructure can become a high-margin business once utilization and scale are established. Its second-quarter operating margin was around 39%, far above the margins of Amazon’s retail operations. The model combines substantial upfront capital expenditure with recurring customer consumption. If equipment reaches breakeven within a few years and contracts persist beyond that point, later cash flows can be attractive even when the initial investment depresses free cash flow.
The AI cycle changes that model in several ways. Accelerators are more expensive than conventional servers. Networking and cooling requirements are greater. Customers may reserve entire clusters, increasing concentration. Hardware generations can turn over quickly, making residual value less certain. Power availability can delay deployment even after chips are secured. On the positive side, demand for training and inference can be enormous, and customers are often willing to sign longer commitments to guarantee access.
Amazon’s custom-chip strategy is designed to improve those economics. Trainium and Inferentia give AWS alternatives to the most expensive third-party accelerators for workloads that can be optimized to Amazon’s stack. Custom silicon can lower cost, improve gross margin and give customers another supply channel. It can also deepen lock-in because applications built around proprietary tools are harder to move. The risk is that customers prefer the broad software ecosystem associated with other hardware, limiting adoption or forcing Amazon to subsidize the transition.
The company’s relationship with Anthropic illustrates both the opportunity and the accounting complexity. Amazon supplies infrastructure to Anthropic and owns a substantial investment in the model developer. Its second-quarter net income of $62.6 billion included a large non-operating gain related to the increased value of that stake. That gain was not cash generated by AWS operations and should not be used as proof that the quarter’s infrastructure spending had already paid off. Operating income, AWS revenue, backlog and cash flow are the more informative measures.
Why Amazon’s Cash-Flow Decline Still Matters
The market’s positive reaction should not be confused with a conclusion that free cash flow is irrelevant. Amazon must eventually convert its record spending into cash after capex. A negative trailing figure can be acceptable during a capacity expansion if growth and utilization remain strong. It becomes dangerous if cloud growth decelerates, customer commitments are renegotiated or the replacement cycle arrives before the original assets earn their target return.
Amazon also invests across more than AWS. Fulfillment centers, delivery networks, devices, satellites and other technology compete for capital. The $220 billion figure therefore cannot be assigned entirely to AI. That diversification can reduce risk because the assets support several businesses, but it can also obscure whether the highest-return projects are receiving the money. Investors depend on management’s internal allocation discipline.
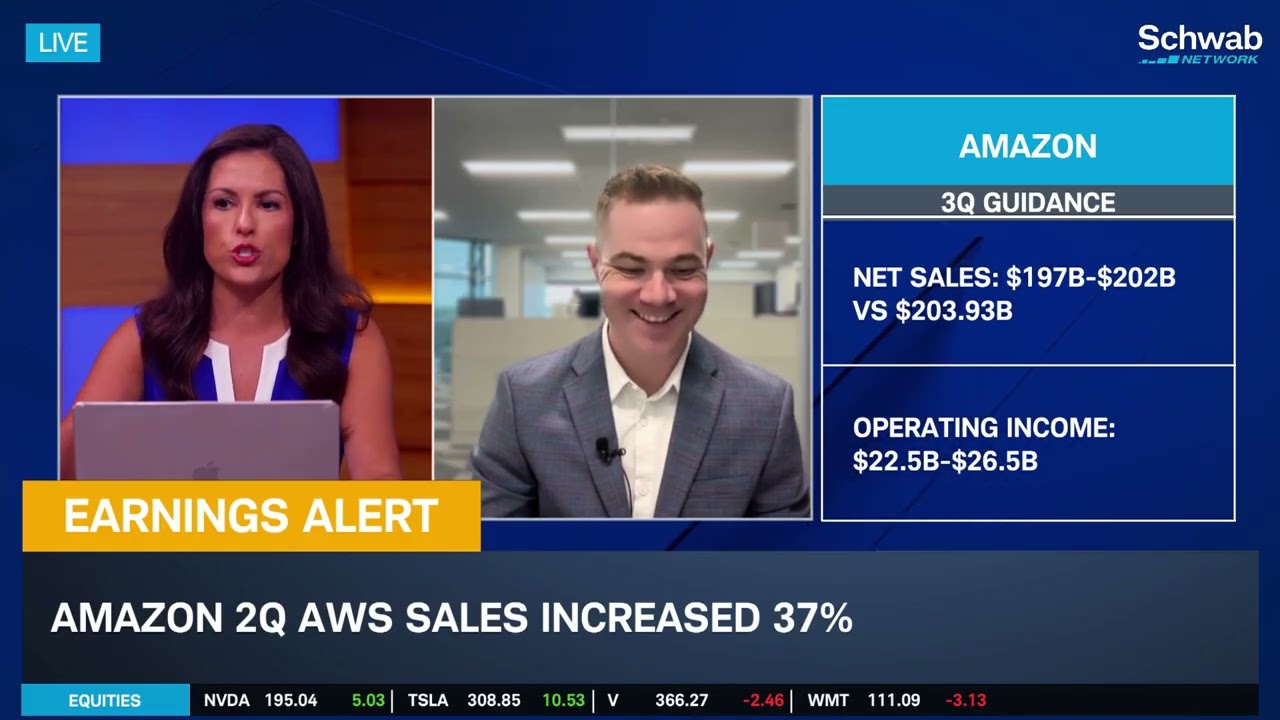
The second-quarter guidance for the following period offered continued confidence but not unlimited upside. Amazon projected net sales of $197 billion to $202 billion and operating income of $22.5 billion to $26.5 billion. The ranges acknowledged the volatility created by rapid investment and the broader business mix. AWS can outperform while retail margins, labor costs or logistics spending move in the opposite direction.
Amazon’s result was therefore not a blanket endorsement of cash burn. It was a conditional endorsement of capital spending backed by accelerated cloud revenue, high segment profitability, a large contracted backlog and capacity scarcity. Those conditions are demanding. If they weaken, the same cash-flow figure that investors tolerated in July could become the central bearish argument in a later quarter.
Fact Box
Why Microsoft and Amazon Passed the Immediate ROI Test
- Both reported accelerating cloud growth at very large revenue bases.
- Both described demand as exceeding available infrastructure.
- Both supplied forward indicators through backlog, commitments or guidance.
- Both had established public-cloud businesses that can monetize infrastructure directly.
- Microsoft maintained positive quarterly free cash flow; Amazon’s negative cash flow was accompanied by strong AWS operating economics.
Original sources: Microsoft fiscal 2026 fourth-quarter results and Amazon’s second-quarter earnings exhibit filed with the SEC.
Meta’s Advertising Strength Could Not Hide the Cash-Flow Gap
Meta’s second quarter demonstrated why revenue growth and investment returns can tell different stories. Revenue rose 28% to $60.8 billion. Daily active people across its family of apps increased 3% to 3.60 billion. Advertising impressions increased 14%, while the average price per ad rose 12%. Those figures suggest that Meta continued to improve both the quantity and value of advertising delivered across Facebook, Instagram and its other services.
Yet costs and expenses increased 55% to $42.0 billion. Operating income declined 8% to $18.8 billion, and operating margin fell to 31% from 43%. Net income decreased 14% to $15.8 billion. Free cash flow collapsed to $784 million from $8.55 billion a year earlier. The company still generated $31.9 billion in operating cash flow, but $31.1 billion of capital expenditure, including finance-lease principal payments, absorbed nearly all of it.
Some of the earnings decline was not a direct AI infrastructure cost. Meta recorded $2.40 billion of legal charges and $1.18 billion of severance tied to a May 2026 workforce reduction affecting roughly 8,000 employees. Separating those items is necessary for a fair analysis. Even after doing so, the cash-flow compression was real because capital spending had risen sharply.
Meta narrowed its 2026 capex range to $130 billion to $145 billion, raising the lower end from $125 billion. It expected full-year expenses of $165 billion to $169 billion. The company was not retreating from the buildout. Mark Zuckerberg argued that abundant compute would be a strategic asset and described a future of personal superintelligence that augments individuals. The market’s question was not whether Meta could afford the spending in the near term; it ended the quarter with more than $90 billion in cash and marketable securities. The question was how directly the new assets would produce incremental profit.
Meta’s AI Return Is Real but Harder to Isolate
Meta already monetizes AI through recommendation and advertising systems. More relevant content can increase engagement. Better targeting can raise advertiser returns. Generative tools can help small businesses create campaigns, expanding ad demand. Automated systems can improve moderation, translation and engineering productivity. These are meaningful economic channels, and the 28% revenue growth provides circumstantial support for management’s strategy.
But Meta does not report a discrete “AI revenue” line. The advertising business also benefits from macroeconomic conditions, pricing, product formats and competitive shifts. Investors cannot observe how many additional dollars came from the newest infrastructure compared with older ranking systems or ordinary ad-market growth. That makes the return narrative less transparent than a cloud contract or a paid Copilot seat.
Meta could theoretically rent excess compute to external customers, and management has discussed the strategic value of optionality around capacity. Reuters reported that the company had received attractive offers to lease infrastructure but continued to prioritize its internal needs. External rental could improve utilization and produce visible revenue, but it would also consume scarce capacity needed for Meta’s own models and products. Entering the public-cloud market at scale would require sales, support, developer tools, service-level commitments and an ecosystem that cannot be created merely by owning GPUs.
The comparison with Microsoft is therefore imperfect. Microsoft builds infrastructure for a mature commercial platform that customers already buy. Meta builds much of its infrastructure to improve products it gives users for free and monetizes through advertising. The latter model can still produce excellent returns, but the evidence arrives indirectly and often later. A higher burden of proof is reasonable when cash flow falls before management can isolate the new revenue.
The Metaverse Precedent Increased Investor Skepticism
Meta’s previous spending cycle shapes how markets interpret the current one. Reality Labs has accumulated large operating losses while its long-term commercial payoff remains uncertain. That history does not prove that AI investment will fail. AI already influences Meta’s core advertising and recommendation systems in ways the metaverse did not. Still, investors remember that management was willing to spend heavily for years on a strategic vision without near-term financial validation.
This precedent raises the value of concrete milestones. Meta can strengthen its case by disclosing measurable improvements in ad conversion, recommendation engagement, cost per inference, model utilization and product revenue attributable to AI. Broad claims about future superintelligence may inspire users and employees, but they are not substitutes for unit economics.
The company’s messaging also matters because restructuring and investment occur simultaneously. Describing workforce reductions as part of an AI-driven productivity transition while committing more than $130 billion to infrastructure creates a difficult narrative for employees and investors. The economic explanation may be coherent—capital can replace some labor while expanding product capability—but the social and governance implications require more than a promise that future productivity will justify current disruption.
Meta’s strongest defense is the resilience of its core business. A 28% revenue increase, 26% combined growth in ad impressions and pricing, and billions of daily users provide a large base from which to fund experimentation. Its strongest vulnerability is that the capex ramp is outpacing the clarity of the return. The market’s roughly 9% post-earnings decline reflected that gap.
Enterprise AI Is Becoming the First Reliable Monetization Layer
The latest results support a broader conclusion: enterprise cloud is currently the most visible monetization layer of the AI boom. Consumer chatbots produce enormous usage, but usage does not automatically produce revenue sufficient to cover infrastructure. Enterprise customers, by contrast, can sign multi-year contracts, pay for reserved capacity, purchase software seats and integrate models into workflows where productivity gains have an identifiable budget owner.
Microsoft’s advantage is distribution. It can place Copilot inside applications employees already use and bill through existing enterprise agreements. Amazon’s advantage is infrastructure breadth and operational maturity. It can sell customers a range of compute options, including proprietary chips, and connect AI workloads with databases, storage and security. Google’s advantage is model capability, custom silicon and a rapidly expanding Cloud platform. Each converts the same underlying demand into revenue through a different combination of infrastructure and software.
Enterprise adoption is still not guaranteed to produce attractive customer ROI. A company may buy thousands of seats and discover that employees use them infrequently. An AI application may save time but introduce verification, security or compliance costs. Model prices may fall rapidly, benefiting customers while pressuring provider margins. Data residency and governance requirements can slow deployment. The move from experimentation to production is a positive signal, not proof that every use case is economical.
Paid-seat counts, consumption growth and backlog are therefore intermediate measures. The deeper test is renewal at economically sustainable prices. Providers will eventually need to show that customers continue buying after initial pilots, that utilization broadens beyond a small group of technical teams and that the cost of serving inference declines fast enough to support margins. The 2026 earnings season showed progress toward that test, but not its completion.
Apple Is Experiencing the AI Boom as a Hardware-Economics Shock
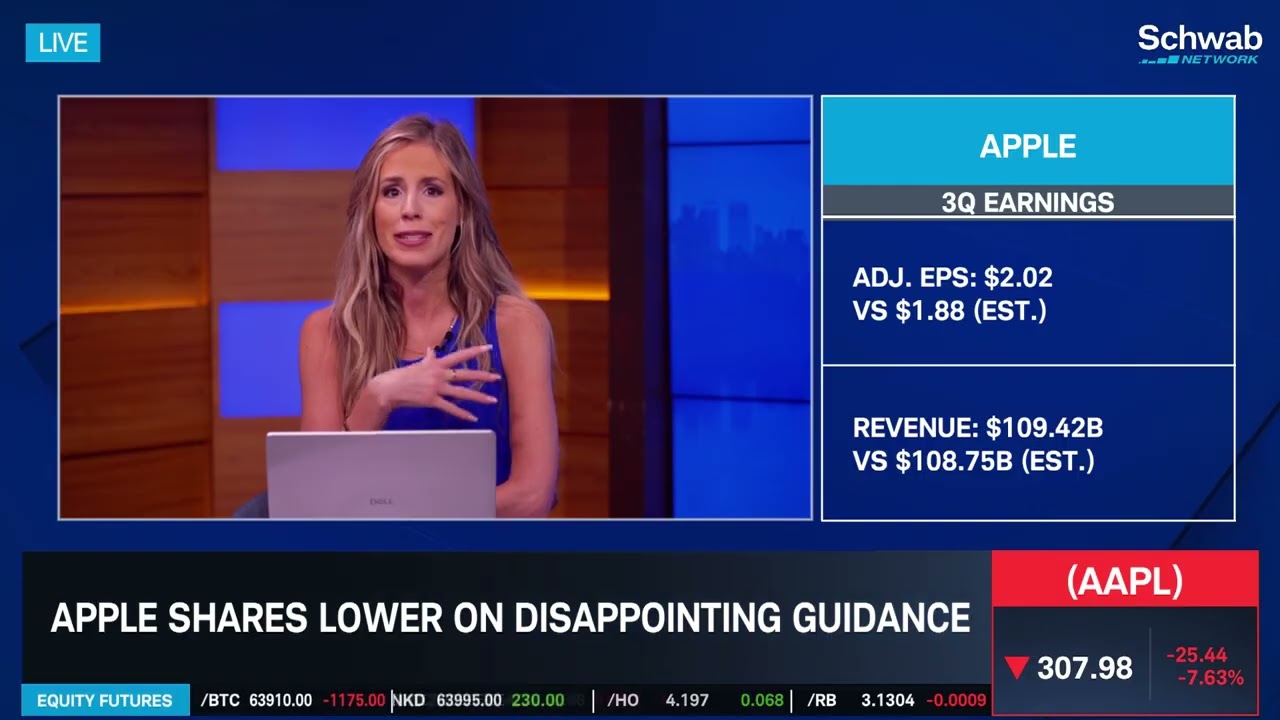
Apple’s fiscal third quarter did not resemble a weak earnings report. Revenue increased 16% to $109.4 billion. Net income rose 27% to $29.8 billion. Diluted earnings per share increased 29% to $2.02. iPhone revenue climbed 22% to $54.3 billion, while Mac revenue increased 29% to $10.4 billion. Services revenue reached $30.7 billion, up 12%. The company’s gross margin was 50.1%, an unusually high level for a hardware-heavy business, although tariff refunds added approximately two percentage points.
The stock fell because the next quarter looked more constrained than the completed one. Apple forecast revenue growth of 9% to 11%, below the roughly 12% consensus reported by Reuters. Management said supply limitations, rather than demand weakness, were restricting sales. The company’s quarterly filing warned that constraints and rising costs for advanced semiconductors, NAND flash and DRAM were expected to intensify. These are the same components being absorbed by the global data-center buildout.
That makes Apple an important part of the AI investment story even though it does not operate a public-cloud platform on the scale of Microsoft, Amazon or Alphabet. The infrastructure boom changes the relative bargaining power of suppliers and customers across the semiconductor chain. Advanced packaging capacity, leading-edge wafers, high-bandwidth memory and conventional memory are being prioritized for accelerators, servers and hyperscale customers. Apple is one of the world’s largest component buyers, but even its scale cannot create supply that does not exist.
The company’s inventory rose to $11.1 billion from $5.7 billion at the end of the prior fiscal year. It disclosed $57.0 billion of manufacturing purchase obligations, with $56.2 billion due within 12 months. Those figures reflect a company securing components and production capacity in a market where flexibility has declined. Higher commitments can protect product availability, but they increase the risk of excess inventory if demand changes or product transitions are mistimed.
Apple’s Strong Quarter Contained Several Qualifications
The headline gross margin benefited from tariff refunds. Excluding that effect, Reuters estimated the margin would have been around 48.1%, still strong but less extraordinary. Services growth of 12% was healthy, yet it missed some market expectations and remained below the pace of iPhone and Mac growth. iPad revenue declined 6% to $6.2 billion. The earnings beat therefore combined genuine product strength with a favorable item that should not be projected automatically into future quarters.
Apple’s research and development expense increased 32% to $11.7 billion, partly because of higher infrastructure, AI and personnel costs. That is a meaningful commitment, but the company’s asset model remains dramatically lighter than the hyperscalers’. During the first nine months of its fiscal year, Apple purchased $6.8 billion of property, plant and equipment, less than Microsoft spent in a matter of weeks. Apple’s strategy is to own the customer relationship, operating system, device silicon and product integration while relying more heavily on suppliers and partners for manufacturing and portions of the model stack.
This model can produce superior returns on capital if Apple differentiates the user experience without replicating the entire infrastructure layer. It also creates dependency. A shortage at a foundry or memory supplier can limit device sales. A partnership with an external model provider can accelerate product delivery but share economics and strategic control. The company must decide which AI capabilities are essential to own and which can be purchased without weakening privacy, performance or brand differentiation.
Gemini, Siri and the Logic of Selective Ownership
Apple’s June developer announcements described next-generation Apple Foundation Models custom-built in collaboration with Google and Gemini. Developers can also use models from providers such as Google and Anthropic through Apple’s development tools. This is not evidence that Apple has abandoned internal AI. It indicates a hybrid strategy: develop proprietary on-device and platform capabilities while using external models where they offer speed or scale.
The economic logic is compelling. Training frontier models and serving global consumer inference require enormous capital. Apple can direct more resources toward silicon, operating-system integration, privacy and product design rather than competing dollar for dollar in every layer. Its installed base provides distribution that model developers want, giving Apple bargaining power even when it is not the model owner.
The strategic risk is commoditization. If the most valuable consumer AI experience resides in a partner’s model and interface, Apple could become a high-quality hardware gateway rather than the primary intelligence layer. The company needs enough proprietary capability to preserve control over the experience and enough partner flexibility to avoid dependence on a single supplier. That balance will define whether outsourcing improves returns or merely postpones the competitive problem.
Leadership Transition Adds Execution Risk
Apple announced that Tim Cook will become executive chairman and John Ternus will become chief executive on September 1, 2026. The succession gives the company an engineer with long experience in hardware development at a moment when advanced silicon, supply-chain execution and AI integration are converging. That choice supports the view that Apple’s next phase will be defined as much by hardware economics as by software features.
The transition also raises normal governance and execution questions. Cook’s tenure was closely associated with supply-chain discipline, services expansion, capital returns and the scaling of Apple’s global operations. Ternus will inherit a company with a market value measured in trillions of dollars, unusually high expectations and a product portfolio exposed to both component scarcity and changing user interfaces. Maintaining current margins while funding AI and navigating partner relationships will be a difficult first test.
Apple’s new U.S. leasing program, Apple Upgrade, is another response to product economics. Backed by Klarna, it offers 12- or 24-month terms for iPhone and Apple Watch and longer options for Mac and iPad, with customers able to upgrade, buy or return devices. Leasing can reduce the visible monthly burden of higher device prices and support replacement cycles. It also changes residual-value, credit and customer-behavior considerations. The program may help Apple preserve demand if component costs push prices higher, but financing cannot remove the underlying cost.
Why Apple’s Share Decline Was Not an AI-Laggard Referendum
Apple shares fell 5.5% after hours and approximately 7.4% during the following regular session, according to Reuters, after initially trading down by nearly 10%. The decline erased hundreds of billions of dollars of market value. It would be easy to describe the move as punishment for Apple’s perceived AI lag. That explanation is incomplete.
The immediate catalysts were a softer revenue outlook, supply constraints, concern about services growth and uncertainty about price increases. AI mattered because it contributed to the component shortage and because investors remain unsure how Apple will monetize its model partnerships. But the quarter was primarily a lesson in how the data-center boom can transfer costs to device manufacturers. Apple was not being judged by the same cloud-revenue test as Microsoft. It was being judged on whether its supply chain and pricing power could protect unit sales and margins.
Tesla’s AI Valuation Runs Ahead of Its Current Cash Economics
Tesla’s second quarter contained a sharp rebound in activity and a sharp deterioration in profitability. Revenue increased 26% to $28.2 billion. Automotive revenue rose 23% to $20.5 billion. Energy generation and storage revenue increased 13% to $3.1 billion, while services and other revenue advanced 50% to $4.6 billion. Vehicle deliveries climbed 25% to 480,126, and energy-storage deployments rose 41% to 13.5 gigawatt-hours.
Those growth figures did not translate into stronger operating earnings. Gross profit rose 23% to $4.8 billion, but operating expenses increased 47% to $4.4 billion. Operating income fell 57% to $398 million, leaving an operating margin of 1.4%, down from 4.1%. GAAP net income attributable to common shareholders declined 5% to $1.1 billion. Average automotive revenue per vehicle fell as price competition and mix pressured the core business.
Cash flow captured the tension. Operating cash flow was $4.7 billion, up 85%, but capital expenditure increased 142% to $5.8 billion. Free cash flow was negative $1.09 billion. Tesla ended the quarter with $43.5 billion in cash, cash equivalents and short-term investments, so the company had substantial liquidity. The concern was not imminent financing stress. It was whether the automotive business could generate enough durable cash to fund an increasingly capital-intensive AI and robotics strategy.
Tesla Is Both an Automaker and an AI Option
Debates over whether Tesla should be called an automaker or an AI company often create a false choice. It is legally and operationally an automaker with large manufacturing, delivery, service and warranty obligations. It is also investing in software, AI compute, autonomy, robotaxis and humanoid robots. The valuation can incorporate both. The analytical discipline is to avoid assigning mature-business certainty to prospective AI cash flows.
Current evidence includes 1.48 million Full Self-Driving subscriptions, a 56% year-over-year increase, and a more than doubling of on-site Texas AI compute during the first half of 2026. Tesla said its Cortex 1 and Cortex 2 installations exceeded 90 megawatts and 115 megawatts, respectively. Cybercab production had begun, and the company was expanding its Robotaxi effort. These are tangible operating milestones.
They are not equivalent to a fully scaled autonomous network. Tesla’s own disclosures continue to state that supervised FSD requires active driver supervision and does not make the vehicle autonomous. Robotaxi economics depend on safety performance, regulation, insurance, geographic coverage, fleet utilization, cleaning, maintenance, remote assistance and pricing. Each variable can materially change the return on the underlying compute and vehicle assets.
Optimus carries an even wider range of outcomes. A capable general-purpose robot could address an enormous market. It could also require years of development before achieving reliable, safe and economical operation outside controlled environments. Capital spent on robotics should therefore be assessed as high-risk research and industrial investment, not as though it were contracted cloud backlog.
The Core Automotive Business Still Funds the Vision
Tesla’s AI thesis depends on the health of the vehicle business more than the company’s rhetoric sometimes suggests. Automotive sales provide the installed base for subscriptions and data. Vehicle gross profit helps fund compute and engineering. Manufacturing scale could support Cybercab. Service centers and charging infrastructure provide a physical network that a mobility business can use.
Pressure on average selling prices weakens that funding engine. Reuters calculated that average revenue per vehicle fell to approximately $42,730 from $45,345 a year earlier. Lower prices can stimulate deliveries and expand the fleet, but they also reduce the cash available per unit to finance future projects. If software revenue does not rise quickly enough, volume growth can produce less economic value than the delivery headline implies.
Tesla expects 2026 capital expenditure to exceed $25 billion, driven by AI compute, data centers, factories, R&D production lines and company-operated AI-enabled assets. The company’s Q2 run rate suggests that spending is already accelerating. That program may create valuable capacity, but it increases sensitivity to delays. A one-year slip in autonomy matters more when billions of dollars of equipment and fleet assets are waiting for the associated revenue.
Unsupported Speculation Should Stay Out of the Valuation
The supplied interview briefly referred to a possible sale of Tesla’s China business. Tesla’s official second-quarter update and the company materials reviewed for this article did not confirm such a transaction. Geopolitical and regulatory risks in China are relevant, and Tesla may evaluate many strategic options internally, but an unverified possibility should not be presented as a current corporate plan.
This distinction is particularly important for Tesla because market narratives often move faster than filings. Claims about robotaxi timelines, licensing, manufacturing changes or asset sales can materially affect valuation. Investors and journalists should separate company disclosures, independently reported negotiations and speculation. The absence of confirmation does not prove that discussions never occurred; it means the claim cannot be used as established evidence.
Tesla shares fell about 4% in extended trading after the report and later experienced a much larger decline amid a broad risk-off session. The immediate reaction centered on the profit miss, 1.4% operating margin and negative free cash flow. Investors were not necessarily rejecting the autonomous future. They were increasing the discount applied to its timing.
The AI Boom Is Becoming a Memory, Power and Construction Cycle
AI investment began as a software narrative, but the 2026 earnings reports made its physical constraints impossible to ignore. Accelerators require advanced packaging, high-bandwidth memory, networking equipment, power supplies and cooling. Data centers require land, transformers, transmission connections, backup systems and construction labor. Consumer devices compete for some of the same semiconductor and memory capacity. The result is a capital cycle that reaches far beyond model developers.
Apple’s warnings about NAND, DRAM and advanced semiconductor availability are one visible consequence. Amazon cited higher memory prices as part of its spending outlook. Microsoft said a majority of quarterly capex went to short-lived compute assets. Alphabet relied partly on third-party capacity because internal supply was insufficient. These disclosures describe a supply chain operating near its limits.
Scarcity can strengthen provider economics in the short run. Customers may sign longer contracts or accept higher prices to secure capacity. It can also raise costs, delay revenue and increase the risk of overordering. Companies that reserve components aggressively may protect growth while demand is strong, then face inventory or purchase-commitment losses if the cycle turns. Semiconductor booms have historically contained both shortages and later gluts; AI does not repeal that pattern.
Electricity Is a Strategic Input, Not a Utility Footnote
The International Energy Agency projects global data-center electricity consumption to approximately double to around 945 terawatt-hours by 2030 in its base case, just under 3% of worldwide electricity demand. From 2024 through 2030, data-center consumption grows about 15% annually in that scenario, more than four times faster than demand from other sectors. The global share can appear manageable while local effects are severe because data centers cluster near fiber, customers and available power.
A project can have chips and customers yet remain delayed by grid interconnection. New transmission lines, substations and generation take years to plan and build. Utilities must decide who pays for upgrades and how to protect ordinary ratepayers from stranded costs if a data-center project is canceled. Local governments weigh tax revenue against water, land and environmental concerns. Power procurement is becoming part of hyperscaler competitive strategy.
Energy costs also affect the return on AI infrastructure after construction. A model provider with lower cost per token can support lower prices or higher margins. Location, cooling design, chip efficiency and workload scheduling all matter. Companies that can move training to times and regions with abundant power may gain an advantage, while latency-sensitive inference must remain closer to users.
The energy issue creates a second-order risk for the broader economy. Large, concentrated loads can raise local prices or require investment that is socialized across customers. At the same time, hyperscaler demand can finance new renewable, gas or nuclear capacity and accelerate grid modernization. The net effect depends on contract design, regulation and project execution rather than on a simple claim that AI is either good or bad for the energy system.
Depreciation Will Become the Next Earnings Debate
The cash buildout comes first; the depreciation wave follows. Servers and accelerators placed into service begin generating expense over their estimated lives. Data-center buildings depreciate over longer periods. Network equipment, cooling and power infrastructure have separate schedules. As the asset base expands, quarterly depreciation can rise even if capex stops accelerating.
That lag creates a window in which cloud revenue appears to grow faster than the full accounting burden. It does not make current margins artificial; generally accepted accounting principles intentionally match asset cost with the periods that benefit. It does mean that investors should model future depreciation rather than extrapolate present margins unchanged. Microsoft and Meta have already warned that infrastructure depreciation will rise. Alphabet expects pressure from capacity and third-party supply. Amazon’s operating model faces the same arithmetic.
Useful-life assumptions will receive more scrutiny. Extending a building’s expected life can be economically reasonable when facilities are designed for long operation. Extending the life of rapidly changing compute equipment is more controversial because economic obsolescence may arrive before physical failure. Companies need to explain changes clearly, especially when they materially affect earnings comparisons.
The Strongest Case for the AI Buildout
The bullish interpretation begins with demand. Every major cloud provider reported acceleration or exceptional growth. Backlogs expanded by hundreds of billions of dollars. Capacity remained constrained. Enterprise customers moved beyond pilots into production, and paid software adoption increased. The market is not relying solely on consumer excitement or executive forecasts; it can observe contracts and revenue.
The second argument is operating leverage. Building infrastructure is expensive, but software and cloud platforms can monetize the same assets across many customers and workloads. A data center used for training at one time can support inference or conventional cloud services at another. Proprietary chips can lower costs. Better models can improve advertising, productivity software, search, e-commerce and logistics. The benefits therefore extend beyond a single AI product.
The third argument is strategic necessity. Even if near-term returns are uncertain, underinvesting could be more damaging than overspending. A cloud provider that lacks capacity may lose customers for years. A productivity platform that misses a new interface can weaken its distribution advantage. A search company that fails to adapt could expose its core franchise. The investment is partly offensive and partly defensive.
The fourth argument is balance-sheet capacity. Microsoft, Alphabet, Amazon, Meta and Apple generate large operating cash flows and hold substantial liquidity. They can finance the buildout without the immediate solvency risks faced by smaller companies. Scale also improves purchasing power, access to power, custom-silicon economics and the ability to spread research across a large revenue base.
Finally, the technology remains early in its commercial deployment. If AI becomes a general-purpose input comparable with cloud computing or mobile software, the current infrastructure could support decades of applications. The providers that own scarce capacity, customer relationships and developer ecosystems may capture returns well beyond the first generation of products.
The Strongest Skeptical Case
The skeptical argument begins with circular demand. Cloud providers invest in model companies; model companies commit to buy cloud capacity; those commitments increase provider backlog; rising valuations help model companies raise more money to purchase more capacity. Not every transaction is circular, and enterprise demand is broadening, but concentration can make headline backlogs look more secure than the underlying financing chain.
The second concern is technological deflation. Models, chips and algorithms are improving rapidly. The cost of performing a given task may fall faster than demand rises. That is good for adoption but can pressure prices and make older equipment obsolete. A company may fill its data centers while earning lower returns per unit of compute than originally modeled.
The third concern is weak customer economics. Enterprises may discover that many AI tools are useful but not valuable enough to justify premium pricing. Accuracy, privacy, integration and employee training can reduce net productivity gains. If renewal rates disappoint after initial experimentation, cloud growth can slow just as depreciation accelerates.
The fourth concern is capital misallocation. Management teams may overbuild because strategic fear is stronger than financial discipline. When every competitor believes it cannot afford to fall behind, the industry can collectively create excess capacity even if each company’s decision appears rational. Telecommunications and fiber booms have produced similar patterns.
The fifth concern is margin migration. Even if AI creates enormous economic value, the value may accrue to customers, chip suppliers, utilities or application developers rather than to the hyperscalers funding the infrastructure. Competition can force cloud providers to pass efficiency gains to users. The largest revenue pools do not always earn the highest returns.
The skeptical case is strongest where monetization is indirect or distant. Meta must prove that internal compute creates enough incremental advertising profit. Apple must show that partnerships and device integration can produce upgrades without surrendering the interface. Tesla must bridge from supervised software and manufacturing investment to safe, regulated autonomous revenue. The farther the expected payoff, the more sensitive valuation becomes to interest rates, execution and changing assumptions.
Big Tech AI Spending: What Earlier Infrastructure Cycles Can Teach
The scale of the current program makes historical discipline especially important. The companies are not funding isolated research laboratories; they are reshaping asset bases that will influence depreciation, energy procurement and competitive behavior for years. History cannot supply a precise forecast, but it can identify the conditions under which infrastructure creates durable value and the conditions under which genuine technological progress still produces poor shareholder returns.
The present buildout is often compared with the early years of cloud computing. The comparison is useful because Amazon, Microsoft and Google all spent heavily before cloud revenue reached its current scale. Data centers that initially looked like a drag became the foundation of high-growth, recurring businesses. Investors who focused only on near-term free cash flow could miss the value of infrastructure once utilization, customer density and software ecosystems matured.
That history supports patient capital allocation, but it does not guarantee the same outcome for every AI asset. Traditional cloud infrastructure served a wide range of workloads: storage, databases, websites, business applications, analytics and disaster recovery. AI accelerators are more specialized, more expensive and potentially more exposed to rapid technical obsolescence. A general-purpose server can support many conventional tasks for years. A high-end accelerator may remain physically functional while becoming economically unattractive compared with a newer chip or a more efficient model architecture.
The customer base also differs. Conventional cloud adoption broadened across industries and company sizes over a long period. The first wave of frontier-model demand is more concentrated among a small group of laboratories, internet platforms and well-funded start-ups. Enterprise deployment is widening, as the latest earnings show, but a large contract from one model company should not be valued like thousands of unrelated corporate subscriptions. Concentration can accelerate growth and raise utilization while making the provider more exposed to one customer’s financing and competitive position.
A second historical comparison is the telecommunications and fiber buildout. Periods of genuine long-term demand can still produce poor returns when companies add capacity faster than customers can absorb it. Infrastructure may be socially useful and strategically important while its owners earn disappointing returns. The analogy is imperfect because hyperscalers control software, customer relationships and applications in addition to physical capacity. They can shift workloads and monetize across several layers. Even so, the basic warning applies: a correct forecast about rising usage does not automatically produce a correct forecast about returns.
The most relevant lesson from previous cycles is therefore conditional. Upfront investment can create durable competitive advantages when capacity is scarce, customers are committed and the platform earns recurring revenue. The same investment can destroy value when the industry overbuilds, technology changes before assets are recovered or competition forces prices below the return assumed at construction. The question is not whether AI demand grows. It is whether each company captures enough of the value created.
Interest Rates Change the Price of Waiting
AI projects are long-duration investments. A company spends cash today for revenue expected over several years. The present value of those future cash flows depends on the discount rate. When government-bond yields rise, distant earnings are worth less in current dollars, all else equal. That effect is particularly important for Tesla’s autonomy and robotics thesis and for Meta’s more speculative consumer products, where the timing of commercial returns is less certain.
Microsoft and Amazon reduce this duration risk by showing current cloud revenue and contracted demand. Alphabet also has substantial current monetization, although its new spending plan lengthens the payback question. Apple’s return can arrive through near-term device sales and services, but supply shortages can delay it. The market does not apply one discount rate mechanically; it assigns a higher risk premium to cash flows with greater technological, regulatory or customer uncertainty.
Rising rates can also affect customers. Start-ups that fund compute purchases with external capital may become less able to honor aggressive growth plans. Large enterprises can delay projects when their own cost of capital increases. Hyperscalers with strong balance sheets remain capable of building, but the demand they serve may become more selective. A backlog is strongest when the customer’s underlying business generates cash rather than depending on repeated financing rounds.
Three Plausible Paths for the AI Capital Cycle
Scenario One: Productive Scarcity Persists
In the most favorable scenario, demand continues to exceed supply through 2027 and 2028. Enterprise deployments broaden, paid application adoption rises and model usage expands faster than efficiency lowers total compute demand. Power connections and advanced chips remain scarce enough to support attractive pricing. Backlogs convert into revenue, while custom silicon and software optimization reduce cost per task.
Microsoft and Amazon would be well positioned in this scenario because they combine capacity with mature enterprise distribution. Alphabet could benefit disproportionately if Google Cloud sustains its recent share gains and its TPU systems attract external buyers. Meta’s internal investment could improve advertising and product engagement without needing to become a cloud provider. Apple could benefit from stronger device demand once component supply stabilizes. Tesla would still need separate regulatory and autonomy progress; general AI scarcity alone does not create a robotaxi business.
The financial signature would be continued high cloud growth, stable or improving utilization, modest margin pressure during the build and recovering free cash flow once the rate of capacity additions normalizes. Depreciation would rise, but revenue would absorb it. Customers would renew at prices that support both provider margins and their own productivity gains.
Scenario Two: Growth Normalizes but the Platforms Remain Profitable
A middle scenario is more likely than either extreme. Cloud growth slows from exceptional 2026 rates as capacity catches up, but AI becomes a normal part of enterprise technology budgets. Model prices decline, usage expands and providers earn acceptable rather than extraordinary returns. Infrastructure spending remains high in absolute dollars but grows more slowly. The largest platforms use bundling, custom chips and software ecosystems to defend margins.
In this outcome, stock performance would depend less on headline AI growth and more on cost discipline. Microsoft would need Copilot renewal and broader Azure consumption. Amazon would need AWS cash conversion. Alphabet would need Google Cloud profit to offset any increase in Search serving cost. Meta would need the advertising benefits to become visible in operating margin. Apple would need AI features to support replacement cycles. Tesla would need current software revenue to grow while longer-term projects mature.
This scenario would still validate much of the investment thesis. AI could become a large and useful business without sustaining 40% to 80% cloud growth. The danger for investors would be paying valuations that assume scarcity and hypergrowth persist indefinitely. A successful technology transition can coexist with disappointing stock returns when expectations are too high.
Scenario Three: Overbuild Meets Rapid Deflation
In the bearish scenario, providers add capacity just as model efficiency improves sharply and enterprise adoption disappoints. Customers use more AI but pay much less per unit. Frontier-model companies consolidate or reduce commitments. New chip generations make older equipment less competitive. Electricity and construction costs remain high, so the revenue benefit of efficiency accrues mainly to users rather than infrastructure owners.
The financial signature would be slower backlog conversion, discounting, lower utilization, impairment risk and rising depreciation relative to revenue. Companies might extend useful lives or redeploy equipment, but accounting changes would not restore the lost economic return. Free cash flow would stay weak after the growth justification had faded.
The hyperscalers would not be equally exposed. Microsoft and Amazon could redirect capacity toward broad cloud workloads and use software revenue to absorb some pressure. Alphabet could use infrastructure internally across Search and YouTube. Meta’s assets would remain useful for recommendations, but the size of the buildout could look excessive relative to incremental ad profit. Apple’s lighter capital model would protect its balance sheet, although component commitments could become expensive. Tesla would face the greatest risk if autonomy timelines slipped while specialized assets and fleet investment continued.
What Would Make the Market Change Its Mind?
The market’s current preference for Microsoft and Amazon is not permanent. Alphabet could close the confidence gap by sustaining cloud margin, converting backlog and showing that 2027 capex growth produces proportional revenue. Meta could change the narrative by restoring free cash flow while identifying measurable AI-driven ad and product gains. Apple could turn supply pressure into an advantage if its next product cycle commands higher prices without reducing unit demand. Tesla could reduce the discount on its AI ambitions through verifiable unsupervised operation, regulatory approvals and commercial fleet economics.
The reverse is also true. Microsoft’s benchmark status would weaken if Azure guidance slowed while capex remained above $50 billion per quarter, or if ex-OpenAI demand failed to broaden. Amazon’s rally would look premature if AWS backlog did not convert and free cash flow remained deeply negative after capacity came online. The market is rewarding evidence, not granting immunity.
Management credibility will matter more as the cycle matures. Early in a technology boom, broad strategic claims can attract capital. Later, investors compare previous promises with delivered margins and cash flow. Companies that provide consistent definitions and explain variances will receive more benefit of the doubt. Those that rely on changing metrics or distant visions will face higher skepticism even when the technology itself remains promising.
Why an Earnings Beat Is No Longer Enough
Several companies in this group exceeded headline expectations, yet their shares moved in opposite directions. That outcome is not irrational. Consensus estimates summarize what analysts expected for a limited set of reported numbers. They do not capture every assumption embedded in a stock price, including the quality of revenue, the durability of margins, the amount of capital required next year or the probability assigned to a new business.
Microsoft’s result improved several variables at once. Revenue and earnings were strong, Azure growth exceeded expectations, paid Copilot adoption accelerated and forward cloud guidance remained robust. Amazon’s quarter likewise changed the market’s view of AWS growth and capacity utilization. In both cases, the reports increased expected future revenue enough to offset the higher capital bill.
Alphabet’s report improved the cloud forecast but also increased the capital requirement. Apple’s completed quarter exceeded expectations, while management’s guidance reduced the expected growth rate for the next period. Meta’s revenue beat did not prevent free cash flow from falling sharply. Tesla’s delivery and revenue strength did not prevent operating margin from shrinking. The direction of the stock therefore depended on which part of the valuation model changed most.
Revenue quality is especially important in an infrastructure cycle. Cloud consumption from diversified customers, recurring software seats and contracted services generally carry more visibility than one-time hardware sales or unrealized investment gains. Amazon’s large Anthropic-related non-operating gain increased reported net income but did not demonstrate that AWS capex had paid off. Alphabet’s TPU system sales added a new revenue category but needed to be separated from underlying cloud consumption. Apple’s tariff refunds improved reported margin but were not a repeatable product advantage.
Cash-flow timing adds another complication. A company can beat earnings because depreciation recognizes only part of the cash already spent on assets. The later depreciation burden may rise even if the current quarter looks strong. Conversely, a company can report weak free cash flow while building assets tied to signed contracts. Neither earnings nor cash flow should be ignored; they answer different questions.
The more useful approach is to build a bridge from the reported quarter to normalized economics. Remove unusual gains and charges. Identify whether growth came from volume, price, acquisition, currency or a new accounting category. Estimate the future depreciation and operating cost of current capex. Compare guidance with the expectations embedded before the release. Then ask whether management’s evidence changed the probability of the long-term thesis.
This framework also explains why timing influenced reactions. Alphabet set the first capex benchmark. Microsoft then showed stronger near-term monetization than investors had feared. Amazon reported into a market newly prepared to reward cloud acceleration. Meta and Apple faced a higher burden because the preceding reports had clarified what direct evidence looked like. Earnings season is sequential: each release changes the expectations against which the next company is judged.
What Happened After the Earnings Releases
The sequence of reports mattered because each one changed the framework applied to the next. Alphabet reported on July 22, the same day as Tesla. Alphabet’s cloud growth exceeded expectations, but the capex increase pushed the shares down about 5% in premarket trading. Tesla fell about 4% in extended trading after reporting negative free cash flow and a thinner operating margin. In a broader risk-off session the following day, Tesla’s decline became substantially larger, illustrating how earnings reactions can be amplified by oil prices, interest rates and market positioning.
Microsoft reported on July 29 and reversed much of the skepticism. Its shares rose roughly 9% after hours and surged during the following session as investors focused on Azure, Copilot and forward cloud guidance. The move added hundreds of billions of dollars to Microsoft’s market value. The size of the reaction was not a measure of quarterly profit alone; it reflected the repricing of a long-duration AI platform after Microsoft supplied evidence that usage and monetization were accelerating together.
Meta reported the same day and moved in the opposite direction. Its shares fell more than 9% after investors saw the 91% decline in free cash flow and the increased lower bound of the capex forecast. The contrast between Microsoft and Meta was unusually clean. Both were spending heavily. Both had large existing businesses and strong revenue growth. Microsoft could point to direct cloud and software revenue from the infrastructure. Meta’s return was embedded in an advertising system and future products, making it harder to separate from the cost.
Amazon and Apple reported on July 30. Amazon’s shares rose nearly 9% after hours and more than 15% in the following regular session as AWS growth soothed concerns about AI spending. Apple fell 5.5% after hours and closed down about 7.4% the next day after trading lower by nearly 10%. The two moves again showed that reported revenue growth was not enough to predict the outcome. Amazon’s future cloud outlook improved; Apple’s near-term product outlook weakened because of supply constraints.
The broader market rose on July 31 as Amazon’s gain outweighed Apple’s decline. Reuters reported that the S&P 500 added 0.70% and the Nasdaq 1.00%. That market response is important. It suggests investors did not abandon the AI trade after a week of volatile earnings. They concentrated it more heavily in companies showing the clearest path from infrastructure to revenue.
How Investors Can Evaluate the Next Quarter Without Chasing Headlines
The first metric to watch is cloud growth on a comparable basis. Currency movements, hardware sales and changes in disclosure can distort headline rates. Alphabet’s TPU system revenue, Microsoft’s constant-currency guidance and Amazon’s contract timing should be separated from underlying consumption. Growth that remains strong after those adjustments is more persuasive than a single reported percentage.
The second metric is backlog conversion. Microsoft’s remaining performance obligations, Google Cloud’s $514 billion backlog and AWS’s roughly $496 billion backlog indicate demand, but investors need to see that commitments turn into recognized revenue and cash. Changes in customer concentration, contract duration and cancellation terms matter. Backlog growth funded by financially dependent counterparties deserves a larger discount than diversified enterprise demand.
The third metric is gross margin after AI infrastructure. A provider can maintain strong revenue growth while depreciation and third-party capacity reduce profitability. Microsoft has already identified AI investment as a cloud-margin headwind. Alphabet expects pressure from external capacity. AWS margins may fluctuate as new regions and chips ramp. The key question is not whether margins decline in any one quarter, but whether the decline is consistent with a planned capacity cycle or evidence that pricing is weaker than expected.
The fourth metric is free cash flow through the complete investment cycle. Microsoft’s quarterly free cash flow remained positive. Amazon and Tesla were negative under the measures emphasized in their reports, while Meta’s free cash flow nearly vanished. A single quarter can be distorted by payment timing, leases or working capital. A multi-quarter trend is more informative. Companies should eventually demonstrate that operating cash flow grows faster than maintenance and replacement spending.
The fifth metric is customer adoption at the application layer. Copilot paid seats, FSD subscriptions, advertiser use of generative tools and Apple Intelligence engagement can reveal whether infrastructure is producing products people pay for or use regularly. Counts should be paired with retention, active usage and revenue. A downloaded application, enabled feature or purchased seat does not prove sustained value.
The sixth metric is capital efficiency. Revenue per dollar of gross property and equipment, cash return on invested capital and incremental operating profit relative to capex can help identify whether the buildout is becoming more productive. These measures require adjustment because assets take time to enter service. They are most useful over several years and compared with each company’s own history rather than across fundamentally different business models.
The seventh metric is supply-chain execution. Apple’s component availability, hyperscaler power connections, accelerator delivery schedules and memory pricing can all change revenue timing. When management cites capacity constraints, the claim should be tested against backlog growth, customer commitments and later delivery. Persistent constraints with no conversion may indicate execution problems rather than excess demand.
The eighth metric is disclosure quality. Companies that explain capex composition, lease treatment, customer concentration and model economics give investors a better basis for valuation. Vague statements about unprecedented demand are less useful than paid seats, utilization, margin bridges and cash-flow reconciliation. As the spending grows, transparency should improve rather than shrink.
Fact Box
The Next Confirmed Evidence Points
- Microsoft: Whether Azure delivers approximately 45% constant-currency growth while quarterly capex exceeds $50 billion.
- Alphabet: Whether Google Cloud sustains exceptional growth as third-party capacity pressures margins and capex approaches $200 billion.
- Amazon: Whether AWS backlog converts quickly enough to restore free cash flow after the 2026 buildout.
- Meta: Whether ad improvements and new products produce a visible cash return while depreciation and infrastructure expense rise.
- Apple: Whether component supply improves, services growth stabilizes and higher prices preserve rather than weaken demand.
- Tesla: Whether automotive margins recover while robotaxi, FSD and Optimus milestones become measurable commercial revenue.
Context: Dates and guidance are based on the companies’ latest quarterly disclosures available through August 3, 2026.
Company-by-Company Risks That Matter Most
Microsoft: Concentration and Replacement Cost
Microsoft’s risk is not the absence of demand; it is the price of maintaining leadership. A large portion of its capital spending goes to short-lived compute assets. If model efficiency, customer preferences or chip architectures change quickly, replacement requirements may arrive before earlier equipment earns its planned return. OpenAI-related concentration also makes headline backlog less diversified than it first appears, even though ex-OpenAI growth remains strong.
Alphabet: Defending Search With More Expensive Answers
Alphabet must prove that AI enhances Search economics rather than merely raising the cost of defending them. Google Cloud can become a larger profit engine, but Search remains the foundation of the company. If generative answers reduce commercial clicks, increase serving costs or shift user behavior toward competing interfaces, strong cloud growth may not fully offset pressure on the higher-margin core.
Amazon: Cash Conversion After the Capacity Surge
Amazon’s principal test is whether committed AWS demand produces enough operating cash to reverse the current free-cash-flow decline. Retail, logistics and other projects also require capital, so management must allocate spending across multiple large businesses. A slowdown in AWS or a rapid decline in compute pricing could expose the company to high depreciation before the cash return is established.
Meta: Indirect Monetization and Governance
Meta’s investment return is harder to audit externally because much of it appears through engagement and advertising efficiency. The company also carries governance risk associated with concentrated voting control and a history of long-duration strategic spending. Strong ad growth gives Meta room to invest, but investors need evidence that AI capex improves incremental profit rather than simply increasing the cost of operating the platform.
Apple: Supply, Partner Dependence and Pricing Power
Apple must secure enough advanced components while avoiding excessive commitments at the top of a cycle. Its hybrid AI strategy reduces capital intensity but introduces dependence on model partners. Higher device prices or leasing can offset component costs only if customers continue upgrading. Services growth and control over the user interface remain central to defending margins.
Tesla: Timeline, Regulation and Core-Business Funding
Tesla’s AI opportunities are the least mature financially. Robotaxi and robotics require technological, regulatory and operational progress beyond current supervised products. The automotive business must remain healthy enough to fund the buildout. A sustained low operating margin would make the company more dependent on capital markets or on optimistic valuation assumptions.
Frequently Asked Questions
Why did Microsoft’s stock rise after it announced more AI spending?
Microsoft paired the spending with accelerated Azure growth, more than 30 million paid Microsoft 365 Copilot seats, strong operating cash flow and guidance for approximately 45% constant-currency Azure growth in the next quarter. The market saw evidence that new infrastructure was already supporting revenue and contracted demand.
Why did Alphabet fall even though Google Cloud grew 82%?
Alphabet raised its 2026 capex range to $195 billion to $205 billion and indicated another significant increase in 2027. Investors had to weigh exceptional cloud growth and margin expansion against a larger, longer investment cycle and pressure on free cash flow. The decline reflected the price of sustaining growth, not a conclusion that cloud demand was weak.
Did Alphabet report negative free cash flow?
The company said free cash flow would remain under pressure because of the infrastructure buildout. The official second-quarter materials reviewed for this article do not support using an unqualified statement that Alphabet’s quarterly free cash flow was negative. Period, definition and cash-flow components must be specified before making that claim.
Why did Amazon rally despite negative free cash flow?
AWS revenue grew 37%, its fastest rate in 18 quarters, and the segment remained highly profitable. Amazon said demand exceeded capacity, backlog expanded and much of future capacity was committed. Investors interpreted the negative cash flow as a consequence of filling visible demand, although the company still must restore cash conversion over time.
How is Meta’s AI investment different from Microsoft’s?
Microsoft can sell infrastructure and software directly through Azure and Copilot. Meta primarily uses AI to improve recommendations, advertising and future consumer products. Those benefits can be valuable, but they are harder to isolate in reported revenue. Meta’s 91% decline in quarterly free cash flow increased the demand for more precise evidence.
Is Apple an AI laggard?
Apple has moved more slowly in consumer generative AI than some competitors, but “laggard” oversimplifies its strategy. The company develops its own silicon and platform models, collaborates with Google on next-generation foundation models and integrates third-party models into development tools. Its main challenge is turning those partnerships into a differentiated experience while preserving control and margins.
Why did Apple’s stock fall after strong earnings?
The completed quarter was strong, but the September-quarter outlook was weaker than expected. Apple warned that shortages of advanced semiconductors, DRAM and NAND were limiting supply and likely to intensify. Investors also focused on services growth and the risk that higher prices could weaken demand.
Is Tesla now an AI company rather than an automaker?
Tesla is both an automaker and an investor in AI-driven businesses. Its current revenue, cash flow and physical operations still depend heavily on vehicles. FSD subscriptions, robotaxis and Optimus create potential additional value, but their future cash flows carry more technological and regulatory uncertainty than the automotive business.
What is the biggest financial risk of the AI data-center boom?
The largest risk is that companies build capacity whose long-term revenue and margins do not cover the complete cost of chips, buildings, power, networking, depreciation and replacement. Demand can remain strong while returns disappoint if prices fall, assets become obsolete quickly or customer economics prove weak.
What would prove that Big Tech’s AI spending is paying off?
Sustained cloud growth, high utilization, diversified backlog conversion, paid application adoption, stable or improving margins and free cash flow after the buildout would provide the strongest evidence. No single metric is sufficient. The return must persist through a complete investment and replacement cycle.
How much are the largest hyperscalers planning to spend in 2026?
Microsoft, Alphabet, Amazon and Meta have discussed 2026 or current-year capital programs that approach roughly $725 billion at the midpoint of available ranges and indications. The total is approximate because fiscal periods, lease accounting and capex definitions differ. It should be used as an order-of-magnitude measure rather than an exact apples-to-apples sum.
What should readers watch next?
The most useful next indicators are Azure and AWS growth, Google Cloud margin and backlog conversion, Meta’s free cash flow, Apple’s component availability and Tesla’s automotive margin. Rising depreciation and power constraints will also show whether the physical buildout is becoming more expensive than the first wave of revenue can support.
Final Assessment
The 2026 Big Tech earnings cycle did not end the AI investment debate. It made the debate more financially literate. The market no longer treats capital expenditure as proof of leadership by itself, nor does it reject spending simply because free cash flow falls in a particular quarter. It asks what the assets will sell, who has committed to use them, how quickly revenue will arrive and whether the complete economics remain attractive after depreciation and replacement.
Microsoft provided the strongest immediate answer. Azure acceleration, paid Copilot adoption, diversified commercial growth and positive free cash flow made the company the benchmark for enterprise AI monetization. Amazon followed with AWS growth at a four-year high, a large backlog and a direct explanation for why capacity was being built. Alphabet showed perhaps the strongest cloud operating momentum of all, but it also revealed that the required investment had risen faster than the market expected.
Meta’s quarter proved that AI can strengthen an existing advertising business while still creating a cash-flow problem. Apple showed that the AI boom has become a hardware and supply-chain event whose costs reach companies outside the public-cloud race. Tesla showed the valuation difficulty of funding long-dated autonomy and robotics opportunities from a core business with thin current margins.
The strongest supporting interpretation is that enterprise AI has entered real commercial deployment. Revenue, paid seats, contracts and backlog support that conclusion. The strongest credible concern is that the industry has not completed a full capital cycle. Much of the depreciation, replacement spending and customer-renewal evidence lies ahead. Today’s capacity scarcity can become tomorrow’s excess if demand, pricing or technology changes.
The companies most likely to retain investor confidence will not necessarily be those with the largest models or the highest capex. They will be those that connect technical capability to paid demand, allocate scarce capital with discipline and disclose enough evidence for outsiders to test the return. The AI era is becoming an ROI era, but the final return will be measured in cash—not demonstrations, parameter counts or spending announcements.
Sources
- Microsoft fiscal 2026 fourth-quarter earnings release and webcast materials
- Microsoft fiscal 2026 fourth-quarter earnings call
- Alphabet second-quarter 2026 earnings call and results materials
- Amazon second-quarter 2026 results
- Amazon second-quarter earnings exhibit filed with the SEC
- Meta second-quarter 2026 results
- Apple fiscal third-quarter 2026 results
- Apple Form 10-Q for the quarter ended June 27, 2026
- Apple announcement of the Tim Cook and John Ternus leadership transition
- Apple Upgrade U.S. leasing-program announcement
- Apple developer announcement on foundation models and AI tools
- Tesla second-quarter 2026 financial update
- Tesla announcement of second-quarter 2026 financial results
- Synergy Research Group analysis of first-quarter 2026 cloud infrastructure spending
- International Energy Agency analysis of data-center and AI electricity demand
- Reuters report on Microsoft earnings and the market reaction
- Reuters report on Alphabet’s cloud growth, capex and market reaction
- Reuters report on Amazon, AWS and the 2026 investment plan
- Reuters report on Meta’s free cash flow and AI infrastructure spending
- Reuters report on Apple’s fiscal third-quarter results and outlook
- Reuters report on Apple’s share decline and component constraints
- Reuters report on Tesla’s second-quarter cash flow, capex and market reaction
- Reuters market report following Amazon and Apple earnings
This article is provided for general informational purposes and does not constitute financial, investment, tax, or legal advice.
Affiliate disclosure: Businessfinance.news may earn compensation from qualifying actions completed through selected links on this website, at no additional cost to the reader. Affiliate relationships do not influence our editorial reporting, analysis, or conclusions.