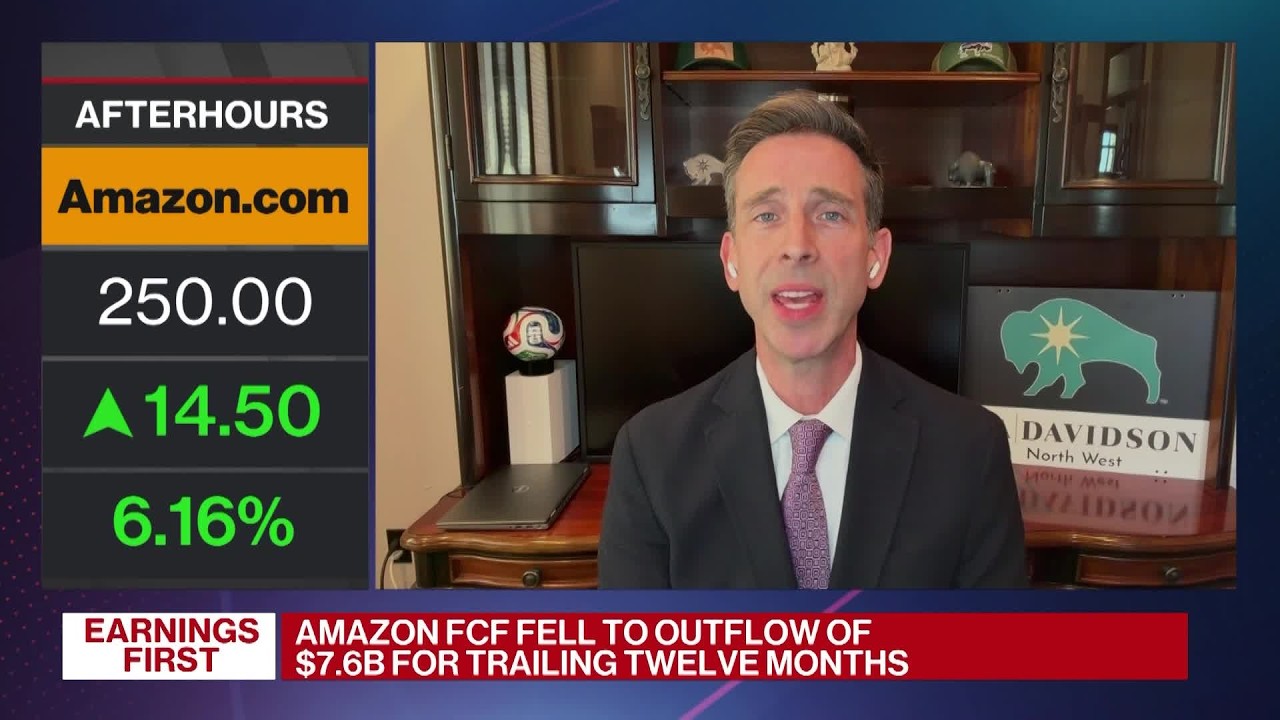
Amazon’s second-quarter 2026 earnings delivered the result investors had been waiting for: a clear acceleration in Amazon Web Services at the same time the company is committing unprecedented sums to artificial-intelligence infrastructure. Net sales rose 20% year over year to $200.6 billion, operating income increased 43% to $27.5 billion, and AWS revenue jumped 37% to $42.2 billion—its fastest growth in 18 quarters. Amazon shares, which had already gained 3.9% during regular Nasdaq trading on July 30, rose roughly another 9% after the report.
The headline is not simply that Amazon beat Wall Street expectations. The more important development is that the company produced evidence that its capital-intensive AI strategy is translating into faster cloud growth, a much larger contract backlog, and strong operating profit. That evidence gave investors a reason to tolerate a second, less comfortable set of numbers: trailing-12-month free cash flow fell to an outflow of $7.6 billion, quarterly purchases of property and equipment reached $54.2 billion, and management raised its expected 2026 capital spending to approximately $220 billion.
Those figures define the central question around Amazon now. AWS is growing fast enough to justify more capacity, but the cost of building that capacity is consuming cash before the resulting revenue appears. The quarter strengthened the argument that Amazon is investing into genuine demand rather than constructing speculative infrastructure. It did not eliminate the risk that the company could overbuild, face lower returns as competition intensifies, or discover that the economics of generative AI are less durable than current backlogs imply.
Last updated: July 31, 2026, 3:40 a.m. EDT. Market prices and postmarket moves are identified by trading session and date.
Key Takeaways
- Revenue: Amazon reported second-quarter net sales of $200.6 billion, up 20% from $167.7 billion a year earlier.
- Operating profit: Operating income rose to $27.5 billion from $19.2 billion, producing a consolidated operating margin of 13.7%.
- AWS: Cloud revenue increased 37% to $42.2 billion, while AWS operating income rose 64% to $16.6 billion.
- AI spending: Management increased its expected 2026 capital expenditures to about $220 billion, up from an earlier $200 billion plan.
- Cash-flow pressure: Trailing-12-month free cash flow swung from a positive $18.2 billion a year ago to a negative $7.6 billion.
- Net-income caveat: Reported net income of $62.6 billion included $53.4 billion of pre-tax non-operating income, primarily related to Amazon’s Anthropic investments.
- Market reaction: Amazon closed at $235.50 on July 30, up 3.9% in regular trading, and then gained roughly 9% after hours.
- What matters next: Investors will watch whether AWS can sustain growth near current levels, whether the $496 billion contract backlog converts into revenue at attractive margins, and whether free cash flow begins recovering as new data-center capacity comes online.
Fact Box
Amazon Q2 2026 at a Glance
- Reporting period ended June 30, 2026.
- Total net sales: $200.6 billion.
- Operating income: $27.5 billion.
- AWS sales: $42.2 billion.
- Net income: $62.6 billion, including a large non-operating Anthropic-related gain.
- Third-quarter revenue guidance: $197 billion to $202 billion.
Original source: Amazon’s second-quarter 2026 earnings release filed with the SEC
What Happened in Amazon’s Second Quarter
Amazon’s report combined broad-based revenue growth with an unusually large jump in cloud performance. North America segment sales rose 16% to $116.2 billion. International segment sales increased 15% to $42.2 billion. AWS sales also reached $42.2 billion, but its 37% year-over-year growth was far faster than either retail-oriented segment and represented a sharp acceleration from 28% in the first quarter.
The company’s service businesses are becoming increasingly important to the revenue mix. Net service sales—covering AWS, third-party seller services, advertising, subscriptions, and other service categories—rose to $123.0 billion from $99.5 billion a year earlier. Product sales increased to $77.6 billion from $68.2 billion. Services therefore accounted for approximately 61% of quarterly revenue, compared with about 59% in the year-earlier period. That shift matters because many service categories carry better economics than Amazon’s first-party retail sales.
Operating income rose by $8.3 billion year over year. AWS generated $16.6 billion, North America contributed $9.1 billion, and International added $1.7 billion. AWS represented about 61% of consolidated operating income despite accounting for 21% of net sales. The cloud division’s profitability remains the financial foundation that allows Amazon to invest simultaneously in retail logistics, artificial intelligence, custom chips, advertising technology, streaming content, pharmacy, robotics, and satellite communications.
Amazon’s consolidated operating margin reached 13.7%, up from 11.4% a year earlier. The margin improvement was not driven by a single accounting item. It reflected stronger AWS profitability, higher sales in advertising and third-party seller services, and operating leverage in the broader business. The result also showed that Amazon can expand operating profit while spending aggressively, although the cash-flow statement tells a more demanding story than the income statement.
| Metric | Q2 2026 | Q2 2025 | Year-over-year change |
|---|---|---|---|
| Total net sales | $200.6 billion | $167.7 billion | 20% |
| Operating income | $27.5 billion | $19.2 billion | 43% |
| AWS sales | $42.2 billion | $30.9 billion | 37% |
| AWS operating income | $16.6 billion | $10.2 billion | 64% |
| North America sales | $116.2 billion | $100.1 billion | 16% |
| International sales | $42.2 billion | $36.8 billion | 15% |
| Net income | $62.6 billion | $18.2 billion | 245% |
Source: Amazon’s unaudited second-quarter 2026 results. Dollar figures are U.S. dollars. Net income includes material non-operating investment gains and should not be compared with operating income as though both measures reflect the same earnings quality.
Why the Market Focused on AWS Rather Than the Revenue Beat
Amazon’s total revenue beat was meaningful, but it was not the principal reason for the after-hours rally. The decisive figure was AWS growth. Before the report, investors were evaluating Amazon against unusually strong cloud results from Microsoft and Alphabet. Microsoft disclosed that Azure surpassed $100 billion in annual revenue and grew 41% in its fiscal year ended June 30. Alphabet reported an 82% increase in Google Cloud revenue to $24.8 billion for its second quarter, helped by enterprise AI demand and initial revenue from selling TPU systems to customers.
That competitive backdrop raised the threshold for what investors would consider a satisfactory AWS quarter. A result near the low-30% consensus growth estimate might have looked respectable in isolation but weak relative to the acceleration at rival platforms. Amazon instead reported 36.7% AWS growth, comfortably clearing the published consensus and demonstrating that the largest cloud infrastructure provider was participating fully in the AI-driven expansion.
The sequence is important. AWS revenue growth was 17% in the first quarter of 2025, 17% in the second quarter, 20% in the third, 24% in the fourth, 28% in the first quarter of 2026, and 37% in the latest period. That is not a one-quarter recovery from an easy comparison. It is a six-quarter acceleration, with the latest step substantially larger than the earlier increases.
Strong growth also arrived with a 39.4% AWS operating margin, compared with 32.9% a year earlier and 37.7% in the preceding quarter. AWS operating income rose 64%, considerably faster than revenue. That combination—faster growth and higher margin—is powerful because it suggests that demand is not being purchased through indiscriminate pricing or absorbed entirely by current infrastructure costs.
There is a qualification. AWS margins can move for reasons that do not persist indefinitely, including server useful-life estimates, changes in workload mix, pricing, utilization, custom-chip adoption, energy costs, and the timing of depreciation. New data centers and expensive accelerators will create higher depreciation as they enter service. A 39.4% quarterly margin should therefore not be treated as a permanent floor. It does, however, provide a substantial buffer against the costs that are likely to arrive as Amazon’s investment program expands.
AWS Growth Has Become the Main Evidence for Amazon’s AI Return
Management’s argument is that the company is constrained by demand, not searching for uses for excess capacity. According to reporting on the earnings call, AWS had approximately $496 billion of contracted backlog at the end of the quarter, up from $364 billion three months earlier. Amazon also said much of its 2027 compute capacity had already been reserved and that customers had reserved meaningful capacity into 2028.
Backlog is not the same as revenue, profit, or cash. It includes contractual commitments that may be fulfilled over multiple years. Customer usage patterns can change, contract terms can differ, and large agreements may carry lower initial margins than smaller on-demand workloads. Nevertheless, a $132 billion sequential increase provides evidence that customers are making long-duration commitments at a pace that exceeds Amazon’s current revenue recognition.
The contrast between backlog and reported revenue helps explain the company’s capital cycle. Amazon may sign a multi-year cloud agreement today, begin buying land, power equipment, networking hardware, servers, and chips, and recognize the associated revenue only as services are delivered. Cash can leave the business well before a customer’s usage appears on the income statement. That timing gap is particularly severe during periods when capacity is being built quickly.
Amazon’s AI business and its custom-chip business each exceeded a $25 billion annualized revenue run rate, according to the company. A run rate is a snapshot extrapolation, not a full-year audited result, and the categories may not map neatly onto separately reported segments. The figures are still notable because they indicate that AI-related revenue is no longer a small experimental layer within AWS. It has become large enough to influence the economics of the entire cloud division.
The custom-chip figure is strategically important. Amazon’s Trainium accelerators and Graviton processors give the company alternatives to relying exclusively on external semiconductor suppliers. Custom silicon can improve price-performance, reduce some supply dependence, and allow Amazon to optimize hardware and cloud software together. It does not remove the need for Nvidia GPUs or other third-party components, but it gives AWS another way to allocate scarce capacity and compete on cost.
Amazon reported that Graviton5 had entered general availability, with claimed performance improvements over the previous generation, and said commitments to Graviton had increased sharply. It also highlighted multi-year Trainium commitments from Anthropic and OpenAI. Those relationships matter because frontier-model developers consume exceptionally large amounts of compute and can anchor entire data-center campuses. They also create concentration risk: a relatively small number of AI laboratories may account for a large share of incremental infrastructure demand.
Fact Box
The AWS Acceleration
- Q1 2025 AWS growth: 17%.
- Q2 2025: 17%.
- Q3 2025: 20%.
- Q4 2025: 24%.
- Q1 2026: 28%.
- Q2 2026: 37%.
- Q2 2026 AWS operating margin: 39.4%.
Original source: Amazon Q2 2026 financial tables
The $220 Billion Capital-Spending Plan
Amazon’s decision to lift expected 2026 capital expenditures from approximately $200 billion to $220 billion is the most consequential part of the report after AWS growth. The increase is larger than the annual capital budgets of most public companies. It represents spending on data centers, servers, networking equipment, chips, fulfillment infrastructure, and other long-lived assets, although management has made clear that artificial intelligence and AWS account for the dominant share of the increase.
To understand the scale, Amazon spent $128.3 billion in cash capital expenditures during 2025, according to its annual report. The new 2026 expectation is roughly 71% higher. During the first six months of 2026, purchases of property and equipment totaled $98.4 billion, compared with $57.2 billion in the first half of 2025. The second quarter alone accounted for $54.2 billion of property and equipment purchases.
Management attributed part of the higher plan to rising memory-chip costs. That explanation matters because it implies the increase is not entirely a decision to build more capacity; some of it reflects a higher price for the same broad infrastructure program. Memory is a material component of AI servers, and tight supply can raise the capital required to deploy each unit of compute. If component costs remain elevated, Amazon may need stronger pricing, higher utilization, or more efficient custom chips to protect returns.
The company’s case rests on long asset lives and comparatively short payback periods for some server investments. Andy Jassy said on the earnings call that Amazon begins spending on certain data-center projects roughly two years before they open. Once operating, a data-center facility can produce revenue for decades, while AI servers may recover their cost in less than three years and continue generating economic value for several additional years.
That framework is plausible, but it contains several assumptions. A server can remain technically functional while becoming economically obsolete. New generations of accelerators can deliver much better performance per dollar and per watt, which may reduce demand for older equipment or require price cuts. Workloads may migrate between chip architectures. Energy availability can delay utilization. Customers may negotiate lower rates as their commitments grow. A nominal three-year payback estimate therefore does not guarantee an attractive return after financing costs, depreciation, maintenance, power, and future replacement spending.
There is also an important difference between a data-center shell and the computing equipment installed inside it. Buildings, land improvements, power connections, and network infrastructure can support multiple generations of hardware. Accelerators and servers have shorter economic lives. The mix between those categories influences both depreciation expense and the durability of the investment. Amazon does not disclose enough detail in the quarterly release to calculate a precise return on invested capital for AI infrastructure.
Investors nevertheless received two pieces of evidence that make the spending easier to defend. First, AWS growth accelerated before the full 2026 buildout was complete. Second, contract backlog expanded rapidly. The company is not asking the market to accept a purely theoretical demand forecast. It is showing current usage growth and contractual commitments that already exceed existing capacity.
Amazon Is Not Alone in Spending at This Scale
The broader technology industry is operating in the same direction. Alphabet raised its full-year 2026 capital-expenditure guidance to a range of $195 billion to $205 billion after reporting that Google Cloud revenue increased 82% to $24.8 billion. Microsoft recorded $41 billion of capital expenditures in its June quarter and expects fiscal 2027 spending to rise. Meta spent $31.1 billion in its second quarter and expects $130 billion to $145 billion for the full year.
These comparisons show that Amazon’s spending is extreme but not isolated. The major cloud and consumer-internet platforms are competing for the same scarce resources: advanced chips, memory, power, land, engineering talent, network equipment, and construction capacity. When all of them accelerate simultaneously, the cost curve can rise. The companies may be validating one another’s demand forecasts, but they may also be bidding up the price of inputs and creating an industry-wide risk of overcapacity.
The market’s reaction to each company has depended on whether revenue acceleration arrived alongside the spending. Microsoft’s strong cloud result and cash generation were rewarded. Meta’s shares fell after a quarter in which capital expenditures rose sharply and free cash flow dropped to $784 million. Amazon’s report landed on the favorable side of that divide because AWS growth, margin, and backlog were strong enough to outweigh the immediate cash-flow deterioration.
Free Cash Flow Turned Negative for a Reason That Cannot Be Ignored
Amazon’s operating cash flow remained robust. It increased 33% to $161.4 billion for the 12 months ended June 30, 2026. The problem is that capital spending increased even faster. Amazon defines free cash flow as operating cash flow minus purchases of property and equipment, net of proceeds from property sales and incentives. On that basis, free cash flow fell from a positive $18.2 billion in the prior-year period to a negative $7.6 billion.
The deterioration is not evidence that Amazon’s core operations stopped producing cash. It is evidence that the company chose to reinvest more than its operations generated under this free-cash-flow definition. That distinction is important, but it should not be used to dismiss the outflow. Capital expenditures are real cash commitments. Shareholders do not receive operating cash flow before the infrastructure required to sustain the business is funded.
For years, Amazon described long-term sustainable free-cash-flow growth as a central financial objective. The current investment cycle temporarily reverses that trajectory. The company is effectively asking investors to judge free cash flow over a multi-year horizon rather than quarter by quarter. That can be rational when investments have high expected returns, but it raises the burden of proof. Management must show that the assets produce revenue, margins, and cash at a rate sufficient to compensate for the spending and the time value of money.
Working capital also affects the cash-flow picture. In the second quarter, operating cash flow was supported by accounts payable and other operating liabilities, while receivables increased substantially. The balance sheet showed accounts receivable and other current assets rising to $88.1 billion from $67.7 billion at the end of 2025. Rapid cloud growth can increase receivables because enterprise customers are billed under contractual terms rather than paying immediately at the point of sale.
The capital program is visible across the balance sheet. Net property and equipment increased from $357.0 billion at December 31, 2025, to $446.0 billion at June 30, 2026. That is an $89.0 billion increase in six months after depreciation and other movements. Total assets exceeded $1.09 trillion, compared with $818.0 billion at year-end. Amazon has become not only a retailer and technology platform but one of the world’s largest owners and operators of physical digital infrastructure.
| Cash-flow and balance-sheet item | Latest figure | Comparison | Interpretation |
|---|---|---|---|
| Trailing-12-month operating cash flow | $161.4 billion | $121.1 billion a year earlier | Core cash generation remained strong. |
| Trailing-12-month free cash flow | Negative $7.6 billion | Positive $18.2 billion a year earlier | Capital spending exceeded operating cash generation under Amazon’s definition. |
| Q2 purchases of property and equipment | $54.2 billion | $32.2 billion in Q2 2025 | Shows the speed of the AI and infrastructure buildout. |
| Net property and equipment | $446.0 billion | $357.0 billion at year-end 2025 | The asset base is expanding rapidly. |
| Long-term debt | $128.9 billion | $65.6 billion at year-end 2025 | Amazon is using more external financing during the investment cycle. |
Debt Has Become a More Important Part of Amazon’s Financing
Amazon’s long-term debt nearly doubled during the first half of 2026, rising to $128.9 billion from $65.6 billion at the end of 2025. The cash-flow statement showed $67.0 billion of long-term debt proceeds during the six-month period. This is a material change for a company that historically funded much of its expansion through operating cash flow, working capital, leases, and retained earnings.
The increase does not mean Amazon faces an immediate liquidity problem. It ended June with $78.2 billion of cash and equivalents and $44.8 billion of marketable securities. Operating cash flow is substantial, and the company has broad access to capital markets. Its scale, recurring cloud revenue, retail cash conversion, and advertising business give creditors multiple sources of repayment.
Still, debt changes the economics of the AI buildout. Interest expense rose to $1.3 billion in the second quarter from $516 million a year earlier. Even for Amazon, the financing cost is no longer trivial. If rates remain elevated, new infrastructure must clear a higher hurdle than it would have during the low-rate period. Debt also reduces flexibility if the company later needs to respond to a recession, price competition, regulatory penalties, acquisitions, or a slower-than-expected AI demand curve.
The balance-sheet change should be analyzed together with the increase in asset values related to Anthropic. Amazon’s equity has expanded sharply because unrealized and realized gains on the investment boosted both net income and accumulated other comprehensive income. That accounting strength is not the same as liquid cash available to repay debt. Private-company securities can be valuable while remaining difficult to monetize without affecting strategic relationships or market prices.
A more conservative assessment therefore separates three facts. Amazon has ample liquidity. Amazon has increased leverage rapidly. And a significant portion of the apparent balance-sheet expansion comes from investments whose value depends on private-market pricing and future liquidity events. None of those statements alone defines the company’s financial position; together they describe a business with enormous resources that is also taking larger capital-allocation risks.
Amazon’s $62.6 Billion Net Income Requires an Accounting Adjustment
Reported net income more than tripled to $62.6 billion, or $5.75 per diluted share. Taken at face value, that number makes the quarter look far more profitable than Amazon’s operations alone would support. The company disclosed that net income included $53.4 billion of pre-tax non-operating income, primarily from its investments in Anthropic.
Amazon has invested in Anthropic through convertible notes and nonvoting preferred stock and also has a commercial relationship under which Anthropic uses AWS and Amazon’s chips. Accounting rules require certain changes in the value of those securities to be recognized in earnings or other comprehensive income when observable financing transactions or conversions provide new valuation evidence.
The gains are economically meaningful. They indicate that Amazon’s stake in Anthropic is worth considerably more on paper than its historical cash investment. They also strengthen reported equity and may give Amazon strategic influence in one of the leading AI developers. But they are not recurring operating revenue, and they do not represent cash generated by AWS, retail, advertising, or subscriptions during the quarter.
For evaluating the business, operating income is the cleaner starting point. Amazon produced $27.5 billion of operating profit before interest, investment gains, and taxes. That figure still represents strong performance: it increased 43%, with contributions from all three reported segments. The distinction prevents an investor from concluding that Amazon suddenly created more than $60 billion of quarterly profit from normal operations.
The Anthropic gain also introduces volatility. A future financing round at a higher valuation could produce another gain. A lower valuation, impairment, or unfavorable conversion could produce a loss or reduce other comprehensive income. Because private-company valuations rely on limited observable data, the reported amounts are inherently more uncertain than the price of a widely traded public security.
This does not make the accounting improper. It makes the composition of earnings essential. Amazon’s quarter contained two different stories: a genuinely strong operating result and a very large non-operating valuation gain. The operating result is more useful for assessing recurring business performance. The investment gain is more relevant to the value and risk of Amazon’s broader AI portfolio.
Fact Box
Why Net Income and Operating Income Differed So Much
- Operating income was $27.5 billion and reflects Amazon’s reported business segments.
- Net income was $62.6 billion after non-operating items and taxes.
- Amazon recorded $53.4 billion of pre-tax non-operating income, primarily related to Anthropic investments.
- The investment gain is real under accounting rules but is not equivalent to recurring operating cash flow.
Original source: Amazon’s 2025 Form 10-K discussion of Anthropic investment accounting
The Retail Business Was Stronger Than the AWS Headline Suggests
AWS deserved the attention it received, but Amazon’s stores and marketplace operations also improved. North America sales rose 16% to $116.2 billion, faster than the 11% growth recorded a year earlier. Segment operating income increased 21% to $9.1 billion. International sales grew 15% to $42.2 billion, while operating income rose to $1.7 billion from $1.5 billion.
The retail result benefited from several revenue streams that are often grouped together even though their economics differ. Online-store revenue increased 15% to $70.4 billion. Third-party seller services rose 16% to $46.8 billion. Physical-store sales increased only 4% to $5.8 billion. Subscription services, which include Prime memberships and non-AWS digital subscriptions, advanced 12% to $13.7 billion.
Third-party seller services are particularly valuable because Amazon earns commissions, fulfillment fees, shipping fees, and other service revenue without recording the full value of the merchant’s merchandise as Amazon revenue. The category therefore provides a more asset-efficient way to participate in commerce than buying inventory and reselling it. It also strengthens the marketplace by increasing selection, while giving Amazon more volume over which to spread fulfillment and delivery costs.
That model is not costless. Amazon must police counterfeit goods, unsafe products, manipulated reviews, seller fraud, and compliance with consumer-protection rules. It faces recurring tension with merchants over fees, advertising requirements, fulfillment policies, and account suspensions. Regulators also examine whether the company uses marketplace data or platform control in ways that disadvantage independent sellers. The financial appeal of third-party services comes with operational and legal obligations that grow with the marketplace.
Delivery Speed Is Becoming a Revenue Strategy, Not Merely a Cost
Amazon said that it delivered more than 40% additional items on the same day or overnight for Prime members during the first half of 2026. Faster delivery can raise costs when achieved by moving packages over long distances at premium speed. Amazon’s recent logistics strategy is designed to avoid that outcome by placing popular inventory closer to customers, regionalizing fulfillment, and using smaller facilities to shorten the final journey.
The economic argument is that convenience changes shopping behavior. When common household goods can arrive the same day, customers use Amazon for more frequent, lower-value purchases rather than reserving it for planned orders. Grocery and everyday essentials can produce thinner merchandise margins, but they increase purchasing frequency and create more opportunities to earn third-party seller fees and advertising revenue.
Amazon is also expanding an ultra-fast service called Amazon Now, which offers delivery in 30 minutes or less in selected markets. The company reported rapid sequential growth in customers, unit volume, and gross sales, though it did not disclose enough data to judge profitability. Quick commerce has historically been difficult because small baskets and labor-intensive delivery can overwhelm gross margin. Amazon’s existing customer base, fulfillment network, and Prime relationship provide advantages, but the service will still need dense demand and disciplined assortment to earn acceptable returns.
Retail efficiency is central to the investment case because AWS cannot be expected to subsidize every experiment indefinitely. The North America operating margin was approximately 7.9% in the quarter, compared with about 7.5% a year earlier. International margin was about 4.1%, compared with 4.1% in the prior-year quarter. Those are modest margins relative to AWS, but the scale of the segments means small changes can add billions of dollars to operating profit.
Prime Day Complicates the Third-Quarter Comparison
Amazon’s third-quarter revenue guidance of $197 billion to $202 billion implies growth of 9% to 12%. The high end was below the average analyst estimate cited during the initial market coverage. That would normally be a concern after a strong quarter. The calendar, however, makes the comparison less straightforward.
Prime Day occurred in the second quarter of both 2025 and 2026 under Amazon’s guidance assumptions, reducing third-quarter growth by shifting sales into the earlier period. Amazon said that excluding Prime Day from both years, third-quarter year-over-year growth would be nearly four percentage points higher. The company also expects foreign exchange to reduce reported growth by approximately 0.8 percentage points.
The guidance therefore should not be read as evidence that underlying demand will suddenly collapse from 20% growth to the low teens. Part of the deceleration is timing, and part is currency. Even after those adjustments, the third quarter will face tougher comparisons and a larger revenue base. Investors will need to examine the composition of growth rather than relying solely on the consolidated percentage.
Operating-income guidance is $22.5 billion to $26.5 billion, compared with $17.4 billion in the third quarter of 2025. The midpoint implies substantial year-over-year growth but a sequential decline from the second quarter. Seasonal mix, infrastructure costs, depreciation, content spending, and the timing of retail investments can all affect the quarter-to-quarter pattern.
Advertising Is Now One of Amazon’s Most Important Businesses
Advertising revenue rose 26% to $19.8 billion, making it Amazon’s fastest-growing separately disclosed revenue category after AWS. The business is already larger than subscription services and physical stores combined. On an annualized basis, the quarterly result approaches $80 billion, although seasonality means a simple multiplication should not be treated as a forecast.
Amazon’s advertising advantage comes from commercial intent. A user searching for a specific product on Amazon is often closer to a purchase than a user viewing a general social-media post or entering an informational search query. Sellers and brands can place sponsored products directly beside organic listings, measure clicks and conversions, and connect campaigns to transactions occurring on the same platform.
The company is extending that model beyond the shopping-results page. It sells display advertising, video placements, and ads on Prime Video and other properties. That expansion creates additional inventory and gives advertisers access to audiences across commerce and entertainment. It also changes the customer experience. More ads can improve monetization, but excessive commercial density can make search results less useful or blur the distinction between paid and organic recommendations.
Advertising improves the economics of retail because the same customer visit can produce several revenue streams. Amazon may earn a marketplace commission, fulfillment fees, subscription revenue through Prime, and advertising revenue from competing merchants seeking visibility. That layered model helps explain why retail margins can improve even when the company keeps consumer prices and delivery fees competitive.
The growth rate also compares favorably with much of the digital-advertising market. Alphabet reported 14% growth in total advertising revenue in its second quarter, while Meta reported 28% total revenue growth, driven primarily by advertising. Amazon occupies a distinct position: it is smaller than Google or Meta in total advertising, but its commerce data and purchase environment give it a powerful performance-marketing proposition.
There are risks. Privacy rules, platform regulation, and restrictions on data use can affect targeting and measurement. Brands may resist higher auction prices. Sellers can become dependent on paid placement to maintain visibility, inviting criticism that marketplace access has become more expensive. And Amazon must ensure that AI-generated shopping recommendations do not favor advertisers in ways that undermine consumer trust.
Amazon’s AI Strategy Extends Far Beyond Renting GPUs
AWS competes at several layers of the artificial-intelligence stack. At the infrastructure layer, it offers Nvidia accelerators, Amazon-designed Trainium chips, Graviton processors, storage, networking, databases, and specialized services. At the model layer, Amazon Bedrock provides access to foundation models from multiple developers. At the application and agent layer, AWS offers tools for building, deploying, monitoring, and securing AI systems.
This multi-layer strategy is intended to make AWS useful regardless of which model developer leads at a particular moment. Microsoft has a deep relationship with OpenAI and integrates its models throughout Azure and Microsoft software. Google develops Gemini and its own TPUs. Amazon’s approach places greater emphasis on model choice, combining its partnership with Anthropic, new commitments involving OpenAI, Amazon’s own models, and third-party offerings through Bedrock.
Model choice can be an advantage because enterprises are unlikely to standardize every workload on one model. A bank may use one model for coding, another for document analysis, and a smaller low-cost model for high-volume customer requests. Companies also want to switch models as performance, price, regulation, and data-governance requirements change. A platform that reduces switching friction can capture usage without needing to own the winning model in every category.
The trade-off is that Amazon may have less control over the most differentiated layer of the stack. If model providers capture most of the economics, the cloud platform can become a capital-intensive supplier competing on availability and price. Amazon’s investments in Anthropic and custom silicon are partly designed to avoid that outcome by aligning the company with model demand and creating proprietary infrastructure advantages.
Trainium Is Both a Cost Strategy and a Supply Strategy
Custom AI accelerators matter for two reasons. First, they can lower the cost of training and serving models when workloads are optimized for the hardware. Second, they reduce dependence on the supply of external accelerators. During a period of constrained capacity, having an additional chip architecture can allow AWS to serve customers who otherwise would have to wait.
Trainium does not need to replace Nvidia to be successful. It can serve selected workloads, provide leverage in supplier negotiations, and offer customers a lower-cost alternative. The economic test is whether utilization, software support, and customer adoption are strong enough to justify design and manufacturing commitments. Chips require a supporting ecosystem of compilers, libraries, networking, and developer tools. Superior theoretical performance is insufficient if customers face high migration costs.
Amazon’s claim that its chips business exceeded a $25 billion annualized run rate suggests meaningful adoption, but the lack of a separately reported revenue line limits independent analysis. The figure may include several chip families and associated services. Investors should treat it as a management indicator rather than a substitute for audited segment disclosure.
Bedrock’s Value Is in Governance and Distribution
Amazon Bedrock is designed to give enterprises access to multiple models through AWS while applying security, identity, data-governance, and monitoring controls. For large companies, those controls can matter as much as benchmark performance. A model may be technically impressive but unusable in a regulated environment if the customer cannot manage permissions, data retention, audit trails, and cost.
Amazon said that hundreds of thousands of customers use Bedrock and that customer additions and spending accelerated sharply. Those figures indicate broad experimentation, but they do not reveal average spending, retention, or how much usage comes from production workloads rather than tests. The next stage of AI monetization will depend on whether pilots become embedded applications with recurring consumption.
The company is also investing $1 billion in AWS Forward Deployed Engineering, a program that places engineers directly with customers to build and deploy AI solutions. This resembles the service-intensive approach used by enterprise software and data companies when products are powerful but difficult to implement. It can accelerate adoption and create deep customer relationships, but it can also make growth more labor-intensive if each deployment requires extensive custom work.
Early customers cited by Amazon include the Allen Institute, Cox Automotive, the NBA, the NFL, Ricoh, and Southwest Airlines. The range of organizations illustrates the breadth of potential use cases, from research and media to transportation and document workflows. It does not prove that every deployment will become a large, profitable contract.
AWS Versus Azure and Google Cloud
The cloud competition is often reduced to a market-share ranking, but the businesses are not perfectly comparable. AWS reports a standalone segment with revenue and operating income. Microsoft discloses Azure growth and annual revenue but combines other products in the Intelligent Cloud segment. Google Cloud includes Google Cloud Platform, Workspace, and related enterprise services, and its latest growth also included initial sales of TPU systems delivered to customer data centers.
Those differences mean that a single quarterly growth rate does not provide a complete ranking. Google Cloud’s 82% growth was extraordinary, but it came from a smaller base and included a newer hardware-revenue component. Azure’s annual revenue exceeded $100 billion and grew 41%, while AWS’s quarterly annualized run rate reached roughly $169 billion. AWS remains larger, but the gap is no longer a reason to ignore faster-growing rivals.
| Cloud business | Latest disclosed growth | Latest scale indicator | Important comparability issue |
|---|---|---|---|
| Amazon Web Services | 37% year over year in Q2 2026 | $42.2 billion quarterly revenue; $169 billion annualized run rate | Standalone cloud segment with separately disclosed operating income. |
| Microsoft Azure | 41% annual growth in fiscal 2026 | More than $100 billion annual revenue | Microsoft does not report Azure as a fully separate operating segment. |
| Google Cloud | 82% year over year in Q2 2026 | $24.8 billion quarterly revenue | Includes Workspace and initial TPU system sales as well as GCP services. |
The most important competitive question is not whether AWS loses a percentage point of estimated market share in a given quarter. It is whether Amazon can maintain high growth and margins while customers adopt multiple clouds, rivals subsidize capacity, and frontier-model companies negotiate enormous contracts. A growing market can support several winners, but the capital requirements make pricing discipline essential.
Backlog comparisons also require care. Amazon reported approximately $496 billion in AWS commitments, while Alphabet disclosed a $514 billion Google Cloud backlog. The definitions, customer mix, revenue-recognition schedules, and inclusion of hardware commitments differ. The figures demonstrate strong demand at both companies; they do not establish that Google has overtaken AWS in an economically equivalent measure.
Microsoft, Alphabet, and Amazon all say that demand exceeds available supply. That shared message supports the view that AI infrastructure is constrained rather than overbuilt today. It also means each company’s growth may be limited by how quickly it can secure power and deploy hardware. Competitive success during the next several years may depend as much on construction, energy procurement, and supply-chain execution as on software features.
What Amazon’s $496 Billion AWS Backlog Really Tells Investors
Amazon’s AWS backlog reached approximately $496 billion at the end of the second quarter, up from $364 billion three months earlier. The increase was one of the strongest pieces of evidence that the acceleration in cloud revenue was not confined to a few weeks of unusually heavy usage. Customers have made commitments extending over multiple years, and the backlog provides Amazon with visibility into future demand that a consumption-only business would not otherwise have.
Backlog is not the same as revenue. It generally represents contracted amounts that have not yet been recognized because the services will be delivered in future periods. Some commitments may be subject to usage patterns, implementation milestones, contract modifications, or termination provisions. Revenue recognition can also take many years, particularly when contracts involve large enterprises, governments, or AI developers reserving capacity well in advance.
That distinction is important because the backlog grew much faster than quarterly AWS sales. The sharp increase does not mean Amazon will recognize $132 billion of additional revenue next quarter. It means that the company signed or expanded commitments whose economic benefit will be distributed over a longer period. The backlog therefore supports the durability of demand, but it does not remove timing risk.
Amazon disclosed in its first-quarter filing that the weighted-average remaining life of AWS contracts included in backlog was approximately 5.5 years. Applying that average mechanically would be misleading because the mix can change sharply from one quarter to the next, but it illustrates the long duration involved. A contract signed in 2026 may contribute revenue through the end of the decade and beyond.
Long-duration commitments are valuable when prices and infrastructure costs remain favorable. They can be less attractive if Amazon promises capacity or pricing that later proves uneconomic. The company must estimate future chip efficiency, electricity costs, maintenance, network expense, software support, and customer usage before agreeing to large contracts. A backlog can therefore be a source of earnings visibility and a source of execution risk.
The composition also matters. A backlog spread among thousands of established enterprises is generally more resilient than one concentrated in a few rapidly growing AI laboratories whose funding needs and computing requirements are unusually large. Amazon does not disclose enough detail to calculate customer concentration within the figure. Its public disclosures show broad enterprise adoption, but the scale of frontier-model training means that a small number of customers can influence incremental demand.
The most defensible interpretation is that the backlog materially reduces concern about near-term demand. Customers are willing to make very large commitments even before all required capacity is available. The more cautious interpretation is that investors still need evidence about contract economics, concentration, conversion speed, and the amount of capital Amazon must deploy before those commitments produce cash.
Fact Box
How to Read AWS Backlog
- Backlog represents future contracted business, not revenue already earned.
- AWS backlog increased from approximately $364 billion at March 31 to about $496 billion at June 30.
- The first-quarter filing reported a weighted-average remaining contract life of about 5.5 years.
- The measure improves visibility but does not disclose customer concentration, future margins, or the exact quarterly recognition schedule.
Original source: Amazon’s first-quarter 2026 Form 10-Q
The Economics of AI Infrastructure Depend on Utilization
The return on Amazon’s AI spending will not be determined by the number of data centers it opens. It will be determined by how intensively customers use the equipment, how much they pay, how quickly hardware becomes obsolete, and how effectively Amazon controls operating costs. Data-center capacity is productive only when it supports billable workloads at prices that exceed depreciation, electricity, cooling, networking, support, and financing expense.
Utilization is central because many costs are fixed or committed. Amazon must secure land, power, buildings, networking equipment, and servers before demand is fully visible. Once the infrastructure is installed, a lightly used facility still incurs depreciation and operating expense. Higher utilization spreads those costs across more billable computing activity and improves returns.
AI workloads complicate the calculation. Training a frontier model can require a concentrated burst of enormous computing power, while inference—the process of using a trained model to answer questions or perform tasks—may create steadier recurring demand. Training is highly visible because individual projects can involve large clusters and large contracts. Inference may ultimately be more important to cloud economics because every application request can generate consumption repeatedly.
Amazon’s strongest long-term case therefore depends on AI becoming part of ordinary business activity. Customer-service systems, coding tools, search, advertising, logistics, document processing, fraud detection, medical research, and industrial operations would need to generate persistent workloads. One-off training projects can fill capacity, but recurring inference supports a more durable revenue stream.
Hardware life is another variable. Traditional servers can remain useful for several years, but AI accelerators improve rapidly. New chips can deliver more performance per dollar and per watt, making older equipment less competitive before it is physically worn out. If customers migrate quickly to newer generations, Amazon may need to replace or repurpose hardware sooner than its original economic assumptions contemplated.
Management has argued that AI servers can recover their cost in less than three years and then remain profitable for another two to three years. That claim provides a useful framework rather than a guarantee. It depends on utilization, pricing, maintenance, chip availability, and the workload mix. A server operating near capacity for a high-value customer can earn an attractive return. The same equipment can disappoint if demand shifts or price competition intensifies.
Facilities have a longer life than servers. Buildings, electrical systems, network connections, and power agreements can support successive hardware generations. This gives Amazon options: a data-center shell constructed for one class of accelerator may continue generating revenue after the original chips are replaced. The risk is that location-specific constraints—power availability, network latency, environmental rules, or customer needs—could reduce the usefulness of a facility.
Power Is Becoming a Strategic Input
AI infrastructure converts electricity into computing output at unprecedented scale. The ability to obtain reliable power has become a constraint on expansion, particularly in regions where utilities face transmission bottlenecks or lengthy permitting processes. Amazon can order servers faster than it can always connect a new campus to the grid.
Power procurement affects both growth and margins. Long-term contracts can provide price stability, but they can also lock the company into commitments if demand changes. Renewable-energy agreements, nuclear projects, grid investments, and backup generation can improve reliability or emissions performance, yet each comes with capital, regulatory, and execution requirements.
The issue extends beyond electricity cost. Water for cooling, local land use, construction labor, transmission infrastructure, and community acceptance can delay projects. A customer may sign a cloud agreement before the associated capacity is ready, creating a period in which demand exists but revenue cannot be fully recognized. That is one reason Amazon’s claim that demand exceeds capacity can be both encouraging and frustrating.
Custom Chips Are a Margin Strategy
Amazon’s Trainium chips are designed to reduce dependence on external accelerator suppliers and lower the cost of AI computation. The company said its chip business exceeded a $25 billion annualized revenue run rate, indicating that custom silicon is no longer a small experiment. The financial significance lies less in chip revenue as a standalone category than in the potential effect on AWS pricing and gross profit.
When Amazon uses its own chips, it can influence hardware design, software integration, supply planning, and the economics of the full cloud service. It may avoid part of the margin paid to a third-party chip vendor and differentiate AWS through performance or availability. Customers benefit only if the software ecosystem, developer tools, reliability, and total cost are competitive.
Custom silicon also creates switching costs. Applications optimized for one chip architecture may require work to move elsewhere. That can improve customer retention for Amazon, but it can discourage adoption if businesses fear being locked into a narrower ecosystem. AWS must balance differentiation with compatibility.
The strategy will be judged over several generations. A successful chip program requires continuous investment because rivals and specialist manufacturers improve rapidly. Amazon must persuade customers that its hardware roadmap will remain credible, not merely that one generation offers an attractive discount.
Why Amazon Says Demand Still Exceeds Capacity
Andy Jassy said that Amazon expected AWS demand to remain greater than available capacity through 2026 and probably into 2027. The company also indicated that much of the compute capacity planned for 2027 had already been reserved and that some customers were committing into 2028. Those statements explain why management is willing to raise spending despite the negative free-cash-flow result.
Capacity shortages can make current growth understate demand. A customer cannot consume a service that Amazon is unable to deliver. When new facilities come online, revenue can accelerate even without a fresh change in customer interest because previously constrained demand becomes serviceable.
That interpretation is favorable, but the operational challenge is demanding. Amazon begins spending on a data center well before it opens. Land, construction, substations, networking, and hardware create cash outflows months or years before utilization reaches mature levels. The income statement recognizes depreciation over time, while the cash-flow statement records the investment earlier. That timing difference is why operating income can rise while free cash flow deteriorates.
Investors must also distinguish genuine scarcity from self-imposed allocation. Cloud companies decide which customers, workloads, geographies, and products receive available capacity. A shortage in one accelerator type or region does not mean every data center is full. Management’s ability to move workloads, optimize software, and substitute chips influences how much revenue can be extracted from the installed base.
Demand exceeding capacity is preferable to unused infrastructure, but it is not a permanent competitive advantage. Microsoft and Alphabet are also spending at extraordinary levels and report supply constraints. Semiconductor producers are expanding output. Utilities and developers are responding to the demand for data centers. Over time, industry capacity can catch up, and pricing may become more competitive.
The July 30 Market Reaction Was Powerful but Narrow
Amazon’s earnings arrived after a technology-led rally in regular U.S. trading. The S&P 500 rose 1.66%, the Nasdaq Composite advanced 2.78%, and the Dow Jones Industrial Average gained 1.19% on July 30. Microsoft jumped more than 15% after its own earnings report, while semiconductor shares rallied broadly. Amazon closed at $235.50, up 3.9%, before releasing its results.
The indexes gave the appearance of broad strength, but the underlying session was more concentrated. More than 300 members of the S&P 500 declined even as the index rose, according to the Bloomberg market-close discussion. Large technology companies and chipmakers carried much of the gain. Meta moved in the opposite direction, falling about 8% as investors questioned whether its spending was producing returns quickly enough.
That contrast shaped the reaction to Amazon. The market had just rewarded Microsoft for showing strong cloud growth and punished Meta despite robust revenue because the profitability and timing of AI investments remained contentious. Amazon then reported both rapid AWS growth and a larger spending plan. The after-hours rally suggests that the cloud result outweighed concerns about cash flow and guidance in the initial assessment.
After-hours prices are informative but provisional. Trading volume is usually thinner than during regular hours, bid-ask spreads can be wider, and the price may change after analysts question management on the earnings call. A postmarket gain should therefore be identified as a separate session rather than treated as the following day’s closing return.
The move also cannot be attributed to one number with certainty. Investors reacted to AWS growth, operating margins, backlog, advertising, guidance, capital spending, and the broader technology rally simultaneously. The most reasonable inference is that AWS provided the decisive positive surprise because it addressed the market’s central concern: whether Amazon’s AI expenditure was producing visible revenue acceleration.
Why Meta’s Decline Was Relevant to Amazon
Meta’s second-quarter revenue grew 28%, but operating income declined and capital spending reached $31.1 billion. The company projected full-year capital expenditures of $130 billion to $145 billion. Its shares fell sharply, showing that revenue growth alone did not guarantee investor approval when spending rose and operating leverage weakened.
Amazon’s profile was different. AWS operating income increased 64%, and its margin expanded to 39.4%. The company could point to a large backlog and constrained customer demand. Those figures made the investment cycle easier to defend, even though Amazon’s absolute spending plan was larger.
The comparison should not be pushed too far. Meta invests primarily to improve its advertising products, recommendation systems, consumer applications, and long-term AI capabilities. Amazon sells infrastructure directly through AWS while also using AI internally. The path from capital spending to revenue is more explicit for a cloud provider, but Amazon also faces direct price competition and the burden of serving external customers under contractual service levels.
The Strongest Case for Amazon’s AI Strategy
The favorable case begins with demand. AWS revenue growth accelerated from 28% in the first quarter to 37% in the second, and backlog increased by approximately $132 billion in three months. Amazon says customers have reserved much of the capacity it will deploy through 2027. Those are stronger signals than management enthusiasm alone.
The second argument is operating leverage. AWS operating income rose faster than revenue, and its margin reached 39.4%. If the business were winning growth only by cutting prices or adding uneconomic capacity, margins would be more likely to contract. The result suggests that existing infrastructure is being used efficiently and that demand is supporting attractive pricing.
The third argument is Amazon’s position across the AI stack. It offers data centers, networking, storage, databases, model-development tools, managed access to third-party models, custom chips, and consulting support. Customers can use AWS for basic infrastructure or for a more integrated platform. That breadth gives Amazon multiple ways to earn revenue from the same customer.
The fourth argument is the installed customer base. Enterprises already store data and run applications on AWS. Moving large datasets is expensive and technically difficult. When an existing customer adopts AI, Amazon can sell additional computation, storage, security, databases, and software without needing to win the entire account from a rival. The cloud relationship creates a distribution advantage.
The fifth argument is financial capacity. Even after the collapse in free cash flow, Amazon generated $161.4 billion of trailing operating cash flow and held more than $122 billion of cash and marketable securities. It can finance projects that would be impossible for most competitors. Scale also improves its bargaining power in hardware procurement, construction, and energy contracts.
Finally, AI can improve businesses outside AWS. Better recommendations can raise retail conversion. Automation can reduce fulfillment expense. Advertising models can improve targeting and creative tools. Customer-service systems can lower support costs. The benefits of infrastructure investment therefore may not be confined to externally reported cloud revenue.
The Strongest Skeptical Case
The skeptical case begins with capital intensity. Amazon plans to spend approximately $220 billion in one year, an amount larger than the annual revenue of most public companies. The cash outflow is immediate, while the economic return depends on future demand, pricing, utilization, and asset life. Small errors in those assumptions can translate into tens of billions of dollars.
Second, the current AI market is unusually concentrated. Frontier-model developers and a limited number of large technology companies account for a meaningful share of the most computationally intensive workloads. If one major customer changes provider, develops its own infrastructure, fails to raise capital, or reduces training intensity, the effect on incremental demand could be substantial.
Third, competition is also investing at historic levels. Microsoft, Alphabet, and specialized providers are adding capacity. Customers frequently pursue multi-cloud strategies, and sophisticated buyers can negotiate discounts by shifting workloads. The fact that demand exceeds supply today does not prove that pricing will remain favorable after new capacity arrives.
Fourth, technology can become more efficient. Better chips, model architectures, compression, quantization, and software optimization may reduce the computing required for a given task. Efficiency often expands demand by lowering costs, but it can also make existing hardware less valuable or reduce revenue per workload. Amazon must benefit from rising usage faster than unit computing costs decline.
Fifth, the earnings headline is flattered by the Anthropic valuation gain. The operating result was strong without it, but reported net income and earnings per share can create a misleading impression of recurring profitability. If private-market valuations reverse, future quarters could include large losses.
Sixth, financing has changed. Long-term debt rose sharply, and interest expense increased. Amazon can carry the debt, but the company is no longer relying solely on internal cash generation. Higher leverage makes the timing of returns more consequential.
Seventh, environmental and infrastructure constraints can delay deployment. A signed customer contract is not immediately useful if power connections, permits, chips, or construction are unavailable. Delays can increase costs and postpone revenue without necessarily reducing committed spending.
The skeptical case does not require believing that AI demand will disappear. It requires believing that the market may be overestimating the profitability, speed, or durability of that demand. Amazon’s quarter weakened the argument that spending has no commercial return. It did not settle what the long-run return will be.
Risks That Matter Most After the Quarter
Execution Risk
Amazon must coordinate construction, power, chips, networking, software, security, and customer implementation across many regions. A failure in one part of the chain can delay the entire project. Rapid expansion also creates hiring, quality-control, and operational risks that are less visible than quarterly revenue.
Pricing and Competitive Risk
Cloud services become more commoditized when competing providers offer similar models and accelerators. Amazon can defend margins through custom chips, proprietary software, reliability, and ecosystem depth, but customers will compare total cost. Price reductions can stimulate usage while reducing revenue per unit of computation.
Customer-Concentration Risk
Amazon serves millions of customers, yet the largest AI commitments may come from a much smaller group. The company does not provide enough information to quantify the concentration of its backlog. Investors should not assume that a large total automatically means evenly distributed demand.
Technology-Obsolescence Risk
AI hardware improves quickly. If older accelerators become uneconomic sooner than expected, Amazon may record lower returns, accelerate depreciation, or replace equipment ahead of schedule. Custom chips reduce dependence on suppliers but add the risk that Amazon’s own designs underperform.
Power, Water, and Permitting Risk
Data centers require large and reliable electricity supplies, cooling, land, and network access. Local opposition, grid delays, environmental requirements, or resource constraints can raise costs. These issues are not peripheral to growth; they determine when capacity becomes available.
Cybersecurity and Service Reliability
AWS supports critical systems for corporations and governments. Outages, cyberattacks, software vulnerabilities, or data-loss events can create financial liability and damage trust. As AI services become more integrated into customer operations, the consequences of failure can grow.
Regulatory Risk
Amazon operates under competition, privacy, consumer-protection, labor, tax, and content rules across many jurisdictions. Cloud and AI regulation may add requirements related to data location, security, model safety, procurement, and environmental disclosure. Compliance can increase cost or limit how services are offered.
Retail and Macroeconomic Risk
Although AWS dominates the investment debate, most Amazon revenue still comes from commerce and related services. A slowdown in consumer spending, trade restrictions, currency movements, transportation costs, or seller stress can affect the broader company. The third-quarter guidance also included a foreign-exchange headwind and a difficult comparison because Prime Day shifted between reporting periods.
Amazon’s Capital-Spending Curve Has Steepened Dramatically
The $220 billion plan is easier to understand when placed beside Amazon’s recent investment history. Cash capital expenditures were approximately $77.7 billion in 2024 and $128.3 billion in 2025. The 2026 estimate implies another increase of roughly 71% from the prior year and almost triples the 2024 level.
| Period | Cash capital expenditures | Interpretation |
|---|---|---|
| 2024 | Approximately $77.7 billion | The AI buildout was expanding but had not reached its current scale. |
| 2025 | Approximately $128.3 billion | AWS infrastructure became the majority use of capital spending. |
| 2026 management estimate | Approximately $220 billion | Amazon is accelerating further in response to demand and higher component costs. |
Source: Amazon’s 2025 Form 10-K and second-quarter 2026 management commentary. The 2026 amount is guidance, not a completed expenditure.
The rate of increase makes this investment cycle different from a routine data-center expansion. Amazon is not simply adding capacity in line with historical cloud growth. It is placing a large bet that generative AI will create a new layer of computing demand and that AWS will capture enough of that demand to justify the assets.
The company attributed part of the increase from its earlier $200 billion expectation to higher memory-chip costs. That detail matters because not all additional spending represents more capacity. Inflation in components can increase the cash required to deliver the same number of servers. Investors therefore cannot assume that a 10% increase in the spending plan produces a 10% increase in future revenue potential.
Capital spending also includes more than AI accelerators. Amazon invests in servers, networking, data centers, fulfillment centers, transportation equipment, offices, stores, and other assets. Management has said that the majority is directed to technology infrastructure, primarily to support AWS. The retail network still requires maintenance and expansion, so the full $220 billion should not be treated as a pure AI figure.
The distinction between cash capex and property-and-equipment purchases can create confusion. Amazon uses cash payments, finance leases, and equipment acquired under other arrangements. Different publications may quote different capital measures. The most useful comparison is to use the same definition across periods and identify whether the number is cash paid, gross acquisitions, or management’s projected total.
Third-Quarter Guidance Was Mixed Rather Than Weak
Amazon forecast third-quarter net sales of $197 billion to $202 billion, representing growth of 9% to 12% from the comparable period. The high end was below the average analyst estimate cited immediately after the release, which initially appeared cautious. The comparison is distorted by the timing of Prime Day, however.
Prime Day occurred during the second quarter of 2026 but had fallen in the third quarter a year earlier. Amazon said that excluding the event’s timing, third-quarter growth would be almost four percentage points higher. The guidance also assumed an unfavorable foreign-exchange effect of approximately 80 basis points, or 0.8 percentage point.
Those adjustments do not make the reported guidance irrelevant. Amazon will still record the revenue in the periods when transactions occur, and investors must evaluate the actual quarterly figures. They explain why a simple comparison with the consensus estimate can overstate the slowdown in the underlying business.
Operating-income guidance ranged from $22.5 billion to $26.5 billion, compared with $17.4 billion in the prior-year quarter. The midpoint implies meaningful growth, although it would be lower than the $27.5 billion reported in the second quarter. Seasonal patterns, the timing of promotions, infrastructure costs, hiring, content, and other expenses can create sequential changes.
The range is wide enough to reflect uncertainty. A $4 billion span in operating income is not a precise forecast. The actual result will depend on sales mix, cloud usage, advertising demand, fulfillment efficiency, foreign exchange, and the timing of expenses. Investors should focus on the assumptions and segment trends rather than treating the midpoint as a promised outcome.
Why High-Margin Services Matter During a Capital-Intensive Cycle
Amazon cannot evaluate the AI buildout solely against AWS revenue. The company funds investment with cash generated across the entire enterprise, and the mix of that cash is shifting toward services. Marketplace fees, advertising, subscriptions, and AWS all monetize infrastructure or customer relationships without requiring Amazon to record the full value of every product sold as revenue.
This matters because revenue growth and financing capacity are not identical. A dollar of first-party merchandise sales must cover the cost of the product, fulfillment, transportation, returns, and support. A dollar of advertising or cloud revenue has a different cost structure. Amazon does not disclose a separate advertising operating margin, so the exact comparison is unavailable, but the service mix helps explain why consolidated operating income can grow faster than total sales.
The model also provides internal diversification. AWS is funding data-center expansion through its own operating profit, while North America, International, advertising, subscriptions, and seller services contribute to consolidated cash flow. If cloud demand temporarily slows, Amazon still has other businesses. If consumer spending weakens, long-term cloud contracts and advertising tied to marketplace competition can provide partial offsets.
Those offsets are not guaranteed. Advertising is connected to commerce, and a weaker retail environment can pressure merchant budgets. Subscription revenue depends on customers continuing to value Prime. Marketplace fees can face regulatory and seller resistance. International profit remains more exposed to foreign exchange and regional economics than a purely domestic service.
The broader point is that Amazon’s investment capacity is supported by an ecosystem rather than one product. That is an advantage over a specialized infrastructure provider, but it can make capital discipline harder to evaluate. Strong cash generation in one business can subsidize weak returns in another for a long time before the problem becomes obvious.
Investors should therefore watch whether service growth translates into consolidated operating cash, not merely whether the percentage of service revenue rises. Accounts receivable, contract timing, working capital, taxes, and interest can all affect conversion. The second quarter showed strong operating cash flow, but the infrastructure program consumed more than that cash after capital expenditures. Improving service mix reduces the burden; it does not eliminate it.
How to Think About Amazon’s Valuation After the Earnings Move
A conventional price-to-earnings ratio is unusually difficult to interpret after this quarter because Amazon’s earnings per share included a large Anthropic-related gain. Dividing the share price by reported trailing earnings would make the stock appear cheaper than it would on recurring operating performance alone. The ratio can change sharply if the private investment is revalued in a future quarter.
Operating income, cash flow, segment margins, and expected future spending provide a more stable framework. Even those measures require judgment. Current free cash flow is negative because investment is unusually high. Excluding all capital spending would ignore the cost of maintaining and expanding the business. Treating every dollar of capex as a recurring maintenance cost would ignore the future revenue capacity being created.
One approach is to separate maintenance investment from growth investment, but Amazon does not disclose that division precisely. Data centers need replacement servers and upgrades even without growth. New regions, additional capacity, and AI clusters are growth investments. The boundary can be subjective because replacing old hardware with more efficient equipment may both maintain existing service and expand output.
Another approach is to value the segments separately. AWS can be compared with other cloud and software businesses, advertising with digital media platforms, and retail with marketplaces and logistics companies. That method recognizes the different margins and growth rates but creates its own problems: shared costs, intercompany relationships, and the lack of fully independent financial statements for every activity make a precise sum-of-the-parts estimate difficult.
The earnings reaction indicates that the market assigned more value to stronger AWS growth than it subtracted for higher spending. It does not establish that the shares are inexpensive or that the return will persist. The price already reflects expectations about future cloud growth, AI profitability, retail margins, and advertising. A strong quarter can reduce uncertainty while leaving valuation risk intact.
For readers evaluating the company, the useful question is not whether the stock rose after one report. It is what assumptions are embedded in the price and which operational results would support or challenge them. Sustainable AWS growth, attractive incremental margins, backlog conversion, and a recovery in free cash flow would strengthen the case. Slowing cloud growth, lower utilization, faster depreciation, or persistent debt-funded spending would weaken it.
A Timeline of the Current Amazon Investment Cycle
- 2024: Amazon recorded approximately $77.7 billion of cash capital expenditures as generative-AI demand began reshaping cloud investment plans.
- 2025: Cash capital expenditures rose to approximately $128.3 billion. Amazon said the majority supported technology infrastructure, primarily AWS, and expected spending to increase again in 2026.
- First quarter of 2026: AWS growth reached 28%, operating income was $14.2 billion, and backlog stood near $364 billion. Trailing free cash flow had already fallen to about $1.2 billion as infrastructure spending accelerated.
- July 30, 2026: Amazon reported second-quarter AWS growth of 37%, operating income of $16.6 billion, and backlog of approximately $496 billion.
- Second-quarter update: Management raised expected 2026 capital spending from about $200 billion to about $220 billion, citing strong demand and higher memory costs.
- Through 2027 and beyond: Amazon says customer demand exceeds current capacity and that much of its planned 2027 compute capacity is already reserved. These are management statements about commitments and supply, not guarantees of future revenue or profit.
The chronology shows why the second quarter changed the debate. Spending had already increased before AWS growth accelerated. That sequencing created concern that Amazon was committing cash faster than it could demonstrate a return. The latest quarter supplied stronger evidence, but the investment remains front-loaded and the full financial outcome will unfold over several years.
What Would Confirm That the Strategy Is Working?
No single quarterly metric can answer whether $220 billion of spending creates value. A useful assessment requires several indicators moving together.
- Sustained AWS growth: Growth does not need to remain exactly 37%, but a rapid collapse after capacity comes online would raise questions about demand durability.
- Healthy AWS margins: Revenue growth supported by stable or expanding margins would indicate pricing and utilization remain favorable. A sharp margin decline could signal discounting or excess cost.
- Backlog conversion: Contracted commitments should translate into recognized revenue rather than continually expanding without corresponding sales.
- Improving free cash flow: Cash flow may remain pressured during construction, but mature capacity should eventually generate enough cash to offset the investment cycle.
- Moderating debt growth: Amazon can borrow, but a sustainable model should not require debt to grow at the current pace indefinitely.
- Broader customer adoption: Evidence that enterprises are moving AI applications from experiments into production would reduce dependence on a small number of frontier-model customers.
- Custom-chip traction: Trainium and related chips should improve availability or cost without creating an ecosystem that customers avoid.
- Operational reliability: Rapid expansion must not come at the expense of security, uptime, or customer support.
What Would Show That Amazon Is Overbuilding?
The clearest warning would be a divergence between capacity and demand. If capital expenditures remain high while AWS growth slows sharply, backlog stagnates, and margins contract, the company could be adding assets faster than customers use them. Lower utilization would then pressure returns.
Accelerated depreciation or impairment charges would be another signal. They could indicate that equipment became obsolete sooner than expected or that facilities were not generating sufficient cash. Amazon’s accounting estimates deserve attention because the useful life assigned to servers affects reported operating profit.
A price war would also challenge the investment thesis. Cloud providers can lower unit prices to attract workloads or fill capacity. Usage might grow while revenue and margins disappoint. Custom chips can protect costs, but rivals are pursuing their own silicon and purchasing at enormous scale.
Persistent negative free cash flow accompanied by continued rapid debt issuance would suggest that the investment cycle is not self-funding. One or two years of pressure can be consistent with construction timing. An indefinite requirement for external financing would be more concerning, especially if interest expense keeps rising.
Finally, customer behavior matters. If enterprises remain in pilot programs, use AI mainly through consumer applications, or shift toward smaller models that require far less computing, the expected infrastructure demand may not materialize at current prices. Efficiency can expand the market, but Amazon must capture enough of the resulting activity.
Amazon’s Diversified Business Model Changes the Risk Calculation
Amazon’s ability to spend at this scale depends on a business model that is more diversified than the company’s retail identity suggests. It combines first-party commerce, a third-party marketplace, logistics, subscriptions, digital advertising, cloud infrastructure, devices, entertainment, pharmacy, and other services. The businesses share customers, data, technology, and physical assets, but they generate revenue and cash in different ways.
First-party retail produces enormous transaction volume but generally carries thinner margins because Amazon records the merchandise cost, fulfillment expense, shipping, returns, and customer service. The marketplace is more capital-efficient because independent merchants own much of the inventory while Amazon earns commissions and service fees. Advertising monetizes seller competition and consumer attention. Prime subscriptions deepen loyalty and encourage purchasing frequency. AWS supplies the majority of operating profit and provides infrastructure used across the company.
This mix gives Amazon several defenses during an investment cycle. A slowdown in one activity does not automatically eliminate cash generation elsewhere. Advertising can grow even when merchandise margins are narrow. Marketplace services can benefit from selection without requiring Amazon to buy every product. AWS contracts can provide multi-year visibility. Prime can support retention through shipping, entertainment, and other benefits.
Diversification can also hide tradeoffs. Amazon may spend on faster delivery to improve Prime retention, accept lower retail margins to increase marketplace activity, and use the resulting shopping traffic to sell advertising. Evaluating each business as though it operates independently can miss those connections. Conversely, describing the ecosystem as one seamless flywheel can obscure whether a specific investment earns an adequate return.
The AI program illustrates both sides. AWS can sell computing to outside customers, while Amazon’s retail and advertising businesses use the same class of technology internally. Shared research, chips, and software may reduce the total cost of innovation. Yet internal use does not automatically prove that an external data-center project is profitable, and AWS customers will not pay more simply because another Amazon division benefits.
The size of the workforce adds another dimension. Amazon reported approximately 1.576 million employees at the end of 2025. Automation can improve productivity across fulfillment, customer service, software development, and administration, creating potential savings that do not appear as AWS revenue. It can also require retraining, organizational redesign, and difficult decisions about roles. The financial return from AI may therefore appear partly as avoided cost or higher output rather than a discrete product sale.
Why Segment Profit Is More Informative Than Revenue Mix Alone
AWS represented about 21% of second-quarter revenue but approximately 61% of operating income. That difference explains why a few percentage points of cloud growth can matter more to valuation than a larger dollar increase in online-store sales. Revenue is not equally valuable when margins, capital needs, and growth differ.
Advertising is not reported as a separate operating segment, which limits precision. Its revenue growth suggests attractive incremental economics, but Amazon does not disclose a standalone advertising margin. Third-party seller services are similarly embedded in the North America and International segments. The reported segment structure therefore makes AWS profitability visible while combining several other high- and low-margin activities.
Investors should avoid assigning the entire North America margin to retail merchandise. The segment includes marketplace fees, advertising associated with commerce, subscriptions, and other services. Its improvement reflects mix and operational efficiency as well as delivery economics. The International segment has also become profitable, reducing the extent to which AWS must subsidize expansion outside the United States.
Depreciation Will Become More Important as New Capacity Enters Service
Capital spending affects cash flow when Amazon pays for assets, but it affects operating profit over time through depreciation. A data center under construction may consume cash without immediately creating a large depreciation expense. Once the facility and servers are placed into service, depreciation begins and can weigh on margins even as revenue starts to grow.
This timing means the current AWS margin does not yet include the full expense of every dollar being spent in 2026. Some projects will enter service later. If utilization grows quickly, new revenue can more than offset depreciation. If utilization is weak, the same accounting expense can expose overcapacity.
The useful-life estimate assigned to servers is consequential. A longer useful life reduces annual depreciation and raises near-term operating income, assuming no impairment. A shorter life does the opposite but may better reflect rapid technological change. Cloud companies periodically revise server and network-equipment lives as experience and technology evolve, which can affect reported profit without changing the original cash expenditure.
Depreciation is sometimes dismissed as a non-cash charge, but that description can be misleading in a capital-intensive business. The cash was spent earlier, and hardware eventually must be replaced. The relevant question is whether the asset generates enough cumulative cash during its useful life to recover the investment and earn an acceptable return.
For AI servers, economic life may differ from physical life. Equipment can continue operating while newer chips deliver much better performance per watt or per dollar. Older accelerators may still serve inference, smaller models, research, or customers with less demanding workloads. Amazon’s ability to move equipment down a hierarchy of uses can extend its economic value.
Why Free Cash Flow Should Not Be Ignored or Used Mechanically
Free cash flow is valuable because it shows how much operating cash remains after purchases of property and equipment. It is also imperfect when a company is undertaking a historic expansion. A negative figure can indicate either a deteriorating business or a deliberate decision to build valuable capacity. The income statement and operating metrics help distinguish those cases.
Amazon’s operating cash flow rose 33%, AWS growth accelerated, and backlog expanded. Those facts support the view that much of the cash outflow is growth investment. At the same time, management does not provide a precise split between maintenance and expansion, and investors cannot assume every project will earn a high return. Free cash flow is therefore a warning about the amount at risk, not proof that the strategy is failing.
A useful longer-term test is cumulative cash generation. If the company spends heavily in 2026 and 2027 but produces much larger operating cash flows in later years, the temporary deficit may be economically rational. If spending remains permanently high simply to preserve market position, normalized free cash flow may be lower than current expectations.
Anthropic Is Both an Investment and a Cloud Customer
Amazon’s relationship with Anthropic is strategically important because it combines a financial investment with a commercial cloud partnership. Amazon holds convertible notes and nonvoting preferred stock, while Anthropic uses AWS infrastructure and Amazon’s custom chips. The relationship can create benefits on both sides: Anthropic receives capital and computing capacity, and Amazon gains a prominent AI customer and exposure to the developer’s valuation.
The arrangement also complicates financial interpretation. A rise in Anthropic’s private valuation can produce a non-operating gain for Amazon. Separately, payments by Anthropic for AWS services can contribute to cloud revenue. The investment gain and the commercial revenue have different economic qualities and should not be combined as though they are one stream of operating profit.
There is also a concentration question. Large commitments from a leading model developer can validate AWS technology and fill capacity, but they may increase dependence on the customer’s financing and competitive success. Amazon does not disclose enough detail to determine how much of AWS growth or backlog is associated with Anthropic.
The partnership may accelerate Trainium adoption because a demanding model developer can test the chips at scale and help improve software tools. That experience can make the product more credible to other customers. It can also create perceptions of favoritism or limit flexibility if other model providers prefer neutral infrastructure.
Amazon Bedrock is designed to reduce that risk by offering access to models from multiple developers. An enterprise can choose among models without building every integration separately. The platform strategy is more durable if AWS remains useful regardless of which model company leads at a particular moment.
Lessons From Amazon’s Earlier Investment Cycles
Amazon has repeatedly accepted lower near-term cash generation to build infrastructure that later became central to its business. Fulfillment centers shortened delivery times and supported Prime. Marketplace systems allowed third-party merchants to expand selection. AWS transformed internal computing capabilities into an external service. Those precedents explain why management receives more patience than a company attempting its first large reinvestment cycle.
History is not a guarantee. Earlier projects succeeded under different competitive and financial conditions. AWS was entering a market with fewer comparable providers, while today’s AI infrastructure race includes several companies with enormous balance sheets. Interest rates are higher than during much of the previous decade, and the physical constraints around power and advanced chips are more severe.
Amazon has also experienced periods when capacity expanded faster than demand. The rapid logistics buildout around the pandemic later required the company to improve utilization, close or delay some facilities, and reduce costs. The lesson is not that large investments are inherently wrong. It is that timing matters and that management can misjudge how quickly extraordinary demand persists.
The current buildout has one advantage over a purely speculative expansion: Amazon can point to contracted AWS backlog and immediate capacity constraints. It also has one disadvantage: AI hardware may become obsolete faster than warehouses. A fulfillment center can be repurposed for different products and delivery patterns, while an accelerator optimized for one generation of models may lose economic relevance rapidly.
Amazon’s organizational culture emphasizes long-term investment, customer demand, and willingness to tolerate near-term volatility. That culture can support projects whose payoff takes years. It can also make it easier to rationalize overspending. Independent analysis should therefore respect the company’s execution record without treating it as proof that every new commitment will succeed.
The Broader Economic Effects Extend Beyond Amazon
A capital program of this scale affects suppliers, utilities, construction companies, semiconductor manufacturers, equipment makers, real-estate markets, and local governments. Data-center investment creates demand for advanced chips, memory, networking gear, transformers, cooling systems, concrete, electrical equipment, and skilled labor. Bottlenecks in any of those markets can raise prices well beyond Amazon.
The spending can support economic growth through construction and equipment investment. It can also strain regional power systems and compete with other users for transmission capacity. Utilities may need to build generation and grid infrastructure whose cost is distributed among customers under local regulatory rules. The allocation of those costs is becoming a policy issue.
Communities weigh tax revenue and employment against land use, water consumption, noise, and electricity demand. Data centers employ fewer people after construction than a similarly expensive labor-intensive factory, so the local benefit depends heavily on tax agreements, supply-chain activity, and infrastructure commitments. Amazon must negotiate these issues project by project.
At the national level, cloud capacity has become connected to economic competitiveness and security. Governments want domestic infrastructure for sensitive data and AI development. They also scrutinize concentration because a small number of providers operate systems on which businesses and public agencies depend. Amazon may benefit from strategic demand while facing stronger oversight.
Trade and export rules can affect which chips are available in particular countries and which services can be offered. Data-residency requirements can force Amazon to build regional capacity rather than serve every customer from the most efficient global location. That can increase capital needs but also create barriers for smaller competitors.
What the Quarter Says About the State of the AI Economy
Amazon’s results add to evidence that AI investment has moved beyond experimental budgets at major companies. AWS backlog, Azure growth, Google Cloud expansion, and the capital plans of all three providers indicate that businesses are reserving infrastructure at scale. The market is no longer defined only by consumer chatbots or venture funding.
The spending is nevertheless concentrated among a small number of infrastructure providers and model developers. That concentration means aggregate figures can look enormous even before adoption is evenly distributed across the broader economy. A limited group of companies can account for a large share of hardware demand.
Enterprise adoption remains uneven. Some customers are deploying AI into core operations; others are testing tools without a clear return. The cost of implementation includes data preparation, security, workflow redesign, employee training, and governance, not merely cloud usage. AWS can sell computing during experimentation, but the most durable demand will come from applications that produce measurable value.
The current phase resembles an infrastructure race in which suppliers build ahead of fully mature applications. That can be rational because customers cannot develop software without access to computing. It can also create a period when capital formation exceeds realized end-user revenue. The balance between those forces will determine whether the industry experiences persistent scarcity or eventual excess capacity.
Amazon’s quarter tilts the evidence toward genuine demand. A 37% increase in a $42.2 billion quarterly business is difficult to explain as a small pilot effect. The unresolved question is how much of that growth reflects a temporary concentration of training activity and how much represents the beginning of widespread recurring inference.
Management Credibility Improved, but Disclosure Still Has Limits
The quarter improved management credibility because earlier spending claims were followed by measurable acceleration. AWS growth, margins, and backlog provide observable support for the argument that capacity is constrained. Investors did not have to rely solely on qualitative descriptions of customer interest.
Disclosure remains incomplete in areas that matter. Amazon does not reveal the customer concentration of AI contracts, detailed Trainium revenue, unit economics by chip type, utilization rates, the division of maintenance and growth capex, or the margin expected on backlog. Competitive sensitivity explains some of that restraint, but it limits outside analysis.
The $25 billion annualized run-rate statements for the AI and chip businesses are also broad indicators rather than audited segments. A run rate extrapolates current activity and can change quickly. It does not specify recognized annual revenue, operating profit, or the amount of overlap between categories.
Management’s less-than-three-year server payback framework is useful but depends on assumptions that are not fully disclosed. Investors cannot independently test utilization, pricing, cost allocation, or residual value. The claim should be treated as management’s current economic assessment, supported by strong segment results but not proven for every future asset.
The best response is neither automatic trust nor automatic skepticism. Amazon has provided stronger evidence than it had a quarter earlier. Continued credibility will depend on whether the same metrics remain consistent as spending rises and new depreciation enters the income statement.
What Happens Next
The next phase is less about announcing larger numbers and more about conversion. Amazon has signed substantial commitments and begun building the capacity required to serve them. Investors will watch how quickly that backlog becomes revenue, whether AWS margins remain strong, and when the cash-flow burden begins to ease.
Third-quarter results will provide the first test of the post-Prime Day guidance. Because the event shifted into the second quarter, reported sales growth will look slower unless readers adjust the comparison. AWS is likely to remain the more informative measure because it is not affected by the retail calendar in the same way.
Capital spending will be monitored against the $220 billion plan. A further increase could be interpreted positively if accompanied by stronger demand and backlog, or negatively if driven mainly by inflation and delays. The reason for any change matters more than the direction alone.
Cash flow will remain under pressure while Amazon pays for projects before they generate revenue. The key question is whether trailing free cash flow stabilizes as operating cash flow grows. A return to positive free cash flow would not automatically prove that the investment succeeded, but it would demonstrate that the business can begin funding the buildout more comfortably.
Debt and interest expense will also receive more attention. Amazon’s liquidity gives it room, but the doubling of long-term debt in six months changed the balance-sheet discussion. Future financing choices will show how management balances speed, flexibility, and cost.
Anthropic could create additional earnings volatility. New financing transactions or changes in valuation may generate gains or losses that have little connection to Amazon’s quarterly operations. Readers should continue separating those items from operating income and cash flow.
Competitive results will provide context. Microsoft and Alphabet are deploying comparable sums and reporting rapid cloud growth. Amazon’s performance cannot be assessed in isolation because customers compare platforms, capacity, chips, models, and prices. Relative growth and margins will help show whether AWS is strengthening its position or merely benefiting from an expanding market.
Frequently Asked Questions
Did Amazon beat earnings expectations in Q2 2026?
Amazon reported stronger-than-expected quarterly sales and AWS revenue in the immediate market comparison cited after the release. Net sales were $200.6 billion, and AWS generated $42.2 billion. Reported net income was unusually high because it included a large non-operating gain related primarily to Anthropic, so operating income is a better measure of recurring business performance.
Why did Amazon stock rise after the earnings report?
The shares rose roughly 9% in after-hours trading on July 30 after Amazon reported 37% AWS growth, a substantial increase in cloud backlog, and strong AWS operating margins. The initial reaction suggests that investors placed more weight on evidence of AI-related cloud demand than on negative free cash flow, increased debt, and higher capital spending.
How much revenue did Amazon report?
Amazon reported $200.6 billion in net sales for the quarter ended June 30, 2026, up 20% from $167.7 billion in the year-earlier period. The figure includes product sales and service revenue across retail, third-party seller services, subscriptions, advertising, and AWS.
How fast did AWS grow?
AWS revenue rose 37% year over year to $42.2 billion. Amazon described that as the fastest growth in 18 quarters. AWS operating income increased 64% to $16.6 billion, and its operating margin reached 39.4%.
What is Amazon’s AWS backlog?
AWS backlog was approximately $496 billion at the end of the second quarter. It represents contracted business expected to be recognized in future periods, not revenue already earned. The figure improves demand visibility but does not disclose the exact quarterly schedule, margins, or customer concentration.
How much does Amazon plan to spend on capital expenditures in 2026?
Management increased its expected 2026 capital expenditures to approximately $220 billion from an earlier estimate of about $200 billion. The majority is intended for technology infrastructure, primarily AWS, although the total also includes investments elsewhere in Amazon.
Why was Amazon’s free cash flow negative?
Trailing-12-month free cash flow was an outflow of $7.6 billion because purchases of property and equipment increased sharply, mainly to support AI and AWS infrastructure. Operating cash flow remained positive at $161.4 billion, but capital spending consumed more cash than the conventional free-cash-flow calculation generated.
Why was Amazon’s net income so much higher than operating income?
Net income of $62.6 billion included $53.4 billion of pre-tax non-operating income, primarily related to Amazon’s Anthropic investments. Operating income was $27.5 billion. The difference shows why reported earnings per share should not be treated as a pure measure of recurring operations for this quarter.
Is Amazon becoming more indebted?
Yes. Long-term debt rose to $128.9 billion at June 30 from $65.6 billion at the end of 2025, and Amazon recorded approximately $67.0 billion of long-term debt proceeds during the first half. The company also held more than $122 billion in cash and marketable securities and generated substantial operating cash flow, so the increase represents a change in financing strategy rather than an immediate liquidity crisis.
How does AWS compare with Microsoft Azure and Google Cloud?
AWS remains larger by the scale indicators disclosed, with a quarterly annualized revenue pace of about $169 billion. Azure surpassed $100 billion in annual revenue and grew 41% in Microsoft’s fiscal 2026. Google Cloud reported $24.8 billion of quarterly revenue and 82% growth, but its figure includes Workspace and initial TPU system sales. Accounting and segment definitions differ, so direct rankings require caution.
Was Amazon’s third-quarter guidance disappointing?
The revenue range of $197 billion to $202 billion was below the average estimate cited after the release, but the comparison is affected by Prime Day moving into the second quarter and by an assumed foreign-exchange headwind. Amazon said underlying growth excluding the event’s timing would be almost four percentage points higher. Operating-income guidance still implied year-over-year growth.
What should readers watch in Amazon’s next results?
The most important indicators are AWS growth, AWS margins, backlog conversion, capital spending, free cash flow, debt, and the mix of recurring operating profit versus investment-related gains. Advertising and third-party seller services also matter because they help fund the infrastructure cycle.
Final Assessment
Amazon’s second-quarter report strengthened the case that its AI investment is tied to real commercial demand. AWS accelerated to 37% growth, operating income rose 64%, margins expanded, and backlog reached approximately $496 billion. Those results are more persuasive than a vague promise that artificial intelligence will eventually produce returns.
The quarter also showed the price of pursuing that opportunity at maximum speed. Free cash flow turned negative, property-and-equipment purchases surged, long-term debt nearly doubled in six months, and the 2026 capital-spending plan rose to approximately $220 billion. Amazon is committing cash before the associated infrastructure is complete and before much of the contracted revenue is recognized.
The strongest supportive interpretation is that Amazon is building into constrained demand with a profitable cloud platform, a vast customer base, custom chips, and enough financial capacity to sustain the effort. The strongest concern is that the company may be extrapolating a period of scarcity and concentrated AI spending into an asset base whose returns depend on utilization, pricing, technological life, and continued access to power.
Reported net income should not obscure that judgment. The Anthropic-related gain added enormous value on paper, but it is not a substitute for recurring operating cash. Amazon’s underlying quarter was strong enough without it: operating income rose 43%, every segment was profitable, advertising grew rapidly, and AWS produced the clearest acceleration.
The investment thesis now rests on execution rather than proof of initial demand. Amazon has shown that customers want the capacity. It still must deliver that capacity on time, convert commitments into revenue, preserve cloud margins, manage debt, and restore free cash flow as the assets mature. The second quarter made the $220 billion plan easier to defend. It did not make the plan low-risk.
This article is provided for general informational purposes and does not constitute financial, investment, tax, or legal advice.
Sources
- Amazon second-quarter 2026 earnings release filed with the U.S. Securities and Exchange Commission
- Amazon Q2 2026 earnings release and financial tables
- Amazon first-quarter 2026 Form 10-Q
- Amazon 2025 Form 10-K
- Reuters reporting on Amazon’s Q2 2026 results, spending plan, backlog, and after-hours market reaction
- Microsoft fiscal 2026 fourth-quarter earnings materials
- Alphabet second-quarter 2026 earnings call materials
- Meta second-quarter 2026 financial results
- Reuters market report for the July 30, 2026 U.S. trading session
Affiliate disclosure: Businessfinance.news may earn compensation from qualifying actions completed through selected links on this website, at no additional cost to the reader. Affiliate relationships do not influence our editorial reporting, analysis, or conclusions.