Last updated: July 29, 2026, 8:30 a.m. Eastern Time (12:30 UTC). Market prices are intraday and may change rapidly.
Oil prices surged nearly 5% on Wednesday after a short-lived period of relative calm in the Middle East gave way to another round of missile activity, drone attacks and retaliatory strikes. Brent crude futures climbed to about $88.23 a barrel and U.S. West Texas Intermediate rose to roughly $82.95 by 11:45 a.m. London time, according to Reuters’ July 29 oil-market report. The immediate price reaction reversed much of Tuesday’s decline and restored a geopolitical risk premium that traders had started to remove when the United States paused strikes and diplomacy appeared to be regaining momentum.
The relationship between oil prices and the Iran conflict was not simply a reaction to another military headline. It reflected a renewed threat to several parts of the energy system at once: Saudi petroleum facilities, U.S. military positions in the region, tanker routes through the Strait of Hormuz, shipping through the Red Sea and Bab el-Mandeb, and the fragile diplomatic process intended to restore more normal Gulf trade. None of those risks automatically means that physical oil supply will fall by the same amount as prices rose. Together, however, they make the range of possible outcomes wider and the cost of being unprepared higher.
The timing adds another layer of economic importance. The Federal Open Market Committee was completing its July 28–29 meeting as oil prices rebounded. The policy announcement was scheduled for 2:00 p.m. Eastern Time, several hours after this article’s research cutoff. The Fed entered the meeting with inflation still above its target, energy prices substantially higher than a year earlier, and markets debating whether officials would hold the federal funds target range at 3.50%–3.75% or deliver a surprise increase. A renewed oil shock does not mechanically determine monetary policy, but it complicates the central bank’s task by threatening household purchasing power, transportation costs and inflation expectations at the same time.
For businesses, the relevant question is therefore broader than whether Brent settles above or below $90. The more important issue is whether the latest escalation remains a short-lived repricing of risk or develops into a sustained constraint on production, refining, shipping and insurance. That distinction will shape the outlook for energy producers, airlines, trucking companies, chemical manufacturers, retailers, food processors, utilities, importers and consumers around the world.
Key Takeaways
- Main development: U.S. forces said they intercepted an attempted Iranian missile attack, while U.S. and Saudi aircraft struck Iran-aligned sites in Iraq after a series of drone attacks targeting U.S. forces and Saudi energy infrastructure.
- Oil-market response: Brent crude rose about 4.9% to $88.23 a barrel and WTI gained about 4.7% to $82.95 by 11:45 a.m. London time on July 29.
- Why the Strait matters: The International Energy Agency says roughly 20 million barrels a day of crude oil and petroleum products moved through the Strait of Hormuz in 2025, equal to around one-quarter of global seaborne oil trade.
- Physical-market context: June brought a partial recovery in Gulf exports, but the IEA estimated world oil supply was still about 9.4 million barrels a day below prewar levels.
- Inflation context: U.S. consumer energy prices fell sharply in June from May, but they remained 15.7% higher than a year earlier; gasoline was up 26.7% year over year.
- Federal Reserve context: The July policy decision had not been released at the research cutoff. The official target range entering the meeting was 3.50%–3.75%.
- Central uncertainty: Prices can fall quickly if diplomacy restores tanker traffic, but they can rise just as quickly if Gulf infrastructure is damaged or both Hormuz and the Red Sea become harder to use.
Market Snapshot
Oil prices on July 29, 2026
- Brent crude futures: approximately $88.23 a barrel, up $4.14 or 4.9% at 11:45 a.m. London time.
- WTI crude futures: approximately $82.95 a barrel, up $3.69 or 4.7% at the same time.
- Previous session: Brent had fallen 4.8% to $84.09 and WTI had fallen 4.1% to $79.26 on July 28 as hopes for talks improved.
- Interpretation: The two-day reversal illustrates how rapidly the market is adding and removing a war-risk premium as the diplomatic and military picture changes.
Original source: Reuters oil-market reporting, July 29, 2026
What Happened From Late July 28 Into July 29
The latest escalation developed across several fronts rather than through one isolated incident. The United States said its air defenses intercepted missiles launched at American forces in the Middle East. Jordan said its defenses shot down five Iranian missiles. Iran’s Revolutionary Guards said they had fired ballistic missiles at U.S. military installations in Jordan and also claimed attacks on vessels attempting to navigate the Strait of Hormuz by a route Tehran considered unauthorized. Those statements establish that missile activity occurred, but the precise operational details and the parties’ broader accounts remain shaped by wartime claims and should be treated with care.
Separately, the United States and Saudi Arabia carried out joint strikes against Iran-aligned groups in Iraq. In an official July 28 release, U.S. Central Command said U.S. and Saudi fighter aircraft hit logistics and weapons sites in eastern Iraq. CENTCOM attributed more than 30 drone attacks over the previous 72 hours to groups directed by Iran’s Islamic Revolutionary Guard Corps and said the attacks had targeted U.S. forces and Saudi energy infrastructure.
Saudi Arabia said its air defenses had intercepted drones aimed at petroleum facilities in the kingdom’s eastern region. Iran-backed militias in Iraq denied responsibility for some of the attacks, while Houthi forces in Yemen separately claimed activity against Saudi shipping. The attribution dispute matters. Markets do not need a final legal finding before repricing risk, but companies and policymakers should distinguish between confirmed attacks, official allegations and denials by accused groups.
The conflict also widened politically. Saudi Arabia publicly acknowledged participating in joint military operations with the United States, a step that increased concern that the war could spread through Iraq and the broader Gulf. Iraq’s government called an emergency meeting as the strikes raised the risk of internal instability and pressure on Baghdad’s relationships with both Washington and Tehran. The human cost was immediate: Iraq’s Popular Mobilisation Forces said at least 20 members were killed and 32 wounded. Those figures came from the organization itself and had not been independently verified at the research cutoff.
The military developments followed an unstable diplomatic sequence. President Donald Trump had suspended an intensive U.S. bombing campaign after 13 days of strikes, encouraging the market to price in a greater chance that negotiations could resume. Oil fell sharply on July 28 as traders responded to that pause. Within hours, the missile and drone activity disrupted the assumption that the pause would hold. The result was a rapid reversal in futures prices rather than a gradual reassessment.
At the same time, Iran rejected an Omani proposal for joint management of the Strait of Hormuz. A senior Iranian official told Reuters that a proposed 50-50 arrangement with Oman did not serve Iran’s interests. Tehran’s position was that it should retain sole control over the inbound shipping lane and partial control over outbound traffic. The United States had been encouraging ships to use a route closer to Oman. The disagreement is more than a dispute over maritime administration. It concerns who can direct vessels, impose service charges, inspect or deter ships, and define what counts as lawful passage through the world’s most important oil chokepoint.
Why Oil Rose So Quickly
Oil futures move on expectations about future availability, not only on barrels that have already disappeared. A missile intercepted before it reaches a production site may cause no direct supply loss, yet it can still change the probability assigned to a much more serious disruption. Traders, refiners, airlines, producers and physical merchants respond to that changing probability through futures positions, inventory decisions, freight bookings and hedging.
Three forces drove Wednesday’s move. The first was a renewed threat to infrastructure. Saudi Arabia is the largest crude exporter in the world and operates production, processing and export systems that are difficult to replace quickly. Even an unsuccessful attack can increase the perceived likelihood of future damage, tighter security procedures or temporary operational stoppages.
The second force was the deteriorating outlook for navigation through Hormuz. Oil flows through the strait had already been depressed for months. The latest disagreement over routes and control reduced confidence that normal shipping could be restored promptly. Reuters reported that only a few commodity vessels had transited Hormuz so far during the week. That is a physical signal, not merely a political one.
The third force was evidence of tightness in U.S. inventories. Market sources citing the American Petroleum Institute said commercial crude stocks fell about 3.3 million barrels in the week ended July 24. The API figure is private-sector data and was not the official government estimate. The Energy Information Administration’s weekly report was due later on July 29, after this article’s cutoff. Still, the reported draw reinforced the view that the market did not have an unlimited cushion if Middle Eastern supply deteriorated again.
The magnitude of the price increase should not be read as a precise estimate of expected supply loss. Brent’s 4.9% gain reflected risk, liquidity, positioning and the reversal of Tuesday’s de-escalation trade. Oil had fallen about 5% in the previous session as traders anticipated talks. When that assumption weakened, some positions had to be reversed quickly. This is one reason geopolitical oil markets often move in sharp steps rather than smooth lines.
The Difference Between a Risk Premium and a Physical Shortage
A useful way to interpret the market is to separate the geopolitical risk premium from the physical balance. The risk premium is the additional price buyers are willing to pay, or sellers demand, because a disruption might occur. The physical balance is the measurable relationship among production, exports, refining, inventories and consumption.
Those two concepts interact but are not identical. A conflict can generate a large risk premium even when production remains intact. Conversely, an actual supply loss may initially have a modest price effect if inventories are high, demand is weak or replacement barrels are readily available. The present crisis contains elements of both. Markets are reacting to the possibility of new attacks, but the system has also experienced real restrictions on shipping and production since the war began in February.
The distinction matters because it explains why oil can rise 5% in a morning and then surrender much of the move after a diplomatic statement. A statement that reduces the probability of blockade or infrastructure damage can remove risk premium without adding a single barrel of supply. A damaged terminal, a closed shipping lane or a sustained production shutdown would be harder to reverse because physical replacement takes time.
Investors often use the phrase “geopolitical risk” as if it were one variable. In practice, it consists of several separate questions. Can producers pump? Can pipelines move crude to terminals? Can tankers obtain crews and insurance? Can ships pass safely? Can refiners obtain the grades they need? Can governments release reserves? Can consumers reduce demand? The answer to each question may differ, which is why a conflict can tighten diesel or jet fuel even when headline crude inventories appear adequate.
Why the Strait of Hormuz Remains the Central Economic Fault Line
The Strait of Hormuz connects the Persian Gulf with the Gulf of Oman and the Arabian Sea. Its narrow geography concentrates an extraordinary share of the world’s energy trade in one corridor. The International Energy Agency estimates that an average of roughly 20 million barrels a day of crude oil and petroleum products moved through the strait in 2025. That represented around 25% of global seaborne oil trade.
The importance of Hormuz is not only the volume. It is the limited ability to reroute that volume. The U.S. Energy Information Administration’s chokepoint analysis estimates that Saudi Arabia’s East-West pipeline and the United Arab Emirates’ Abu Dhabi pipeline together could provide about 4.7 million barrels a day of bypass capacity during a disruption. That is substantial, but it is far less than normal flows through the strait. Pipeline capacity also does not guarantee that every barrel can be redirected immediately; fields, storage, grades, terminals and commercial contracts must align.
The exposure is geographically uneven. EIA estimates indicate that the large majority of crude and condensate moving through Hormuz is destined for Asian markets. China, India, Japan and South Korea are among the most exposed importers. That does not mean the United States or Europe is insulated. Oil is globally traded, and a shortage in Asia changes the competition for Atlantic Basin barrels, tanker capacity and refined products everywhere.
Hormuz also carries liquefied natural gas and other commodities. A disruption can therefore affect power generation, petrochemicals and industrial feedstocks as well as gasoline and diesel. Qatar’s LNG exports are especially relevant to Asian and European gas markets. Even when the article’s immediate focus is crude, the broader energy complex cannot be separated cleanly from the shipping corridor.
Fact Box
Why Hormuz cannot be replaced easily
- Approximately 20 million barrels a day of crude and petroleum products transited the strait in 2025.
- The route handled around one-quarter of global seaborne oil trade.
- Saudi and UAE pipelines provide about 4.7 million barrels a day of estimated bypass capacity.
- Most Hormuz crude and condensate flows are directed toward Asia, but global pricing spreads the impact across regions.
Original sources: IEA Strait of Hormuz overview and EIA World Oil Transit Chokepoints
The Oil Market Was Already Recovering From an Historic Disruption
The latest price move cannot be understood as a normal peacetime reaction. The war that began on February 28 had already produced an extraordinary disruption to Middle Eastern production and tanker traffic. In March, the IEA described the loss as the largest supply disruption in the history of the global oil market. Physical crude prices briefly approached $150 a barrel during the most severe phase, while diesel, jet fuel and liquefied petroleum gas became especially tight.
Conditions improved during June after an interim ceasefire and a partial reopening of shipping routes. The IEA’s July 2026 Oil Market Report estimated that global oil supply rebounded by 4.1 million barrels a day in June to 98.8 million barrels a day. That was a large monthly recovery, but world output remained about 9.4 million barrels a day below prewar levels.
Total Gulf oil exports, including volumes that bypassed Hormuz, increased by about 6.5 million barrels a day in June to 16.1 million barrels a day. The prewar average was around 24 million barrels a day. In other words, the market had made meaningful progress but had not returned to normal. This helps explain why a new military setback produced such a forceful price response. The buffer created by June’s recovery was incomplete.
Refined products were also tighter than the crude benchmark alone suggested. The IEA estimated that global refinery runs rose by 1.5 million barrels a day in June but remained 6 million barrels a day lower than a year earlier. Some Middle Eastern export refineries had not restarted, Russian throughput was constrained by attacks, and Asian refiners were operating below normal levels. Product cracks and refining margins reached four-year highs in early July even as crude prices fell. That divergence is important for consumers because gasoline, diesel and jet fuel prices depend on refining capacity and product inventories, not only on the price of unrefined crude.
Observed global oil inventories rose by 21 million barrels in June, according to the IEA, but the composition mattered. The increase came largely from oil on water, while onshore stocks continued to fall. OECD inventories declined by a further 62 million barrels, including an estimated 44 million barrels drawn from government reserves. Oil floating on ships is not equivalent to product stored near a refinery or consumer market. Location, quality and accessibility determine how useful an inventory barrel is during a disruption.
This background weakens two simplistic interpretations. The first is that the market is on the verge of immediate collapse because prices rose sharply. June demonstrated that production and exports can recover quickly when routes reopen. The second is that the crisis is largely over because Brent has traded below its spring peak. Supply remains below prewar levels, inventories have been used, and the route that enabled the recovery is still contested.
How the Latest Shock Interacts With U.S. Inventories
Inventory data often receive disproportionate attention on trading days because they provide one of the few high-frequency measures of the physical oil balance. A weekly draw can support prices by suggesting that consumption or exports exceeded available supply. A build can pressure prices by indicating that refiners or consumers did not need all the crude delivered to the market. Yet weekly figures are noisy and should not be treated as a complete verdict.
The reported 3.3 million-barrel decline from the American Petroleum Institute was consistent with a tighter short-term picture, but it remained an industry estimate. The official EIA report had not yet been published at the research cutoff. The distinction is important because API and EIA estimates can differ materially. Imports, exports, refinery runs and pipeline timing can all shift the weekly number.
The most recent official EIA summary available before Wednesday’s release covered the week ended July 17. It showed U.S. commercial crude inventories rising by 2 million barrels to 411.7 million barrels. Even after that increase, stocks were about 6% below the five-year average for the same time of year. Gasoline inventories were about 7% below their five-year average and distillate stocks were about 10% below. Those deficits do not prove an imminent shortage, but they indicate that the domestic system did not enter the latest escalation with unusually abundant petroleum-product reserves.
Distillates deserve particular attention. Diesel fuels trucking, agriculture, construction, mining and parts of manufacturing, while closely related middle distillates are used in aviation and heating. A crude market can appear adequately supplied while distillate prices remain elevated because the refinery system cannot produce or transport enough of the required products. The IEA’s observation that refinery runs were still far below year-earlier levels reinforces that risk.
U.S. production provides a partial shock absorber. The country is a major crude producer and exporter, and higher prices can encourage more output over time. The response is not immediate. Shale companies need drilling plans, crews, equipment, pipeline space and confidence that prices will remain high enough to justify spending. Public producers have also spent years emphasizing capital discipline and shareholder returns rather than growth at any cost. A one-day geopolitical rally is unlikely to overturn those strategies.
The Strategic Petroleum Reserve offers another buffer, but reserve policy involves trade-offs. Releases can add supply during emergencies and reduce the severity of price spikes. They also reduce the stock available for a later, potentially worse disruption. The 2026 crisis had already required government stock releases, according to IEA estimates. Policymakers must therefore weigh immediate price relief against the strategic value of preserving inventories.
Why the EIA Can Forecast Lower Prices Even as Brent Jumps
The EIA’s July Short-Term Energy Outlook projected that Brent would average about $74 a barrel in the third quarter of 2026 and fall toward a $70 average in the fourth quarter. At first glance, that forecast appears inconsistent with Brent trading near $88 on July 29. It is not necessarily inconsistent. A quarterly average is a scenario-dependent forecast, while an intraday futures price reflects the information and positioning of a specific moment.
The EIA outlook assumes increasing oil supply, moderating inventory draws and a gradual return toward a better-supplied market. Its forecast also reflects the demand destruction created by months of high prices and restricted fuel availability. The agency expects global consumption to fall in 2026, particularly in non-OECD economies that have been heavily affected by the Hormuz crisis.
A forecast of lower average prices can coexist with repeated spikes if those spikes are brief. Brent could spend several days above $90, retreat after a ceasefire, and still average in the mid-$70s over a quarter. The forecast would fail, however, if the assumptions behind recovery are wrong. A renewed closure of the strait, sustained damage to Saudi or Gulf infrastructure, or prolonged disruption to refineries could keep prices above the EIA’s path.
The gap between the forecast and the current price therefore functions as a map of assumptions. The lower forecast assumes de-escalation, greater production, improving flows and weaker demand. The higher spot price reflects immediate doubt about those assumptions. Neither is a guarantee. Businesses using energy forecasts should model both the central case and plausible stress cases rather than treating one published number as a budget certainty.
That is especially important for companies with thin margins. An airline, trucking business or chemical producer may be unable to absorb a $15-per-barrel forecasting error without changing fares, surcharges, production schedules or hedging. A producer, by contrast, may generate substantial incremental cash flow from the same price difference. The macroeconomic average conceals very different company-level outcomes.
Oil Prices and Inflation: The Transmission Is Fast but Uneven
Energy affects inflation through direct and indirect channels. The direct channel appears in gasoline, heating fuel, natural gas and electricity. The indirect channel runs through freight, aviation, agriculture, plastics, chemicals, packaging and the cost of operating energy-intensive facilities. The direct effect can reach consumers within days or weeks. The indirect effect often takes longer and depends on contracts, inventories and the ability of companies to raise prices.
The latest U.S. inflation data illustrate both the relief that lower monthly energy prices can provide and the damage that an earlier shock can leave behind. The Bureau of Labor Statistics reported that the consumer energy index fell 5.7% in June from May, the largest monthly decline since April 2020. Gasoline fell 9.7% during the month. Those decreases helped cool the monthly headline index.
Year over year, the picture was very different. Consumer energy prices were 15.7% higher than in June 2025, and gasoline was up 26.7%. The overall Consumer Price Index rose 3.5% over the year, while the index excluding food and energy increased 2.6%. The contrast shows why central bankers do not focus solely on one month’s gasoline decline. The level of energy costs remained substantially higher than a year earlier even after the June retreat.
A renewed rise in crude does not pass through one-for-one to retail gasoline. Refining margins, taxes, distribution costs, seasonal fuel specifications, local competition and inventories all matter. Crude is nevertheless the largest variable cost over time. If Brent and WTI remain elevated, wholesale gasoline and diesel prices generally face upward pressure.
The speed of pass-through also differs by sector. Airlines may hedge part of their fuel exposure, but hedges expire and rarely cover all consumption. Trucking contracts may include fuel surcharges that shift some costs to shippers with a lag. Chemical companies may use formulas tied to feedstock benchmarks. Retailers may negotiate annual freight agreements that delay the effect. Small businesses without hedging programs or bargaining power often feel the shock more quickly.
Inflation expectations create a second-order risk. If households and businesses expect energy prices to remain high, workers may seek larger wage increases and companies may raise prices preemptively. Central banks worry about that process because it can make a temporary supply shock more persistent. Evidence of one oil rally is not enough to prove expectations are becoming unanchored, but repeated stop-start spikes make the task more difficult.
There is also a growth trade-off. Higher energy prices reduce real household income because consumers must spend more on transportation and utilities. That leaves less money for restaurants, travel, entertainment and discretionary goods. Businesses face higher operating costs at the same time. The result can resemble stagflation: weaker growth combined with higher inflation. The severity depends on the duration of the shock and the economy’s energy intensity.
Inflation Snapshot
What June U.S. data showed before the latest oil rebound
- Headline CPI: up 3.5% over the 12 months through June 2026.
- Core CPI: up 2.6% over the same period.
- Energy: down 5.7% in June from May, but up 15.7% from a year earlier.
- Gasoline: down 9.7% in June from May, but up 26.7% year over year.
- Implication: the monthly energy relief was real, but the annual burden remained high before July’s renewed volatility.
Original source: U.S. Bureau of Labor Statistics, Consumer Price Index, June 2026
The Federal Reserve’s July Decision Became Harder to Read
The Federal Reserve’s July meeting was unusual because markets did not enter it with the near-certainty that often surrounds a policy decision. The target range was 3.50%–3.75%, and a Reuters survey conducted before the meeting found all 104 economists expected no change. Market pricing was less settled. By the morning of July 29, traders were assigning roughly a one-in-three probability to a quarter-point increase, according to Reuters reporting.
The uncertainty reflected a tension between recent inflation improvement and the risk that energy costs would reignite price pressure. Core CPI was unchanged in June from May, a favorable signal. Headline energy prices fell sharply. Yet the annual inflation rate remained above the Fed’s 2% objective, gasoline was far more expensive than a year earlier, and the oil market was again responding to war.
Fed Chair Kevin Warsh added to the uncertainty by providing less explicit forward guidance than markets had become accustomed to under previous leadership. Reuters reported that officials were divided at the prior meeting and that some regional Fed presidents had signaled support for higher rates. President Trump, meanwhile, continued to argue for lower borrowing costs. The combination of internal disagreement, political pressure and a fresh energy shock increased the importance of the statement’s wording and Warsh’s press conference.
The Federal Reserve’s official calendar confirms that the FOMC met on July 28 and 29. The decision was scheduled for 2:00 p.m. Eastern Time and the press conference for 2:30 p.m. Because this article’s cutoff preceded both events, any claim that the Fed had held, raised or cut rates would have been premature.
Oil affects the Fed through several competing channels. Higher prices can lift headline inflation and inflation expectations, supporting a case for tighter policy. They can also weaken growth and consumer spending, supporting caution. Monetary policy cannot produce more crude oil or reopen a shipping lane. Raising rates in response to a supply shock can restrain demand, but it may also deepen the economic slowdown caused by the shock.
Central banks therefore focus on persistence and spillovers. A brief price spike that reverses after diplomacy may have limited policy significance. A multi-month increase that feeds wages, transportation contracts and broad business pricing is more serious. The Fed will also distinguish between current inflation and expected future inflation. Market-based measures, consumer surveys and company pricing behavior may be more important than one day’s futures move.
The political context raises the stakes. Trump’s calls for lower rates could make any Fed decision appear politically charged. A surprise increase might be interpreted as a demonstration of independence, while a hold could be criticized as insufficiently aggressive against inflation. Neither interpretation would necessarily describe the committee’s actual reasoning. The relevant evidence remains the official statement, vote, economic assessment and press-conference explanation.
What Higher Oil Means for U.S. Consumers
For households, gasoline is the most visible transmission mechanism. Prices displayed at service stations change more frequently than most consumer prices, and drivers can observe the increase directly. The burden is regressive because lower-income households generally spend a larger share of income on energy and often have less flexibility to work remotely, buy a more efficient vehicle or absorb a long commute.
Regional differences are substantial. States with longer driving distances, limited public transportation and higher fuel taxes can experience a greater cash-flow effect. Rural households may face both higher commuting costs and higher prices for delivered goods. Urban households may be less exposed to gasoline but more exposed to public-transport fares, utilities or food-delivery charges.
The timing also matters. Late July falls within the U.S. summer driving season, when gasoline demand is typically elevated. Refinery outages, hurricane risks or product-pipeline constraints can amplify the effect of crude prices. A stable refinery system can cushion the shock; a simultaneous product-market disruption can make retail prices rise faster.
Air travel is another channel. The June CPI report showed airline fares 26.5% higher than a year earlier, reflecting a market already affected by fuel costs and constrained operations. Airlines do not set fares solely from current jet-fuel prices, but sustained increases affect route profitability and capacity decisions. Business travelers may see higher fares first on routes with strong demand and limited competition.
Consumers also feel energy inflation through goods that appear unrelated to petroleum. Plastic packaging, synthetic fibers, fertilizers, delivery services and refrigerated logistics all use energy or hydrocarbon feedstocks. A grocery product may become more expensive because of farm diesel, processing electricity, packaging resin and trucking rather than because the commodity itself became scarce.
The key question is how long the increase lasts. Households can absorb a temporary spike with savings or reduced discretionary spending. A sustained rise forces larger changes: fewer trips, delayed purchases, lower restaurant spending or increased credit use. Those choices then affect corporate revenues outside the energy sector.
Corporate Winners Are Not Automatically Economy-Wide Winners
Higher oil prices tend to benefit upstream producers, but the relationship is more complicated than a simple “energy stocks up” rule. A producer with unhedged output, low operating costs and reliable transportation can earn more cash from higher benchmark prices. A producer with damaged infrastructure, rising security costs or unfavorable hedges may not receive the full benefit.
Integrated oil companies combine production, refining, chemicals and marketing. The upstream division may gain while refining or chemical margins move differently. Refiners can benefit when product prices rise faster than crude, but they can be squeezed when crude input costs increase faster than gasoline or diesel. The IEA’s report of elevated product cracks in early July suggests that refining economics were already unusually strong in some regions, yet those margins can reverse quickly as runs recover or demand weakens.
Oilfield-service companies may benefit if producers increase drilling and maintenance. The effect depends on the expected duration of the price increase. Producers are unlikely to commit to multi-year projects because of a one-week spike. Sustained higher prices and confidence in export access are more important than the headline benchmark alone.
Midstream companies that operate pipelines, storage and terminals can gain from higher utilization or demand for alternative routes. They may also face operational and security risks. A pipeline that bypasses Hormuz becomes strategically valuable, but that value is meaningful only if the pipeline has available capacity, connected supply and secure export terminals.
For the broader economy, higher energy-sector earnings do not offset the full cost imposed on consumers and energy users. The United States produces more oil than it did during earlier geopolitical shocks, so some income is transferred to domestic producers rather than entirely abroad. Even so, consumers face higher prices immediately, while producer investment and wage benefits are concentrated geographically and may arrive later.
This uneven distribution helps explain why stock indexes can react ambiguously. Energy shares may rise while airlines, transports, retailers or industrial companies fall. A broad index can remain flat if gains in one group offset losses elsewhere. That does not mean the shock is economically neutral.
Airlines, Shipping and Trucking Face Different Fuel Risks
Transportation companies are often grouped together, but their exposure differs by fuel, contract structure and ability to pass through costs. Airlines consume jet fuel and operate networks in which route economics can change materially with a modest move in fuel. Some carriers hedge, some hedge selectively and others remain largely exposed. Hedges can protect cash flow, but they can also create losses when prices fall and can never eliminate operational disruption from closed airspace or route changes.
Commercial shipping faces fuel costs, insurance and route risk. War-risk insurance premiums can increase rapidly after attacks, adding costs even when a vessel completes its voyage safely. Ships may sail longer routes to avoid conflict zones, consuming more fuel and reducing effective fleet capacity. A tanker that spends more days in transit cannot carry as many cargoes per year.
The Red Sea and Bab el-Mandeb create a second layer of vulnerability. Saudi Arabia can move some crude westward by pipeline to Red Sea ports, partly bypassing Hormuz. If Houthi attacks or a blockade make the southern Red Sea more dangerous, the value of that bypass is reduced. The system’s routes are interconnected: pressure at one chokepoint can shift traffic toward another that is also under threat.
Trucking companies generally use fuel surcharges, but the formulas vary and often operate with a lag. Large carriers may recover much of a sustained diesel increase from shippers. Small fleets and independent operators may face a cash-flow squeeze before surcharges adjust. Shippers then decide whether to absorb the increase, raise prices or reduce volumes.
Railroads are more fuel-efficient per ton-mile than trucks and may gain relative appeal for suitable freight, but they cannot replace all trucking. Ports, warehouses and final delivery still depend heavily on diesel. Congestion or rerouting can also create costs that are not captured by the oil benchmark.
Manufacturing, Chemicals and Agriculture See the Shock Through Margins
For manufacturers, energy is both a direct input and a cost embedded in purchased materials. Metals, glass, cement, paper and food processing can be energy intensive. Companies with fixed-price sales contracts may be unable to raise prices quickly, so higher costs reduce margins. Companies with strong market power or indexed contracts can pass through more of the increase.
Petrochemical producers face a complex relationship with crude. Naphtha-based plants are highly sensitive to oil prices, while U.S. facilities using natural-gas liquids may gain a relative feedstock advantage if domestic gas prices do not rise as quickly. That can improve U.S. competitiveness in some chemical chains even as global demand weakens.
Agriculture is exposed through diesel, fertilizer, transport and drying. Fertilizer production is particularly sensitive to natural gas, but oil-market disruptions can affect shipping and feedstocks as well. Farmers often purchase inputs months in advance, which delays the effect. The shock may appear later in planting decisions, crop margins and food prices.
Packaging creates another broad transmission path. Many consumer products rely on plastic resins derived from hydrocarbons. When resin, freight and electricity costs rise together, manufacturers may redesign packages, reduce promotions or raise prices. Those changes are rarely attributed to one oil headline, but they are part of the cumulative inflation process.
The most vulnerable companies share several characteristics: thin gross margins, high transport intensity, low bargaining power, limited hedging and short cash runways. Larger companies may be able to negotiate contracts, hold inventory or finance temporary losses. Smaller businesses often cannot.
Why Asia Carries a Disproportionate Share of the Risk
Asian economies receive most of the crude and condensate that normally moves through Hormuz. That physical dependence makes the region especially sensitive to disruptions in Gulf exports, but the impact varies according to import mix, strategic inventories, refining capacity, currency strength and government fuel policies.
China and India are large buyers with diversified suppliers and significant negotiating power, yet their absolute import needs are enormous. Japan and South Korea have sophisticated refining systems and strategic stocks, but limited domestic crude production. Smaller Asian economies may have less inventory, weaker currencies and fewer alternatives. A dollar-denominated oil increase can be amplified when the local currency depreciates.
A July 29 Indonesian financial-market segment noted weakness in the Jakarta Composite Index and pressure on the rupiah during the morning session. Those figures were an intraday snapshot rather than a closing result, and they should not be treated as a final daily performance. The broader economic logic is nonetheless clear. Indonesia is a major coal exporter and an oil-and-gas producer, but it also imports petroleum products. Higher crude can support parts of the commodity sector while increasing fuel-import costs, subsidy pressure and inflation risk.
Currency effects can become self-reinforcing. An oil-importing country needs more dollars to buy the same volume when crude rises. That can weaken the local currency, making the dollar price of oil even more expensive domestically. Central banks may respond with tighter policy or foreign-exchange intervention, both of which can weigh on growth.
Governments sometimes shield consumers through price controls or subsidies. Such measures can reduce immediate inflation but transfer the cost to public finances or state-owned energy companies. If the shock persists, policymakers must choose among larger deficits, higher administered prices, reduced consumption or lower spending elsewhere.
Asian refiners can also face a quality problem. Crude grades are not interchangeable without cost. A refinery designed for medium sour Gulf crude may not be able to replace it efficiently with a light sweet barrel from another region. Substitution can lower yields, require blending or increase freight costs. The headline global supply number therefore overstates the ease of replacement.
The Dollar, Bonds and Gold Do Not Always Follow a Simple War Playbook
Geopolitical stress is often associated with a stronger U.S. dollar, lower Treasury yields and higher gold prices. In practice, the relationships depend on the nature of the shock and the monetary-policy response. An oil-driven inflation shock can push bond yields higher if investors expect tighter policy, even while risk aversion supports demand for government debt. The dollar can benefit from safe-haven demand but may also react to changes in expected Fed policy and U.S. growth.
Gold faces the same crosscurrents. It can gain from geopolitical risk and concern about currency stability. It can be pressured by higher real interest rates or a stronger dollar. The automated transcript of the Indonesian segment included a garbled gold price that was not reliable enough to use. Automated transcription appears to have dropped digits and confused the discussion of rate probabilities. The appropriate conclusion is not to repair the number by guesswork, but to exclude it unless verified against a dependable market source.
This illustrates a broader fact-checking principle. Commodity broadcasts often present several markets in rapid succession, and automated transcripts can mishear “Brent” as “brand,” omit decimal points or confuse a probability of a rate increase with a probability of a cut. The oil figures in the segment were broadly consistent with contemporaneous market reporting, but other numbers required independent confirmation.
For investors and businesses, cross-asset signals are most useful when interpreted together. Rising oil, a stronger dollar and higher inflation-compensation measures would suggest a stagflationary concern. Rising oil alongside falling bond yields and weak equities could indicate a growth scare. Rising energy shares with stable broader indexes might indicate sector rotation rather than generalized panic.
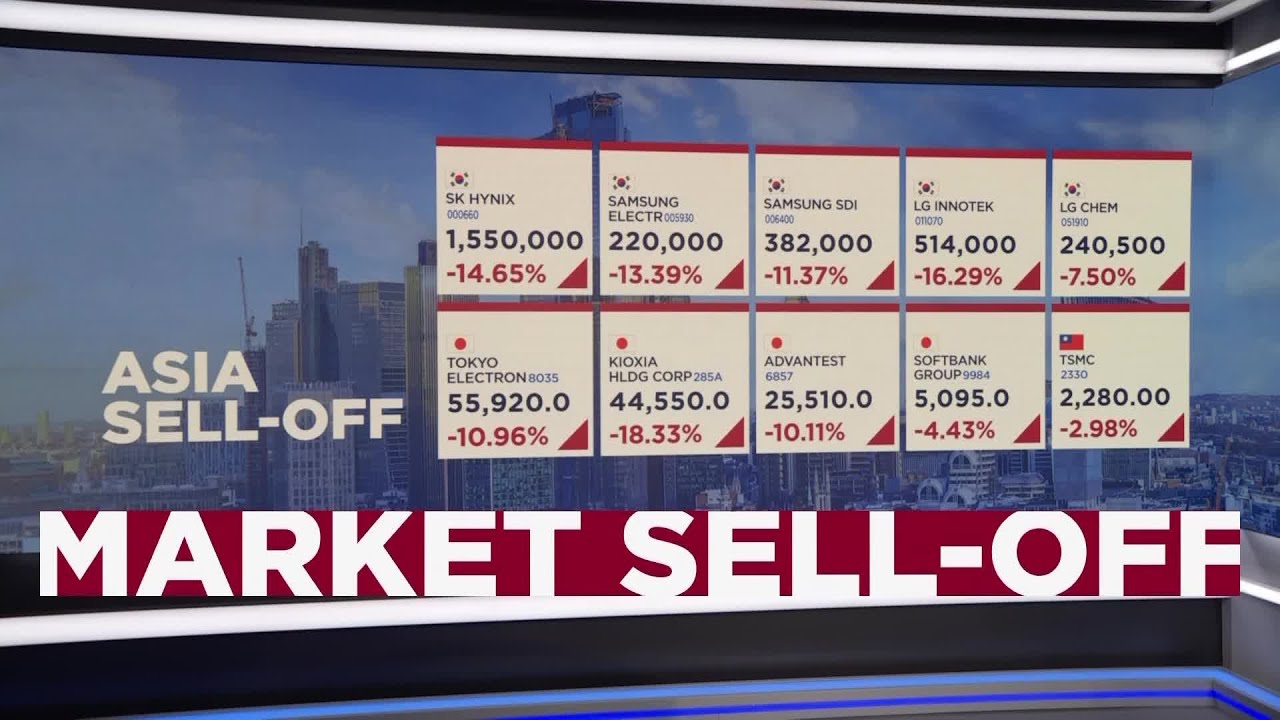
No single indicator proves the market’s interpretation. Prices also reflect positioning, liquidity and unrelated earnings news. On July 29, global markets were simultaneously processing a semiconductor sell-off, major corporate results and the pending Fed decision. Attributing every move to Iran would overstate the evidence.
Coal Prices: Related Energy Sentiment, Different Fundamentals
The same market segment also discussed thermal coal futures near $130 a metric ton and concerns about Indonesian supply. Coal can rise alongside oil because both are energy commodities and because high oil prices can lift the cost of mining and transport. Yet coal has its own supply-and-demand balance, and the two prices do not move mechanically together.
Indonesia is the world’s largest exporter of thermal coal, making disruptions to river transport and mine logistics potentially significant. The broadcast attributed recent tightness to dry conditions affecting navigation on the Barito River in Kalimantan and said some mining companies had declared partial force majeure. Those claims were not accompanied by a primary document in the available reporting and were not central to the verified oil story, so they should be treated as reported market commentary rather than confirmed facts.
Chinese demand is a separate influence. High inventories, domestic production and cautious utility purchasing can limit import demand even when Indonesian logistics tighten. Coal prices therefore reflect a tug of war between supply disruption and demand restraint. An oil rally can improve sentiment across energy markets, but it cannot by itself overcome weak coal consumption.
Substitution between oil and coal is also limited in the short run. Most modern power plants cannot simply switch from one fuel to the other. Oil-to-coal substitution is more relevant in certain industrial processes or countries with flexible generation, and even there environmental rules and equipment constraints matter. The claim that coal will automatically “follow” oil should therefore be understood as a loose market relationship, not a physical law.
The more important connection is macroeconomic. A broad increase in oil, coal and gas raises the cost of electricity, transport and industrial production. That can worsen inflation and reduce demand, eventually pushing commodity prices lower. Energy rallies can contain the seeds of their own reversal when they become severe enough to destroy consumption.
Shipping Insurance May Matter as Much as the Oil Benchmark
A barrel cannot reach a refinery if no vessel is willing or insured to carry it. War-risk insurance therefore acts as a price on geopolitical danger. Premiums can change daily based on attacks, vessel type, ownership, route and the perceived ability of naval forces to provide security.
When premiums rise, the effect spreads beyond the ship owner. Charter rates increase, cargo sellers demand different terms, and buyers may seek alternative origins. Longer voyages tie up tankers and reduce effective fleet supply. A barrel from the Atlantic Basin may be available, but moving it to Asia can take more time and cost more than a Gulf barrel.
The interaction between Hormuz and Bab el-Mandeb is especially important. Saudi Arabia’s East-West pipeline can move crude to Red Sea terminals, allowing some exports to bypass Hormuz. Those cargoes still need a safe route through the southern Red Sea to reach Asian markets efficiently. If Houthi activity restricts Bab el-Mandeb, ships may have to travel around the Cape of Good Hope, adding time and fuel.
Route changes also affect refined products and container shipping. Tankers compete within their own vessel classes, but congestion, port security and naval restrictions can influence broader maritime logistics. Manufacturers that rely on just-in-time deliveries may face delays even if the direct energy cost remains manageable.
This is why tanker movements can be a better real-time gauge than oil prices alone. Prices can respond to rumors and positioning, while vessel counts show whether trade is actually moving. Useful indicators include the number of transits, waiting vessels, loading schedules, charter rates, insurance quotes and the spread between prompt and later oil futures.
What the Futures Curve Can Reveal
The shape of the oil futures curve provides information about perceived tightness. In backwardation, near-term contracts trade above later contracts, often indicating that buyers value immediate supply more highly. In contango, later contracts trade above near-term prices, which can encourage storage.
A geopolitical shock that threatens prompt deliveries may steepen backwardation even if long-dated prices move less. That pattern would suggest the market expects a near-term disruption but not a permanent loss of supply. If long-dated prices also rise substantially, traders may be reassessing investment, spare capacity and the long-run security of the region.
Time spreads should still be interpreted carefully. Refinery maintenance, contract expirations, quality differences and storage constraints can influence the curve. A strong front-month contract is not proof of physical shortage, but it becomes more persuasive when combined with inventory draws, high freight rates and limited tanker traffic.
Crude differentials offer another clue. Middle Eastern grades may strengthen relative to Brent if buyers compete for scarce cargoes, or weaken if they cannot be exported. Atlantic Basin grades may gain as Asian refiners seek replacements. Product cracks can reveal whether the bottleneck is in crude supply or refining capacity.
For corporate risk managers, these details matter because the benchmark quoted in the news may not match the company’s actual exposure. An airline buys jet fuel, not WTI. A European refinery may purchase a specific sour crude. A trucking company pays retail diesel. Hedging the wrong benchmark leaves basis risk even when the hedge appears directionally correct.
Oil Exporters and Importers Experience Opposite Fiscal Pressures
An oil shock redistributes income among countries as well as companies. Exporters receive more revenue per barrel if they can maintain production and ship the oil. Importers pay more for the same quantity and may see their trade balances deteriorate. The headline benchmark does not reveal whether a particular country is gaining or losing because volume, currency and government policy matter.
For an exporter with secure infrastructure, higher prices can increase tax receipts, royalties and state-company dividends. Governments may use the windfall to support budgets, replenish reserves or finance social spending. The benefit can disappear when the conflict prevents exports. A country cannot monetize a high benchmark if its crude is shut in, its terminal is damaged or tankers cannot arrive.
Saudi Arabia illustrates the tension. Higher prices support revenue on barrels that reach market, but attacks on facilities, military spending and shipping constraints create costs. The East-West pipeline provides strategic flexibility, yet Red Sea security limits the value of the route. Fiscal benefit and national-security risk rise together.
Importers face a terms-of-trade shock. More export income must be transferred abroad to obtain energy, reducing national purchasing power. The current account can weaken, the currency can depreciate and inflation can rise. Central banks may be forced to maintain higher interest rates even as growth slows.
Countries with regulated fuel prices initially hide the shock from consumers. The government or a state oil company absorbs the gap between import cost and retail price. That can stabilize inflation and public sentiment for a time. It also increases subsidy bills and borrowing needs. If the shock persists, authorities may eventually raise administered prices, producing a delayed but concentrated inflation increase.
Foreign-exchange reserves become important for emerging markets. A country that must buy more dollars for oil may use reserves to smooth currency depreciation. Reserves are finite, and markets may become concerned if intervention is rapid. Higher global interest rates can compound the problem by attracting capital toward dollar assets.
Energy intensity determines the growth effect. Economies that use more oil for each unit of output face a larger burden. Public transport, vehicle efficiency, domestic refining and access to alternative fuels can reduce exposure. Structural improvements made during earlier oil shocks can therefore provide meaningful resilience.
Trade relationships also shift. Asian refiners seeking alternatives may buy more crude from the United States, Brazil, Guyana or West Africa. That supports exporters outside the Gulf but increases voyage distances and freight demand. European buyers may then compete for barrels previously sold within the Atlantic Basin.
Refining capacity can turn an importing country into a product exporter and partially offset the crude bill. A sophisticated refinery can buy discounted grades, process them and sell higher-value products. During the present crisis, however, crude quality and shipping constraints reduce the availability of those arbitrage opportunities.
For the United States, the effect is mixed. Domestic oil production and exports mean higher prices support producers, employment and tax revenue in energy regions. Households and fuel-consuming industries still pay more. The country is less vulnerable to a pure import shock than it was decades ago, but it is not insulated from global prices.
Europe is exposed through oil, gas, shipping and manufacturing. Some countries have strategic stocks and diversified supply, while energy-intensive industries already face high structural costs. A renewed Middle East shock can weaken industrial competitiveness and complicate the European Central Bank’s inflation outlook.
China and India have large refining systems, strategic relationships and the scale to negotiate supply, but they also import enormous volumes. Their policy choices affect the global market. Subsidies, reserve releases, refinery run cuts and direct negotiations with regional actors can change demand and shipping patterns.
The fiscal consequences can outlast the commodity spike. Exporters may commit windfall revenue to permanent spending that becomes difficult to sustain when prices fall. Importers may accumulate debt to fund subsidies. A temporary oil shock can therefore leave a durable budget legacy on both sides.
This international redistribution is one reason global growth can weaken even when exporters gain. Importing households often reduce spending quickly, while exporting governments may save part of the windfall. The result can be a net decline in global demand. Higher oil is not merely a transfer with no macroeconomic effect; the different spending behavior of winners and losers matters.
Four Scenarios for Oil Prices and the Wider Economy
Scenario 1: Rapid De-escalation and Restored Shipping
In the most benign scenario, Oman or another mediator revives negotiations, missile and drone activity subsides, and ships resume using agreed routes through Hormuz. Insurance premiums fall, delayed cargoes move and Gulf producers restart more capacity. The geopolitical risk premium would likely decline quickly.
This scenario aligns broadly with the EIA’s expectation that supply growth and weaker demand will push Brent lower over the remainder of 2026. It would reduce pressure on gasoline, freight and inflation expectations. The Fed could focus more on core inflation and labor-market conditions rather than an escalating energy shock.
The main limitation is that reopening is not instantaneous. Mines, damaged navigation systems, port congestion and contract disputes can delay normalization. Refineries may need time to restart, and inventories depleted during the crisis must be rebuilt. Prices could therefore remain volatile even after a political agreement.
Scenario 2: Stop-Start Conflict With No Major Infrastructure Loss
This is the pattern visible in July: pauses in strikes produce sharp price declines, followed by renewed attacks and equally rapid rallies. Physical flows remain depressed but do not collapse completely. Brent trades in a wide range, with analysts cited by Reuters describing a possible near-term band of roughly $80 to $100 a barrel.
For businesses, this scenario is difficult because volatility complicates budgeting and hedging. A company that locks in fuel after a spike may regret the decision if diplomacy succeeds. A company that remains unhedged may face a sudden cost increase after the next attack. The optimal response depends on cash flow, margin tolerance and the ability to pass costs through.
Macroeconomically, repeated spikes can be more damaging than one brief event because they keep inflation expectations elevated and discourage investment. Consumers may postpone purchases, while companies maintain larger inventories or expensive contingency routes.
Scenario 3: Sustained Damage to Gulf Energy Infrastructure
A successful attack on a major processing plant, export terminal, pipeline or refinery would shift the market from probability to physical loss. The price response would depend on the facility, the volume affected and the expected repair time. Damage to a bottleneck can matter more than damage to an individual well because many fields may rely on the same processing or export system.
Strategic reserves and spare capacity outside the region could cushion the shock, but the replacement would be imperfect. Product prices could rise faster than crude if refineries were affected. Governments might introduce emergency conservation measures, subsidies or reserve releases.
The inflation effect would become more persistent, increasing the risk of tighter monetary policy and weaker growth. Energy producers outside the conflict zone would benefit from higher prices, but transport and industrial sectors would face significant margin pressure.
Scenario 4: Simultaneous Constraints at Hormuz and Bab el-Mandeb
This is the most severe plausible scenario because it would undermine both the main Gulf outlet and part of the alternative Red Sea route. Saudi pipeline bypass capacity would be less useful for Asia if ships could not pass Bab el-Mandeb safely. Cargoes might need to travel around Africa, tying up vessels and increasing fuel, insurance and financing costs.
The disruption would affect crude, refined products and potentially LNG. Asian importers would compete aggressively for Atlantic Basin supply. Freight rates and regional price differentials could become more important than the headline Brent contract.
Such a scenario would likely prompt coordinated government action, including reserve releases, naval protection, demand restraint and diplomatic pressure. The economic damage would extend beyond energy into trade, manufacturing and food prices. It is not the base case, but the latest combination of Saudi facility attacks, Hormuz disputes and Houthi activity means it cannot be dismissed.
| Scenario | Physical supply | Likely market character | Main business effect |
|---|---|---|---|
| Rapid de-escalation | Flows improve gradually | Risk premium falls | Fuel and inflation pressure eases |
| Stop-start conflict | Restricted but not collapsed | Wide range and frequent reversals | Budgeting and hedging become difficult |
| Infrastructure damage | Measurable production or refining loss | Higher and more persistent prices | Margin compression and policy response |
| Dual-chokepoint disruption | Gulf and Red Sea routes constrained | Severe freight and regional dislocation | Broad trade, inflation and growth shock |
Why Demand Destruction Is the Market’s Harshest Stabilizer
When supply cannot respond quickly, high prices reduce consumption. Economists call this demand destruction, but the phrase can sound abstract. In practice, it means households drive less, airlines cut marginal routes, factories reduce output, governments subsidize less fuel and businesses postpone investment.
The 2026 crisis had already produced evidence of this process. The EIA projected global oil consumption would decline during the year, with much of the reduction in non-OECD countries. The IEA also documented sharp declines in demand during the most severe months of the disruption. High prices and limited availability forced adjustment.
Demand destruction can cap oil prices, but it is not a benign solution. It stabilizes the commodity market by weakening the economy. A price forecast that falls because consumers can no longer afford fuel is different from one that falls because supply became abundant.
The distributional impact is also unequal. Wealthier consumers may absorb higher fuel costs without changing behavior. Lower-income households, small businesses and emerging economies often reduce consumption first. That makes the global demand response faster in places with less fiscal capacity to subsidize energy.
For producers, demand destruction creates a ceiling. A high price encourages investment and increases current revenue, but it can accelerate efficiency, substitution and policy intervention. Producers therefore have an interest in prices high enough to support revenue but not so high that they trigger a recession or permanent demand loss.
Historical Comparisons Help, but the 2026 Shock Is Distinct
Oil-market commentary often invokes the 1973 embargo, the 1979 Iranian Revolution, Iraq’s 1990 invasion of Kuwait, the 2008 price surge or Russia’s 2022 invasion of Ukraine. Each episode offers lessons, but none is a perfect template.
The 1970s shocks occurred in a more oil-intensive global economy with less flexible monetary policy frameworks and different strategic-stock arrangements. The 1990 shock involved a large, identifiable production loss that was partly offset by other producers. The 2008 peak combined supply constraints with strong global demand before the financial crisis destroyed consumption. The 2022 shock centered on sanctions, trade rerouting and refined-product dislocation rather than a complete closure of Hormuz.
The 2026 crisis is distinctive because it combines direct attacks, contested maritime control, major production shut-ins, tanker restrictions and threats to more than one chokepoint. It also occurs in an economy with large U.S. shale output, extensive strategic reserves, advanced commodity derivatives and a faster information cycle. Those features improve resilience in some ways and amplify price volatility in others.
Historical experience suggests that markets adapt. Trade routes change, production recovers, efficiency improves and demand responds. It also shows that adaptation can be expensive and politically destabilizing. The relevant lesson is not that prices must repeat a past pattern, but that duration and physical disruption matter more than the initial headline.
What Businesses Should Monitor Instead of Reacting to Every Headline
Executives and investors need a disciplined set of indicators because the news flow is likely to remain noisy. The most useful signals fall into five groups.
1. Physical shipping activity
- Daily tanker transits through Hormuz and Bab el-Mandeb.
- Vessels waiting to load or unload.
- Changes in routes, voyage duration and port congestion.
- Official maritime advisories and security restrictions.
2. Production and refining
- Confirmed outages at fields, processing plants, refineries and terminals.
- Restart schedules and evidence that output has actually resumed.
- Gulf export nominations and loading programs.
- Refinery utilization and product cracks for gasoline, diesel and jet fuel.
3. Inventories
- Official EIA crude, gasoline and distillate stocks.
- OECD commercial inventories and government reserve releases.
- Oil on water versus accessible onshore stocks.
- Regional inventories near major consuming centers.
4. Market structure
- Brent and WTI time spreads.
- Regional crude differentials.
- Tanker rates and war-risk insurance.
- Options-implied volatility and demand for upside protection.
5. Diplomacy and policy
- Whether Oman’s mediation produces an enforceable navigation agreement.
- U.S., Iranian, Saudi and Iraqi official statements backed by observable action.
- Strategic-reserve decisions and emergency fuel policies.
- Federal Reserve communication on energy-driven inflation.
The hierarchy matters. A dramatic statement unsupported by changes in shipping or production may have a short-lived price effect. A quiet operational notice confirming that a terminal is offline may have a larger and more durable impact.
What Is Confirmed, What Is Attributed and What Remains Uncertain
Fast-moving military and commodity stories require an unusually clear separation between facts and claims. The oil-price move is directly observable. The Reuters price data provide the benchmark, percentage change and timestamp. The Federal Reserve’s meeting schedule and entering policy rate are also official public information. The EIA, IEA and BLS data used in this article are published statistics or agency estimates with defined reporting periods.
The military account is more complex. CENTCOM officially stated that U.S. and Saudi aircraft struck logistics and weapons sites in eastern Iraq and attributed more than 30 drone attacks over 72 hours to groups directed by the IRGC. That establishes the U.S. military’s position and confirms that the United States publicly acknowledged the strikes. It does not independently prove every attribution, casualty estimate or description of the targets.
Saudi Arabia publicly said drones targeted petroleum facilities and that its defenses intercepted them. Iraqi militias denied involvement in some attacks. The appropriate formulation is therefore that Saudi Arabia accused Iran-backed groups of targeting its facilities, while accused groups disputed responsibility. The existence of competing claims should not be collapsed into certainty.
Iran acknowledged launching missiles at U.S. installations, according to Reuters and the Associated Press. U.S. and Jordanian authorities said the missiles were intercepted. The available reporting did not establish that the latest barrage caused damage or casualties. That distinction is economically relevant because an attempted attack raises future risk, while a successful strike on infrastructure creates an immediate physical loss.
The condition of Saudi petroleum facilities also remained uncertain. Saudi statements said drones were destroyed. No verified production loss had been reported by the research cutoff. Oil prices therefore reflected the possibility of future disruption more than a confirmed reduction in Saudi output from the latest attacks.
The Strait of Hormuz dispute was better documented at the diplomatic level. Iran rejected Oman’s joint-management proposal, according to a senior Iranian official quoted by Reuters. The precise operational control of every lane and the legal status of competing routing instructions remained contested. Traders responded to the practical question—whether vessels could pass safely—rather than waiting for the dispute to be resolved under international law.
The API inventory decline was an attributed market report, not official government data. The transcript’s gold figure was visibly corrupted and was excluded. The coal logistics claims were not independently established through a primary document in the supplied material. This selective approach is essential: a long article becomes less reliable, not more authoritative, when uncertain transcript details are repeated merely to add breadth.
Risks to the Bullish Oil Interpretation
The strongest argument for higher oil is straightforward. The conflict again threatens Saudi infrastructure and U.S. positions, tanker traffic remains constrained, Hormuz diplomacy has stalled, U.S. inventories are not unusually high, and the global supply recovery is incomplete. If any major facility is damaged, the market could tighten quickly.
A credible skeptical interpretation begins with demand and adaptation. The EIA expects supply to increase and global consumption to weaken. June demonstrated that exports can recover rapidly when shipping conditions improve. High prices have already reduced demand, and non-Gulf producers have an incentive to sell more. Strategic reserves, pipeline bypasses and rerouting provide partial protection.
Positioning can also exaggerate short-term moves. Oil fell almost 5% on Tuesday and rose almost 5% on Wednesday. Much of the second move reversed the first. That pattern is consistent with a market repricing headlines rather than discovering a new, confirmed multi-million-barrel outage. If no infrastructure damage emerges and talks resume, Wednesday’s gain could fade.
The current price already includes some expectation of disruption. A trader buying after a sharp rally is not buying an undiscovered risk; the risk is visible and partly priced. Further gains require either a worse physical outcome or a stronger reassessment of duration. Conversely, de-escalation can remove the premium rapidly.
There is a second bearish mechanism: recession. If energy prices remain high enough to weaken transport, manufacturing and consumer spending, oil demand will fall. The market can move from scarcity to demand destruction. That outcome would not be good for the economy even if it eventually lowered crude prices.
Finally, the U.S. dollar matters. A stronger dollar can weigh on commodity demand outside the United States because oil becomes more expensive in local currencies. It can also tighten financial conditions in emerging markets. The same geopolitical shock that supports oil through supply risk may restrain it through currency and growth channels.
Risks to the Bearish or De-escalation Interpretation
The main risk to a lower-price forecast is that it relies on political and operational normalization. The EIA’s quarterly averages assume the market moves toward oversupply. That path can be interrupted by a single successful attack on a critical processing plant or export terminal. The more infrastructure is concentrated, the larger the potential effect of one failure.
Bypass capacity is limited. Saudi and UAE pipelines cannot replace normal Hormuz volumes, and the Red Sea route has its own security risk. If both corridors are constrained, Atlantic Basin supply cannot arrive quickly enough to prevent sharp regional dislocations.
Inventory quality creates another risk. Aggregate global stocks may appear adequate, but barrels can be in the wrong place, the wrong grade or still at sea. Product inventories may be tighter than crude. A refinery needing sour crude or a market short of diesel cannot necessarily solve the problem with a headline increase in light crude stocks elsewhere.
Government reserves are finite. Repeated releases reduce the cushion available for later escalation. Political reluctance to draw stocks at low levels could make the next response smaller. Rebuilding reserves can itself support demand after the crisis.
War-risk insurance and crew availability can restrict trade without a formal closure. Even if navies keep lanes technically open, shipowners may refuse voyages or demand prohibitive compensation. This “commercial closure” can be as important as a legal blockade.
The final risk is miscalculation. The latest escalation involved several governments and armed groups operating across Iran, Iraq, Jordan, Saudi Arabia, Yemen and nearby waters. A strike intended as limited retaliation can be interpreted as preparation for a broader attack. The number of actors increases the chance that events move faster than diplomacy.
Implications for Investors Without Turning the Story Into a Trade Call
The oil rally affects asset classes, but the evidence does not support a universal investment conclusion. An energy producer may benefit from higher realized prices while carrying political, operational or tax risks. An airline may suffer from fuel costs but offset part of the increase through fares, hedges or capacity changes. A refiner may gain from strong product margins even when crude is expensive.
Balance-sheet strength is likely to matter more than a simple sector label. Companies with cash, low leverage and flexible capital spending can withstand volatility. Highly indebted firms face higher interest costs and less room to absorb input shocks. Businesses with pricing power can defend margins; those selling commoditized products under fixed contracts cannot.
Hedging disclosures deserve attention. A producer that hedged heavily at lower prices may not capture the full rally. A fuel consumer with long-dated hedges may be protected temporarily. The notional size, duration, benchmark and collateral terms determine whether a hedge works as expected.
Geographic exposure also matters. A company dependent on Gulf cargoes faces different risks from one supplied through domestic pipelines. A global shipping firm may benefit from higher rates but face insurance, safety and vessel-loss risk. A defense contractor may see higher demand, but procurement timing and political decisions are uncertain.
Valuation can reverse the intuitive reaction. If energy shares have already risen substantially, higher oil may be partly reflected in earnings estimates and prices. If transport shares have already fallen, a de-escalation can produce a sharp rebound. The market’s starting point is as important as the direction of the commodity.
The appropriate journalistic conclusion is therefore analytical rather than prescriptive: identify the cash-flow channels, test the company’s resilience under several oil-price assumptions, and distinguish a temporary benchmark move from a durable change in physical supply.
Government Policy Can Cushion the Shock, but It Cannot Erase It
Governments have several tools for responding to an oil disruption, but every tool redistributes cost rather than making the underlying scarcity disappear. Strategic reserves can add barrels, subsidies can shield consumers, tax changes can alter retail prices, and naval operations can improve shipping security. Each response has limits, delays and side effects.
Strategic stock releases are the most direct supply measure. The United States and other IEA members hold emergency inventories intended for severe disruptions. Releasing crude can reduce competition for commercial barrels and reassure refiners that supply will remain available. The impact depends on the type and location of the oil, the capacity of pipelines and refineries, and the speed at which barrels can be sold and delivered.
Crude reserves do not solve every product shortage. A market short of diesel or jet fuel may need finished-product stocks, additional refinery runs or imports. If refineries are damaged or operating below capacity, adding crude can have a limited effect on the price consumers pay. This is one reason the IEA’s finding of weak refinery runs matters as much as the headline production loss.
Reserve releases also create an intertemporal trade-off. Selling now reduces the inventory available later. If policymakers believe the current disruption is near its peak, a release can bridge the market until flows recover. If they fear a larger escalation, they may preserve stocks. Political leaders face pressure to lower gasoline prices immediately, while energy-security officials must consider the worst credible future case.
After an emergency, governments often seek to refill reserves. Restocking adds demand and can slow the decline in prices. The EIA explicitly noted that government and commercial restocking would attenuate the forecast fall in Brent. A reserve release can therefore shift demand across time rather than permanently eliminate it.
Fuel-tax reductions provide faster visible relief at the pump. They can be implemented nationally or regionally and may lower the retail price if distributors pass the reduction through. The fiscal cost can be substantial, and the benefit is poorly targeted because high-income households that consume more fuel receive more absolute relief. A tax holiday can also support demand when policymakers may prefer conservation.
Direct subsidies or price caps can protect households and politically sensitive industries. They also create contingent liabilities for governments or losses for state-owned energy companies. If the controlled price is below the import cost, consumption remains high while the budget absorbs the difference. Persistent subsidies can weaken public finances, reduce funds for other priorities and delay adaptation.
Targeted transfers are more efficient in principle. Governments can support low-income households, public transport, farmers or essential services without subsidizing every gallon. Administration takes time, and eligibility rules can exclude businesses or workers facing genuine hardship. The political appeal of a universal price cut is often stronger than that of a narrowly targeted program.
Demand-restraint measures range from public conservation campaigns to lower speed limits, remote-work encouragement and temporary restrictions on nonessential fuel use. Such policies reduce pressure on supply but can be unpopular. The IEA’s emergency-response framework was built around the idea that coordinated demand reduction can complement stock releases during a major disruption.
Naval escorts and security guarantees address the availability problem rather than the benchmark price directly. A protected route can encourage shipowners and insurers to resume voyages. Military protection cannot eliminate mines, missiles, drones or commercial hesitation, and it introduces the risk of confrontation. The legal and diplomatic framework for routing vessels is also contested in the current Hormuz dispute.
Insurance support is another policy option. Governments can provide guarantees when private war-risk coverage becomes prohibitively expensive. That can reduce freight costs and keep trade moving, but taxpayers assume part of the risk. The program must define eligible vessels, routes, cargoes and security requirements. Poorly priced guarantees can socialize losses while leaving profits private.
Production policy matters as well. Governments can accelerate permits, relax fuel specifications or encourage higher output. These measures may help at the margin but rarely deliver large volumes immediately. Oil fields, pipelines and refineries operate under physical constraints. Relaxing a rule cannot create equipment, crews or crude quality that does not exist.
Diplomacy remains the highest-leverage tool because a credible navigation agreement can remove risk premium and restore physical flows simultaneously. The difficulty is enforcement. A statement is valuable only if Iran, Gulf states, the United States, shipowners and insurers accept the route and rules. The failure of the Omani proposal on July 29 showed how far the parties remained from a durable arrangement.
Monetary policy is the least direct energy tool. The Fed can restrain demand and prevent a temporary shock from spreading into wages and broad prices. It cannot reopen Hormuz. Excessive tightening can compound the growth damage, while insufficient tightening can allow inflation expectations to rise. This asymmetry explains why central bankers watch the second-round effects rather than trying to offset every oil move.
The practical policy mix is therefore likely to be layered: diplomacy and security to restore flows, reserves to bridge temporary shortages, targeted fiscal support for vulnerable groups, and monetary restraint if inflation broadens. No single measure can deliver low prices, full consumption, secure shipping and preserved public finances at the same time.
How an Oil Shock Appears in Corporate Financial Statements
Commodity moves become economically meaningful when they enter revenue, expenses, cash flow and balance sheets. The accounting path differs by industry, which is why a benchmark rally cannot be translated directly into earnings without examining the business model.
For an upstream producer, the first effect appears in realized revenue. The company’s realized price may differ from Brent or WTI because of crude quality, location, transportation and hedging. Production volume matters equally. A producer receiving a higher price on fewer barrels may not report stronger revenue. Royalties and production taxes can rise with price, and operating costs may increase as service companies charge more.
Depletion, depreciation and exploration expenses do not necessarily change immediately with the commodity. Cash flow can improve faster than reported earnings because higher prices increase receipts while many noncash expenses remain based on historical investment. Capital spending decisions then determine whether the company distributes the cash, reduces debt or drills more.
Hedge accounting can obscure the initial picture. A producer with swaps or collars may report derivative losses when oil rises, offsetting part of the operating gain. Some losses are noncash mark-to-market adjustments that reverse as contracts settle. Investors need to distinguish current cash settlements from changes in fair value and examine the volume actually hedged.
For a refinery, crude is inventory and feedstock rather than revenue. Rising crude increases working-capital needs. Profitability depends on the crack spread—the difference between product values and crude cost—adjusted for energy, maintenance and yield. A refinery can earn more in a high-oil environment if gasoline and diesel rise even faster. It can lose money if crude rises while product demand weakens.
Inventory accounting adds complexity. Under last-in, first-out accounting, higher prices can increase cost of goods sold more quickly, while first-in, first-out accounting can produce temporary inventory profits. Those accounting effects do not necessarily reflect the sustainable economics of the refinery. Analysts often adjust for inventory gains and losses to assess underlying margin.
Airlines record fuel as a major operating expense. The income-statement effect depends on consumption, average purchase price and hedges. Cash flow may be affected by collateral on derivative positions before the fuel is consumed. Higher fares can offset the cost, but revenue management responds with a lag and depends on demand. If passengers reduce travel, the airline may face both higher cost and lower load factors.
Trucking and shipping companies may record fuel surcharges as revenue and fuel as expense. Reported revenue can rise because the surcharge increases even if the underlying freight volume is flat or falling. Investors should separate surcharge revenue from core pricing and examine whether the company recovered the full cost. A higher top line is not necessarily stronger economic activity.
Retailers and manufacturers often experience the shock through gross margin. Freight, packaging and input costs rise before shelf prices or contract prices adjust. Inventory purchased at lower cost may delay the effect. When new inventory arrives, margin can compress suddenly. Promotional plans may be reduced, changing sales volume as well as price.
Utilities vary by regulatory structure. A utility with an automatic fuel-adjustment mechanism can pass costs to customers, protecting earnings but raising bills. A utility subject to rate-case delays may carry under-recovered fuel costs as a regulatory asset. Cash flow can weaken even when accounting rules allow eventual recovery.
Working capital is a common pressure across industries. Higher prices increase the cost of inventory and the value of receivables. Suppliers may demand quicker payment or more collateral. Customers may delay payment. The cash conversion cycle can lengthen at precisely the moment that interest rates and borrowing costs are high.
Debt covenants can become relevant for low-margin companies. Earnings before interest, taxes, depreciation and amortization may fall while revolver usage rises, increasing leverage ratios. Companies that appear solvent under a normal fuel assumption can approach covenant limits in a prolonged shock. Waivers or refinancing may be expensive if credit markets are also risk-averse.
Foreign exchange can amplify the financial-statement effect. A non-U.S. company buying dollar-denominated oil may report a larger local-currency cost when its currency weakens. It may hedge the commodity but not the currency, or vice versa. A complete exposure analysis must consider both legs.
Deferred tax and government support can alter reported earnings. Producers may face windfall taxes, while transport companies receive subsidies. Those measures can change after the quarter closes, making guidance uncertain. Management should distinguish policy assumptions from operating performance.
Guidance quality becomes a test of credibility. Companies may provide sensitivity tables showing the effect of a $1-per-barrel change, but linear sensitivities often fail during extreme disruption. Volumes, customer behavior, hedges and policy responses change at the same time. A sensitivity based on constant operations can understate the risk.
Cash-flow analysis is therefore more reliable than focusing on adjusted earnings alone. Investors should examine operating cash, collateral, inventory financing, capital spending and debt. A company can report an adjusted profit while consuming cash because working capital expanded. Another can report derivative losses while generating strong cash from physical sales.
The same oil shock can thus create higher revenue, lower margins, stronger cash flow, weaker liquidity or any combination depending on the company. Financial reporting turns the geopolitical story into measurable business consequences, but only when the analyst follows the commodity through the entire set of statements.
How Companies Can Build Budgets Around an Unbudgetable Oil Market
The most useful corporate response to geopolitical oil volatility is not to predict the next missile launch. It is to identify which financial assumptions fail when fuel prices, freight rates or delivery times move outside the normal range. A budget built around one precise Brent forecast creates false confidence. A resilient plan uses a range of prices and connects each range to operational decisions.
That process begins with exposure mapping. Companies should distinguish direct fuel purchases from energy embedded in freight, packaging, raw materials and supplier contracts. A retailer may buy little fuel itself but still be highly exposed through distribution. A software company may appear energy-light but face higher data-center electricity costs and weaker customer spending. An oil producer may benefit from the benchmark while paying more for steel, services, insurance and security.
The second step is to separate price risk from availability risk. A financial hedge can offset a higher benchmark, but it cannot deliver diesel to a warehouse, secure a tanker or reopen an air route. Companies dependent on physical supply need alternative suppliers, inventory policies and logistics plans in addition to derivatives. Those measures have carrying costs, so management must decide how much resilience is worth buying.
Scenario budgets should include at least three cases: a return toward the EIA’s lower-price outlook, an extended $80–$100 trading range, and a more severe disruption with higher product and freight costs. Each scenario should show the effect on gross margin, working capital, debt covenants and cash. The objective is not to claim that one case will occur. It is to know which decisions become necessary if it does.
Working capital is often overlooked. Higher commodity prices increase the dollar value of inventories and receivables. A distributor that holds the same physical volume of fuel may need substantially more cash to finance it. Customers may pay later because their own costs are rising. Lenders can become more cautious at the same time. A profitable company can therefore face a liquidity squeeze even before its income statement shows a large loss.
Contract design is another line of defense. Fuel surcharges, index-linked pricing and hardship clauses can share risk between suppliers and customers. Poorly designed formulas create disputes when the chosen benchmark diverges from the actual cost. A diesel-intensive business should not assume a Brent-linked clause perfectly tracks regional diesel. The lag, averaging period, cap and floor all matter.
Hedging policy should be tied to business risk rather than market confidence. A company that cannot survive a $20 increase in oil has a stronger reason to hedge than one with wide margins and flexible pricing. Hedging everything can be expensive and may eliminate the benefit of lower prices. Hedging nothing leaves the budget exposed. Layered positions across several months can reduce the risk of making one large decision at the worst possible time.
Boards should also examine counterparty risk. A hedge is useful only if the counterparty can perform and collateral requirements are manageable. A supply contract is useful only if the supplier has access to physical product. During a regional crisis, several counterparties may rely on the same terminal, pipeline or insurer, creating hidden concentration.
Communication with investors and employees should avoid false precision. Management can explain the range of exposure, the portion hedged, the pass-through mechanisms and the operational mitigations without pretending to know the future price. Credibility is damaged when a company announces that it is “fully protected” and later reveals basis losses, volume mismatches or supply shortages.
Capital allocation may need to change if the shock persists. Energy-intensive expansion projects can be delayed, while efficiency investments become more valuable. Producers may accelerate maintenance or drilling, but they should distinguish temporary cash windfalls from sustainable returns. Using a short-lived price spike to justify a long-lived project can destroy value when the market normalizes.
Efficiency is the least dramatic but most durable hedge. Better route planning, reduced empty miles, improved insulation, more efficient equipment and lower material waste reduce exposure under every price scenario. Unlike a financial hedge, efficiency does not expire. It can require upfront capital, but repeated geopolitical shocks increase the value of reducing the quantity of energy needed for each unit of output.
Finally, companies should define escalation triggers before the crisis worsens. A trigger might be a confirmed terminal outage, a certain number of days with Hormuz transits below normal, a specified diesel price, or a material increase in war-risk premiums. Predefined triggers allow management to act from a plan rather than improvising under pressure. They also help separate operational decisions from the emotional impact of intraday market moves.
The business lesson from July 29 is therefore not that every company should lock in fuel immediately. It is that oil risk now includes price, route, insurance, currency, inventory and policy risk. A plan that addresses only the benchmark leaves the largest operational vulnerabilities untouched.
What Happens Next
The first scheduled event was the Federal Reserve decision at 2:00 p.m. Eastern Time on July 29, followed by Chair Kevin Warsh’s press conference. Markets would examine whether the committee held the 3.50%–3.75% range, how it described inflation, and whether the latest energy shock changed the balance of risks. Because the decision occurred after the research cutoff, readers should consult the official Federal Reserve statement for the final outcome.
The EIA’s Weekly Petroleum Status Report was also due later Wednesday. The market would compare the official crude figure with the API’s reported 3.3 million-barrel draw and examine gasoline, distillate, refinery utilization, imports and exports. A crude draw combined with product draws would reinforce tightness more than a crude draw caused by temporary import timing.
In the Gulf, the most important near-term question is whether attacks continue. Confirmation of damage to Saudi petroleum infrastructure would change the story materially. An absence of damage would not eliminate risk, but it would keep the latest event primarily in the category of attempted disruption.
Diplomatic signals from Oman, Iran, the United States and Gulf governments will matter only if they change vessel behavior. An announcement of talks is less important than a sustained increase in transits, lower insurance premiums and evidence that producers can load cargoes normally.
Shipping through Bab el-Mandeb should be watched alongside Hormuz. If Saudi cargoes can move through the Red Sea, pipeline bypasses retain value. If Houthi activity deters vessels, the global system loses an important alternative.
OPEC+ policy is another variable. Reuters reported that the producer group might pause planned production increases from October after unwinding voluntary cuts. Any formal decision would need to be evaluated against actual available capacity and export routes. A production target is less useful when infrastructure or shipping prevents the barrels from reaching market.
Finally, incoming inflation and employment data will determine whether the oil shock changes monetary policy beyond July. One morning’s rally will not dominate the Fed’s outlook. Several weeks of higher gasoline, rising inflation expectations and broad business price increases could.
Research Cutoff and the Risk of Rapid Reversal
This article uses a research cutoff of 12:30 UTC on July 29, 2026. That timestamp matters because the Federal Reserve decision, the official EIA inventory release and further military or diplomatic statements were scheduled or possible later in the day. Intraday oil prices are not closing prices, and the percentage moves cited here should not be presented later as final session returns without updating them.
Fast-moving conflict coverage can also change as governments correct statements, release imagery or provide damage assessments. A facility initially described as protected may later report limited damage; an attack attributed to one group may be disputed or reassessed. Responsible updates should preserve the original timeline and state what changed rather than silently replacing earlier information.
The same discipline applies to monetary policy. Before 2:00 p.m. Eastern Time, the Fed outcome was unknown. After the announcement, the official statement, vote and press conference become the primary sources. Market-implied probabilities and economist surveys remain useful for explaining expectations, but they should not be written as though they predicted the decision with certainty.
Oil can reverse sharply when new evidence changes the perceived probability of disruption. A ceasefire, a confirmed navigation agreement or evidence of normal tanker traffic can remove risk premium quickly. Confirmed infrastructure damage or additional attacks can produce the opposite response. The article’s analytical framework is designed to remain useful through those reversals: separate price from physical supply, distinguish official claims from independent confirmation, and track the indicators that reveal whether the energy system is actually tightening or recovering.
Frequently Asked Questions
Why did oil prices jump on July 29, 2026?
Oil rose after the United States said it intercepted an attempted Iranian missile attack, while U.S. and Saudi aircraft struck Iran-aligned sites in Iraq following drone attacks on U.S. forces and Saudi energy infrastructure. Iran also rejected an Omani proposal for joint management of the Strait of Hormuz. The combination revived fears that shipping, production or petroleum facilities could be disrupted. Brent rose about 4.9% and WTI about 4.7% by 11:45 a.m. London time.
Were Saudi oil facilities damaged?
Saudi Arabia said drones targeting petroleum facilities in its eastern region were intercepted and destroyed. No verified production loss from the latest attacks had been reported by this article’s 12:30 UTC cutoff. The market reaction therefore reflected an increased probability of future damage more than a confirmed new Saudi supply outage.
Did Iran attack U.S. forces?
Iran’s Revolutionary Guards said they launched ballistic missiles at U.S. installations in Jordan. U.S. Central Command and Jordanian authorities said the missiles were intercepted. The available official and independent reporting confirmed the launch and interception claims but did not establish damage from the latest barrage at the cutoff.
How much oil normally moves through the Strait of Hormuz?
The International Energy Agency says approximately 20 million barrels a day of crude oil and petroleum products moved through Hormuz in 2025, equal to roughly one-quarter of global seaborne oil trade. The route is difficult to replace because available Saudi and UAE bypass pipelines provide only a fraction of normal transit volume.
Can Saudi Arabia bypass the Strait of Hormuz?
Saudi Arabia can move some crude through its East-West pipeline to Red Sea terminals. Together with a UAE pipeline, estimated bypass capacity is about 4.7 million barrels a day. That helps, but it cannot replace all Hormuz flows. The Red Sea route also depends on safe passage through Bab el-Mandeb, where Houthi activity has increased shipping risk.
Will the oil rally increase U.S. gasoline prices?
A sustained crude increase generally puts upward pressure on wholesale and retail gasoline, but the pass-through is not one-for-one. Refining margins, inventories, taxes, distribution costs and local competition affect the final price. A brief rally may have limited impact; several weeks of higher crude and tight product stocks would be more significant.
What did the latest U.S. inflation data show?
The June 2026 Consumer Price Index rose 3.5% from a year earlier. Core CPI rose 2.6%. Energy prices fell 5.7% in June from May, and gasoline fell 9.7%, but energy was still 15.7% higher than a year earlier and gasoline was 26.7% higher. The July oil rebound threatened to reverse part of June’s monthly relief.
Did the Federal Reserve raise interest rates on July 29?
The decision had not been released at this article’s research cutoff. The FOMC announcement was scheduled for 2:00 p.m. Eastern Time on July 29. The target range entering the meeting was 3.50%–3.75%. Readers should use the official Federal Reserve statement for the confirmed decision rather than pre-announcement market speculation.
Why can the EIA forecast lower oil prices while Brent trades near $88?
The EIA forecast is a quarterly average based on assumptions about recovering supply, weaker demand and improved shipping. An intraday price reflects current risk and can be far above or below a future quarterly average. If diplomacy succeeds and supply improves, prices could fall toward the forecast. If infrastructure or shipping is disrupted further, the forecast may prove too low.
Are energy stocks guaranteed to benefit from higher oil?
No. Upstream producers may earn more from higher realized prices, but hedges, operating costs, taxes, infrastructure risk and transportation constraints affect the result. Integrated companies also have refining and chemical operations that may respond differently. A higher commodity price does not guarantee a higher share price or stronger total financial performance.
What is the biggest risk for airlines and freight companies?
The largest risk is a sustained increase in jet fuel or diesel that cannot be passed to customers quickly. Airlines also face route disruption and airspace constraints. Shipping companies face war-risk insurance and longer voyages. Truckers may recover fuel through surcharges, but often with a lag. Smaller operators with limited cash are generally more exposed.
What indicators matter most now?
Watch confirmed infrastructure outages, tanker transits through Hormuz and Bab el-Mandeb, war-risk insurance, official EIA inventories, refinery utilization, product margins and the oil futures curve. Diplomatic statements matter most when they produce observable changes in shipping and production.
Final Assessment
The July 29 oil rally marked the return of a risk premium that had been removed only a day earlier. The verified evidence supports a serious but carefully defined conclusion: military activity resumed, U.S. and Saudi forces acknowledged joint strikes, Iran acknowledged missile launches, Saudi Arabia reported attempted attacks on petroleum facilities, and negotiations over Hormuz suffered a setback. Those developments justified a higher probability of disruption. They did not yet establish a new, large physical loss of Saudi production.
The market’s sensitivity is rational because the underlying system remains impaired. Global supply recovered in June but stayed well below prewar levels. Gulf exports had not returned to normal. Refineries and product inventories remained tight in important regions. Hormuz carries a volume that available bypass pipelines cannot replace, while the Red Sea alternative is exposed to its own security threats.
The strongest bullish interpretation is that the conflict now threatens infrastructure and two maritime corridors while inventories and refining capacity offer limited protection. The strongest skeptical interpretation is that Wednesday’s move largely reversed Tuesday’s de-escalation sell-off, no major new outage had been confirmed, demand is weakening and the market has repeatedly adapted when shipping conditions improve.
For the economy, duration matters more than the first-day percentage move. A short spike would have a limited effect beyond trading and hedging. A sustained period near or above current prices would pressure gasoline, diesel, aviation, freight and industrial margins. It would also complicate the Federal Reserve’s attempt to judge whether June’s inflation improvement was durable.
The next decisive evidence will not be another dramatic headline by itself. It will be whether tankers move, whether Saudi facilities continue operating, whether official inventories tighten, whether insurance costs fall or rise, and whether diplomacy produces an enforceable navigation arrangement. Until those signals improve, oil is likely to remain a market in which several days of calm can remove billions of dollars of risk premium and one night of escalation can restore it.
This article is provided for general informational purposes and does not constitute financial, investment, tax, or legal advice.
Sources
- Reuters: Oil rises as U.S.-Iran tension escalates after Iraq strikes and missile attack
- Reuters: Major Gulf fighting resumes as U.S. and Saudi Arabia strike Iran’s allies in Iraq
- Associated Press: U.S. military thwarts Iranian missile attack on troops
- U.S. Central Command: U.S., Saudi forces strike Iran-backed sites in Iraq
- Financial Times: U.S. says it intercepted surprise Iranian missile attack
- The Guardian: Oil jumps after Iran surprise attack as markets assess the conflict
- International Energy Agency: Oil Market Report, July 2026
- International Energy Agency: Strait of Hormuz overview
- U.S. Energy Information Administration: World Oil Transit Chokepoints
- U.S. Energy Information Administration: Short-Term Energy Outlook, July 2026
- U.S. Energy Information Administration: Weekly Petroleum Status Report
- U.S. Bureau of Labor Statistics: Consumer Price Index, June 2026
- Federal Reserve: FOMC meeting calendar and policy materials
- Reuters: Uncertainty enters the Federal Reserve’s July rate decision
Affiliate disclosure: Businessfinance.news may earn compensation from qualifying actions completed through selected links on this website, at no additional cost to the reader. Affiliate relationships do not influence our editorial reporting, analysis, or conclusions.