The Nasdaq-100’s late-July retreat has moved beyond an ordinary bad week for technology stocks. The index has been trading around the conventional threshold for a correction, semiconductor shares have suffered a much deeper drawdown, and investors are reassessing whether the enormous capital commitments behind the artificial-intelligence buildout can produce returns quickly enough to justify the prices previously assigned to the sector.
Technical analyst Katie Stockton’s central warning on July 29 was that the decline may not yet have reached a durable buying point. Her reading was based on a breach of shorter-term support, weakness below the 50-day moving average and a new weekly moving average convergence-divergence, or MACD, sell signal. In her framework, the Nasdaq-100 could still have roughly another 5% to 6% of downside before reaching the next meaningful support zone, even though the first and most emotional phase of the selloff may already have occurred.
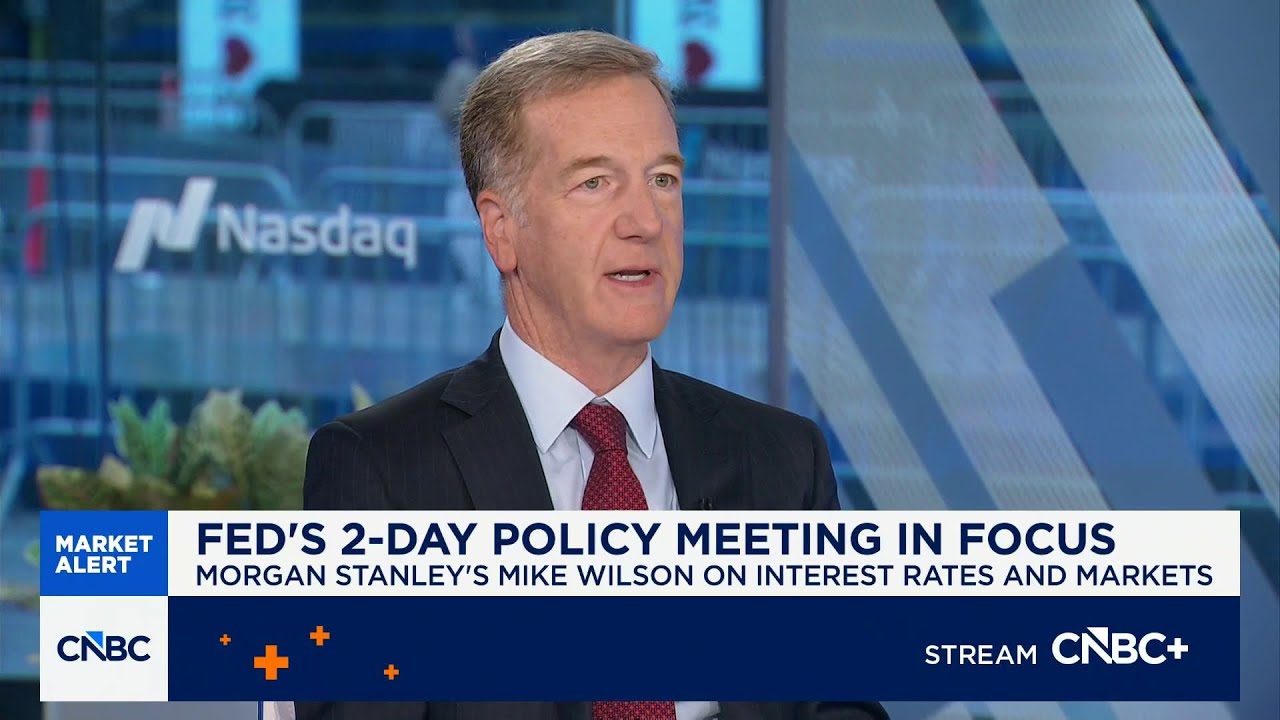
That warning landed during an unusually complicated session. Hours after Stockton spoke, the Federal Reserve left its target range at 3.50% to 3.75%, but the decision passed by a divided 9–3 vote, with three officials preferring a quarter-point increase. Oil prices were surging after renewed Middle East conflict and a sharp drop in U.S. crude inventories. At the same time, U.S. technology shares staged a substantial intraday recovery from their lows, showing that a correction can produce violent rallies without settling the larger question of whether the downtrend has ended.
Bitcoin offered a contrasting picture. It was holding near $64,000 in the afternoon, above the approximately $58,000 area that had attracted heavy selling earlier in the month, while the Nasdaq-100 remained under pressure. Stockton described that divergence as constructive, but not yet proof of a long-term bull-market turn. Her more cautious conclusion was that bitcoin’s short- and intermediate-term indicators were improving while the longer-term evidence remained incomplete.
The same morning also brought the launch of the Amplify Fairlead Tactical Bitcoin ETF, trading under the ticker BNAV. The fund is designed to keep approximately 70% bitcoin exposure as a baseline and raise exposure as high as 150% when Fairlead’s technical signals align. It does not own bitcoin directly. Instead, it expects to obtain exposure primarily through options on bitcoin exchange-traded products, with the flexibility to use bitcoin futures and other eligible instruments. The structure creates a useful case study in what tactical investing can and cannot do: it may reduce exposure when a model detects a deteriorating trend, but it also introduces leverage, timing, derivative, liquidity and model risks that a passive spot-bitcoin product does not have in the same form.
Last updated: July 29, 2026, 3:25 p.m. Eastern Time. Market prices are intraday snapshots and may have changed after the stated research cutoff.
Key Takeaways
- Nasdaq-100 correction risk: The technology-heavy benchmark was trading around 10% below its early-June high, while the semiconductor index had fallen much more sharply from its late-June peak.
- Stockton’s technical view: A break below short-term support and a new weekly MACD sell signal suggested that the weakness could last several weeks rather than resolve as a one- or two-day shakeout.
- The Fed held rates: The Federal Open Market Committee kept the federal-funds target at 3.50% to 3.75%, with three dissenters favoring a 25-basis-point increase because inflation remained above the 2% objective.
- Oil complicated the outlook: Brent crude settled above $90 a barrel after jumping nearly 8%, adding a fresh inflation concern for growth stocks whose valuations are particularly sensitive to interest rates.
- Bitcoin showed relative resilience: Bitcoin held near $64,000 despite the equity selloff, but its longer-term trend remained damaged after large declines in the first half of 2026.
- BNAV adds tactical leverage: The new ETF targets 70% to 150% bitcoin exposure, charges a 0.74% annual expense ratio and uses derivatives rather than owning bitcoin directly.
Market Snapshot
July 29, 2026, approximately 3:20 p.m. ET
- Invesco QQQ Trust: approximately $673.31, down about 0.3% after trading as low as $663.35.
- SPDR S&P 500 ETF Trust: approximately $737.68, down about 0.4% after trading as low as $731.81.
- Bitcoin: approximately $63,983, up about 0.4% over the latest 24-hour comparison used in the market feed.
- United States Oil Fund: approximately $128.19, up about 6.4% as crude prices surged.
- Nvidia: approximately $194.09, down about 1.5%; Caterpillar: approximately $792, down about 5.8%.
Reference pages: Nasdaq QQQ market data, Nasdaq SPY market data and CoinDesk’s July 29 bitcoin market report.
The Immediate Answer: The Nasdaq-100 Has Not Yet Produced the Evidence of a Durable Low
The dominant question raised by the latest technology selloff is whether the correction has already created an attractive entry point or whether the market still needs more time and lower prices before risk and reward improve. Stockton’s answer was deliberately unsatisfying for anyone seeking a simple “buy the dip” signal: the evidence for a durable low was not yet present.
That does not mean she forecast an uninterrupted collapse. Her comments implied a process rather than a straight line. A market can be oversold in the short run, rebound sharply for several sessions and still remain in an intermediate-term correction. What she wanted to see was a combination of deeper oversold readings, stabilization around support and an improvement in short-term momentum. At the time of the interview, she said those conditions had not aligned.
This distinction matters because “correction territory” is a measurement, not a prediction. The term usually refers to a decline of at least 10% from a recent closing or intraday high. Once an index reaches that threshold, nothing in the definition says the decline must stop. Nor does the label mean a bear market is inevitable. It only describes the size of the drawdown already experienced.
For the Nasdaq-100, the correction had developed after a powerful rebound from the March 2026 lows and a peak near the beginning of June. Nasdaq’s own research had already noted that the AI-driven advance was becoming more vulnerable as investors compared extraordinary capital spending with the profits and cash flows needed to support it. By July 21, Nasdaq research described the selloff in the AI ecosystem as having been underway since the June 2 U.S. equity highs. The late-July decline in semiconductors then intensified that adjustment.
The intraday behavior on July 29 illustrated why calling a low is difficult. QQQ opened near $675, fell below $664 and then recovered much of the loss as the Fed decision and press conference changed the rate narrative. A rebound of that size can feel like a decisive turn to investors watching minute by minute. From a weekly technical perspective, however, one afternoon recovery does not automatically reverse a multiweek loss of momentum.
Stockton’s next-support estimate—about 5% to 6% below the level under discussion—should be treated as a conditional chart zone, not a guaranteed target. Support is an area where previous trading, moving averages, congestion or other technical features may attract buying. Markets can turn above support, move through it temporarily or fail to hold it at all. The value of the estimate is that it defines what the technical model considers a more plausible zone for stabilization, not that it predicts the exact low.
What Katie Stockton’s Technical Thesis Actually Says
Stockton’s argument had three layers. First, the S&P 500 had spent weeks in a narrow, converging range near its highs. That type of consolidation can represent healthy digestion after an advance, but it can also store up energy for a larger move once the range breaks. Her view was that the break had occurred to the downside.
Second, the S&P 500 had moved below its 50-day moving average and other short-term support. A 50-day moving average is simply the average closing price over the previous 50 trading sessions. Traders use it as a smoothing device that reduces daily noise and shows whether the medium-term price trend is generally rising or falling. A single close below the average is not conclusive. The signal becomes more meaningful when it occurs alongside breaks in price support, weaker market breadth and momentum deterioration across longer time horizons.
Third, Stockton pointed to a weekly MACD sell signal. MACD compares two exponential moving averages and measures the relationship between them. A weekly version uses weekly prices, so it changes more slowly than a daily indicator. In Stockton’s framework, a weekly downturn is more likely to remain in force for several weeks. That is why she interpreted the move as an intermediate-term issue rather than a brief short-term problem.
The Nasdaq-100 had already shown the same loss of momentum before the S&P 500. That sequencing was important. The companies that had led the market higher—semiconductor manufacturers, AI infrastructure suppliers and the largest technology platforms—were weakening first. The broader index initially held up because of rotation into other sectors and support from selected mega-cap companies. Once the S&P’s own weekly indicators turned down, the technical picture became more synchronized.
Stockton did not say the AI theme had become economically irrelevant. Her argument was narrower: the price trend did not yet justify treating the drawdown as an automatic buying opportunity. A secular business story and a tactical trading signal can point in different directions. The amount of computing power, networking equipment, data-center capacity and electricity required for AI may continue to increase over years, while the shares of companies supplying those resources can still fall for weeks or months when expectations move faster than realized returns.
She also suggested that the eventual leadership coming out of the correction could again include AI-related companies and industrial beneficiaries. That is a familiar pattern in strong secular themes. The leaders often survive the correction, but the market forces investors to distinguish between companies with durable earnings power and those whose valuations were supported primarily by momentum. A correction can therefore be both a trend break and a sorting mechanism.
How the Nasdaq-100 Reached Correction Territory
The Nasdaq-100 is not the Nasdaq Composite. The Composite includes thousands of Nasdaq-listed securities, while the Nasdaq-100 contains 100 of the largest nonfinancial companies listed on the Nasdaq Stock Market. The index is heavily exposed to technology, communication services and consumer businesses whose valuations depend on long-duration profit expectations. It is also the benchmark tracked by the Invesco QQQ Trust and an extensive market of futures, options, structured products and other funds.
Because of that structure, a relatively small group of companies can have an outsized effect on the index. The concentration is not an accident: market-capitalization weighting gives the largest companies the largest influence. It does mean that investors who think they own a broad basket of 100 companies may in practice be taking a substantial position in the earnings, capital spending and valuation of a narrower group of mega-cap firms.
The 2026 advance had been powered by confidence in the AI infrastructure cycle. Nasdaq research estimated AI-related capital spending at roughly $700 billion for 2026 across the relevant ecosystem. The spending helped support demand for advanced processors, memory, networking gear, data-center construction, cooling systems and power infrastructure. Earnings growth was strong, and the index’s largest companies were far more profitable than the leaders of the late-1990s internet boom.
That fundamental strength did not eliminate valuation risk. Markets price the difference between reality and expectations, not merely whether a company is growing. When investors expect extraordinary growth, an earnings report can show record revenue and still disappoint if margins, guidance or capital intensity fail to exceed the assumptions already embedded in the share price.
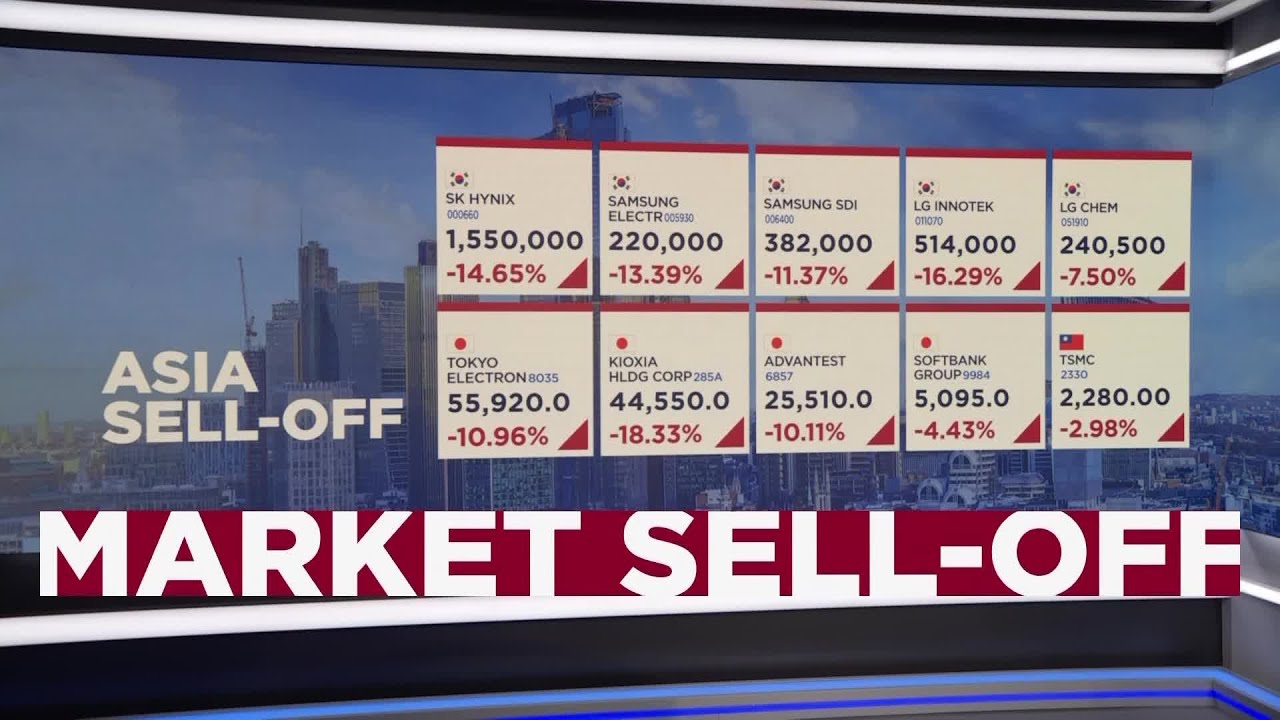
The late-July selloff reflected that asymmetry. Concerns about returns on AI investment spread from software companies to chipmakers and hardware suppliers. South Korea’s market experienced an especially violent unwind after SK Hynix results failed to meet elevated expectations despite a large increase in profit. The Reuters report on the July 29 session described a historic rout in South Korean equities and intense scrutiny of leveraged retail positions tied to AI stocks.
In the United States, the Philadelphia Semiconductor Index had fallen about 24.5% from its late-June high by the time the Nasdaq-100 approached correction territory. That is already a bear-market-sized drawdown under the conventional 20% definition. The distinction between the semiconductor index and the Nasdaq-100 matters: the core of the AI infrastructure trade was suffering a much deeper decline than the broader growth-stock benchmark.
The result was a classic concentration problem. The broader market could remain comparatively resilient because banks, energy producers, healthcare companies, selected industrials and defensive businesses were not all declining at the same pace. But the Nasdaq-100 could still enter a correction because its most heavily weighted growth sectors were losing momentum together.
The AI Trade Is Being Repriced, Not Necessarily Rejected
The phrase “AI selloff” can imply that investors have abandoned artificial intelligence as a business theme. The evidence points to a more precise conclusion: investors are repricing the timing, cost and distribution of AI profits.
Three questions have become more difficult.
- How much capital is required? The largest cloud and internet platforms have committed enormous sums to chips, servers, data centers, networking and energy. Higher spending can support suppliers while reducing free cash flow at the buyers.
- Who captures the economics? Demand for compute does not guarantee that every hardware, software and application company will earn attractive returns. Competition can transfer value from one layer of the stack to another.
- How quickly do revenues arrive? A project can be strategically necessary and still have a long payback period. Public markets often become impatient when capital expenditure rises immediately but monetization is gradual.
The first phase of the AI rally rewarded scarce infrastructure. Advanced GPUs, high-bandwidth memory, networking equipment and data-center capacity were bottlenecks. Investors could therefore connect rising capital spending directly to higher supplier revenue. As the buildout expands, the next phase requires proof that end customers can translate that infrastructure into productivity, pricing power and durable operating profit.
This is why apparently strong earnings can produce weak stock reactions. A chipmaker may report rapid revenue growth, but investors can focus on inventory, pricing, customer concentration, future supply, competitive products or signs that demand is being pulled forward. A cloud provider may report accelerating AI usage, while investors focus on depreciation, power costs, capitalized software, free cash flow and the gap between booked demand and recognized revenue.
The skepticism is also spreading beyond the most obvious technology companies. Caterpillar’s sharp decline on July 29, which Stockton referenced during the discussion, showed that the market was reassessing industrial beneficiaries of the data-center and infrastructure cycle as well. A company can benefit from construction, power generation and equipment demand while still be vulnerable if its valuation assumes that the spending boom will remain unusually strong.
A more constructive reading is that the selloff may improve the quality of future returns. When every company connected to AI trades as a winner, price signals become less discriminating. A correction can separate firms with recurring demand, high switching costs, strong balance sheets and visible cash returns from companies whose exposure is indirect or whose valuation depends on a perfect sequence of future events.
A more skeptical reading is that the market is only beginning to confront the full cost of the AI buildout. If depreciation, financing expense, energy constraints and competition rise faster than monetization, the profit pool may be smaller or arrive later than investors expected. In that case, a 10% index correction would not necessarily complete the adjustment.
Why the S&P 500 Has Looked More Stable Than the Nasdaq-100
The S&P 500’s relative resilience is not evidence that technology risk has disappeared. It reflects a different index structure and a degree of sector rotation.
The S&P 500 includes financial companies, which the Nasdaq-100 excludes, and has larger representation from healthcare, industrials, consumer staples and energy. When investors reduce exposure to the most crowded technology trades, those sectors can receive capital even if the overall economic outlook has not improved. The index can therefore remain near its highs while its former leaders experience correction- or bear-market-sized declines.
Rotation is healthy when earnings leadership broadens and new sectors rise for fundamental reasons. It is less reassuring when investors are merely moving from one crowded trade to another or when a handful of defensive mega-caps mask broad weakness underneath the index. Market breadth—the number of stocks advancing relative to those declining—helps distinguish those conditions.
Stockton’s concern was that the S&P’s own support and weekly indicators had started to deteriorate. If true, that would suggest rotation was no longer fully offsetting weakness in the Nasdaq leadership. The S&P might still decline less because of its broader sector mix, but it would no longer be insulated from the correction.
The July 29 session also showed how quickly the relationship can change. Technology shares recovered sharply after the Fed announcement while the Dow remained weak because oil-sensitive and industrial components were under pressure. Intraday leadership can reverse without resolving the medium-term trend. For investors, the practical lesson is to separate one session’s relative performance from a multiweek rotation.
What the Technical Terms Mean
A plain-English guide to Stockton’s indicators
- 50-day moving average: The average closing price over the previous 50 trading sessions. It smooths daily fluctuations and is widely used as an intermediate trend reference.
- Support: A price area where prior buying, congestion or technical reference points may attract demand. Support can fail and should not be treated as a guaranteed floor.
- MACD: Moving average convergence-divergence, a momentum indicator based on the relationship between faster and slower exponential moving averages.
- Weekly sell signal: A bearish change calculated from weekly data. It usually responds more slowly than a daily signal and is intended to identify a broader change in momentum.
- Oversold: A condition indicating that selling has been unusually intense relative to recent history. Oversold does not mean a security cannot fall further.
Original reference: CMT Association explanation of MACD and long-term trends.
What a Weekly MACD Sell Signal Can—and Cannot—Tell Investors
MACD is popular because it converts a price series into a relatively intuitive momentum signal. The standard calculation subtracts a slower exponential moving average from a faster one and compares the result with a signal line. When the faster measure weakens relative to the slower one, the indicator can turn down.
On a weekly chart, each observation represents a week rather than a day. That reduces noise and makes the indicator slower to change. The advantage is that a weekly signal is less likely to reverse because of one volatile session. The disadvantage is lag: by the time the signal appears, a meaningful portion of the decline may already have occurred.
That lag is not necessarily a flaw if the objective is trend following. Trend-following systems do not try to buy the exact low or sell the exact high. They accept late entries and exits in exchange for a systematic process that may capture a larger middle portion of sustained moves. The challenge is that markets often move sideways. In a range, signals can reverse repeatedly and create whipsaw losses.
Stockton’s emphasis on multiple time horizons is an attempt to reduce that problem. A daily signal can improve while the weekly and monthly trend remain weak. A model may therefore wait for several indicators to align before adding exposure. The trade-off is that waiting for confirmation can miss the first part of a rebound.
Technical analysis also says nothing directly about intrinsic value. A moving-average crossover does not measure revenue, cash flow, debt, competitive advantage or the probability that an AI project will earn an attractive return. It measures price behavior. That makes it useful for risk management and timing, but insufficient as a complete investment thesis.
The strongest use of a technical signal is therefore conditional. It can answer questions such as: Is the current price trend improving or deteriorating? Where has buying previously appeared? Is the market becoming more or less volatile? Are short-, intermediate- and long-term signals aligned? It cannot answer whether a company’s products are economically valuable or whether a security is fundamentally cheap.
The July 29 rebound demonstrates another limitation. A market can rally strongly after a bearish signal because short sellers cover positions, options dealers adjust hedges, investors react to new information or an oversold condition attracts buyers. A weekly model may remain bearish through that rally. Whether that is helpful or harmful depends on what happens next.
The Fed Decision Changed the Intraday Tone but Not the Core Valuation Problem
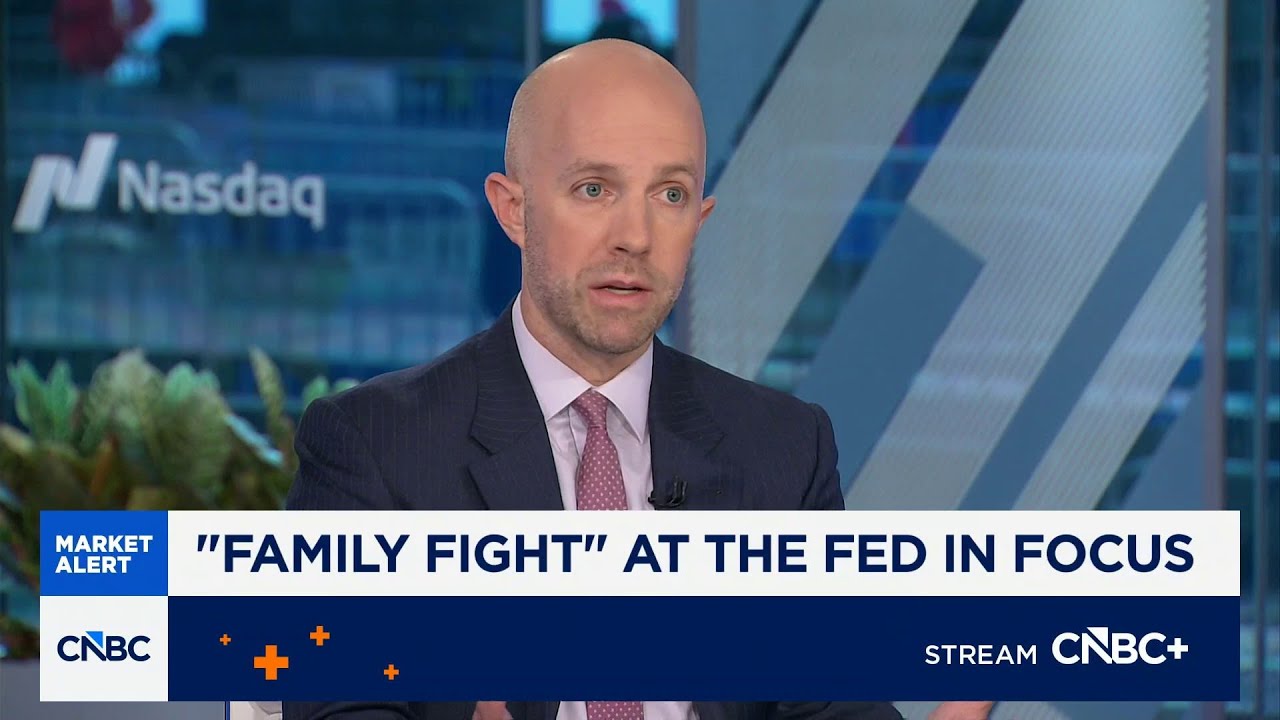
The Federal Reserve’s July decision was more hawkish than a simple “hold” headline suggests. The FOMC maintained the target range for the federal-funds rate at 3.50% to 3.75%, but the vote was 9–3. Beth Hammack, Neel Kashkari and Lorie Logan preferred a 25-basis-point increase. The statement said economic activity was expanding at a solid pace, productivity growth and capital investment were strong, job gains had kept pace with the workforce and inflation remained elevated relative to the 2% goal.
That combination matters for the Nasdaq-100. Growth-stock valuations are sensitive to interest rates because a large portion of their expected value comes from profits projected far into the future. When bond yields rise, those distant cash flows are discounted at a higher rate. A company can continue growing and still receive a lower valuation multiple.
The Fed’s decision avoided an immediate hike, which helped technology shares rebound from their session lows. But the three dissents showed that the debate had shifted. The policy question was not merely when to cut rates; a meaningful minority of the committee believed inflation and supply shocks justified tighter policy.
Oil was central to that tension. The FOMC explicitly said inflation remained elevated partly because supply shocks had increased prices in sectors including energy. A new oil spike can raise transportation, manufacturing and household costs, even if core inflation measures respond with a delay. It can also reduce real consumer purchasing power.
For AI-related companies, higher-for-longer rates create two pressures. First, they compress valuation multiples. Second, they raise the cost of financing the enormous infrastructure required for data centers and power generation. The largest technology companies can fund capital spending from operating cash flow, but their suppliers, customers and infrastructure partners may depend more heavily on debt markets.
Fed Chair Kevin Warsh’s press conference appeared to reassure investors that policymakers saw encouraging elements in the inflation data and were aware that bond-market conditions had already tightened. That helped produce the afternoon reversal. Still, the official statement remained focused on elevated inflation and price stability, not on providing immediate support to asset prices.
The important distinction is between a favorable reaction and a durable policy shift. The Nasdaq can rally because the Fed did not raise rates while still facing a valuation headwind if the next move remains uncertain, oil stays elevated and long-term yields remain high. A single meeting did not remove the macroeconomic constraint on the AI trade.
Federal Reserve Decision
July 29, 2026
- Target range maintained at 3.50% to 3.75%.
- Decision approved by a 9–3 vote.
- Three dissenters preferred a 25-basis-point increase.
- Interest paid on reserve balances remained 3.65%, effective July 30.
- The Fed said inflation remained above its 2% objective and cited energy-related supply shocks.
Original sources: July 29 FOMC statement and monetary-policy implementation note.
Oil’s Surge Makes the Market’s Technical Setup More Fragile
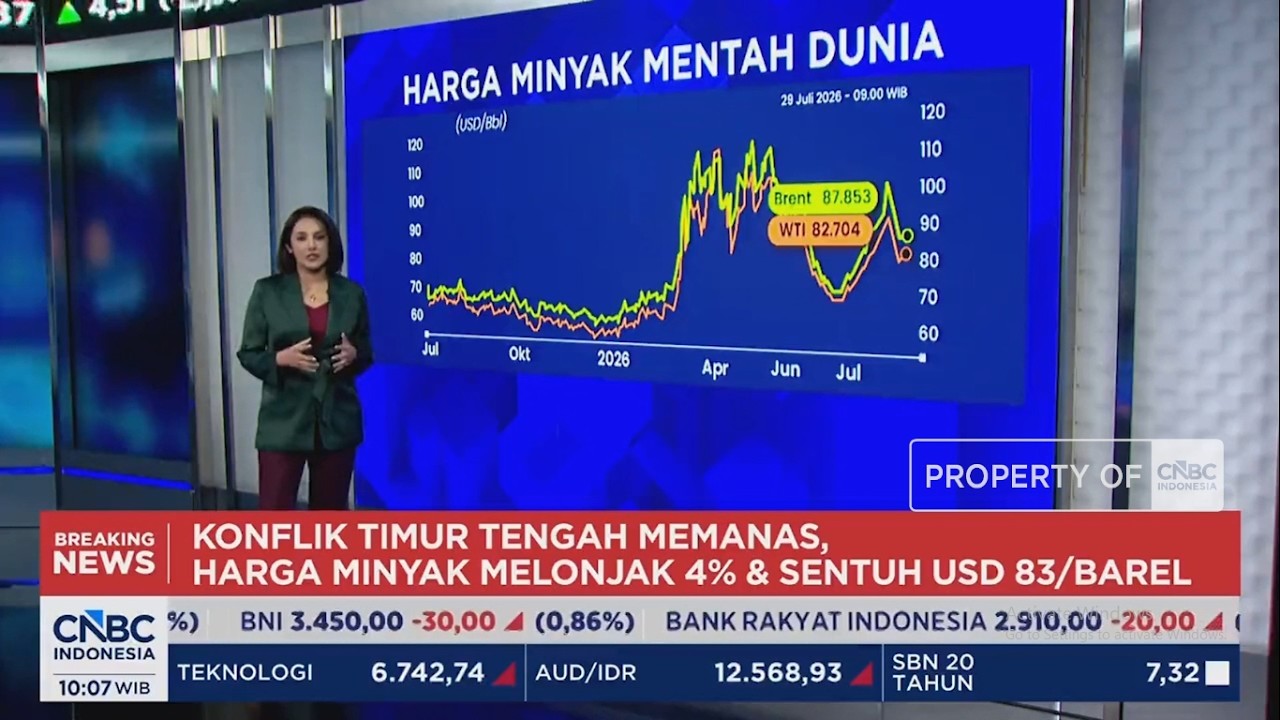
Crude oil added a fundamental shock to a market already struggling with valuation and momentum. Brent futures settled at $90.74 a barrel on July 29, up $6.65, or 7.91%. West Texas Intermediate settled at $84.46, up $5.20, or 6.56%. Reuters attributed the move to renewed airstrikes in the Middle East and U.S. inventory data showing crude stocks at a multiyear low.
Stockton’s chart-based view was that crude had pulled back from short-term resistance near $90 and could form a higher low above support around $67. The same-day surge changed the immediate price context. Rather than approaching $90 as resistance from below after a quiet advance, Brent moved through that area in a geopolitical shock.
That does not make the technical framework irrelevant. It demonstrates that chart levels exist within a news environment. A price can break resistance because a supply disruption changes the market’s estimate of future availability. The chart records the response, but it does not cause it.
Stockton also pointed to improvement in a monthly MACD indicator for crude oil. A monthly momentum turn is a long-horizon signal and can remain constructive even when the commodity experiences violent short-term reversals. The oil market in July showed exactly that behavior: prices fell sharply on hopes for a pause in U.S.-Iran hostilities, then rebounded when conflict resumed.
For equities, the practical issue is not whether oil reaches a specific technical target. It is whether higher energy prices persist long enough to affect inflation, margins and consumer demand. Airlines, transport companies, chemical producers and manufacturers can face higher input costs. Energy producers may benefit, while households have less discretionary income if fuel prices rise.
Technology companies are not immune. Data centers consume large amounts of electricity, and the AI buildout increasingly intersects with natural gas, grid infrastructure, backup generation and power equipment. A broader energy shock can raise operating and construction costs even when the direct fuel input is not crude oil.
The Fed’s divided decision made this connection explicit. If energy inflation keeps headline and inflation expectations elevated, policymakers have less room to ease. That keeps discount rates high and increases the hurdle rate for long-duration technology investments. In other words, oil can pressure the Nasdaq even when technology demand remains strong.
Bitcoin’s Relative Strength Is Constructive, but the Long-Term Damage Has Not Disappeared
Bitcoin’s price action offered the most important counterpoint to the weakness in the Nasdaq-100. The cryptocurrency had fallen toward $58,000, recovered above $65,000 and then settled into a roughly $63,000 to $65,000 range. At the July 29 research cutoff, bitcoin was near $63,983 while QQQ remained below its previous close.
Stockton interpreted that resilience as evidence of downside exhaustion. In technical language, downside exhaustion means that the intensity of selling appears to be diminishing. The market may stop making large new lows, negative momentum may moderate and rebounds may hold more of their gains. It does not prove that a long-term bottom has formed.
Her distinction between time horizons was important. She was more constructive on bitcoin over the short and intermediate term because momentum gauges were improving and the $50,000-to-$58,000 region had begun to function as a potential base. She remained neutral on the long-term trend because a durable reversal generally requires more evidence: higher highs, higher lows, improving long-term momentum and successful tests of resistance.
Bitcoin entered July with substantial technical damage. NYDIG calculated that the asset fell 22.6% in the first quarter of 2026 and another 13.4% in the second quarter, leaving it down 32.9% for the first half. That weakness was especially striking because the Nasdaq-100 rose sharply during the second quarter. Bitcoin was not simply behaving as a leveraged version of technology equities; it was underperforming them.
That divergence helps explain Stockton’s constructive view. If bitcoin can stabilize while the Nasdaq declines, it may indicate that crypto-specific selling has already progressed further. The asset had already absorbed liquidations, reduced speculative leverage and a large sentiment reset. A market that has fallen earlier and further can sometimes bottom before the asset class that remained strong for longer.
The skeptical interpretation is that temporary decoupling does not equal independence. Bitcoin’s relationship with equities changes across market regimes. CME Group research has shown that correlations with the Nasdaq-100 have ranged from weakly positive to materially positive since 2020, and NYDIG has argued that the post-pandemic baseline relationship with U.S. equities is higher than it was in bitcoin’s earlier history. During severe risk-off episodes, liquidity needs and deleveraging can pull assets back together even after a period of divergence.
Bitcoin also lacks the conventional valuation anchors available for a company or bond. It produces no contractual cash flow, and its price depends heavily on adoption, liquidity, market structure, regulation, leverage and investor willingness to hold a scarce digital asset. Technical analysis therefore plays a larger role in bitcoin trading than it does for many operating companies, but that also makes crowd behavior and positioning especially important.
The $58,000 area should not be treated as an inviolable floor. It was a zone where selling became intense and where buyers subsequently emerged. A successful base would require the market to hold above or recover quickly from tests of that region. A sustained break below it would weaken the bullish short-term interpretation and raise the possibility of a move toward lower support.
Why Bitcoin’s Correlation With the Nasdaq Can Change So Quickly
Correlation measures the degree to which two assets move together over a chosen period. A positive correlation means they tend to rise and fall at the same time; a negative correlation means they tend to move in opposite directions. A correlation near zero means there is little consistent linear relationship in the selected data.
The key phrase is “over a chosen period.” A 30-day correlation can differ dramatically from a 90-day or five-year measure. Bitcoin and the Nasdaq can decouple during a short, asset-specific event and still remain positively correlated over a longer window.
Several mechanisms connect them:
- Shared liquidity: Both assets benefit when financial conditions are easy and investors are willing to take risk.
- Institutional portfolios: Funds may classify bitcoin and high-growth equities as volatile risk assets and reduce both when volatility limits are breached.
- Interest rates: Higher real yields increase the opportunity cost of holding assets that do not produce current income.
- Dollar movements: A stronger dollar can pressure globally traded risk assets, although the relationship is inconsistent.
- Leverage and margin: Losses in one market can force investors to sell another liquid position to meet collateral requirements.
There are also reasons for divergence. Bitcoin has its own supply schedule, exchange flows, derivatives positioning, regulatory events and adoption cycle. Technology stocks are influenced by earnings, capital spending, product demand, taxes, competition and corporate finance. When one set of factors dominates, correlation can weaken.
In the first half of 2026, bitcoin’s deep decline while the Nasdaq-100 rallied showed that crypto-specific forces were stronger than the shared risk-on relationship. By late July, the pattern had partly reversed: technology stocks were correcting while bitcoin attempted to stabilize. Stockton regarded that lack of correlation as positive because it suggested bitcoin was not mechanically following the latest equity weakness.
The more cautious conclusion is that a few weeks of relative strength are not enough to establish bitcoin as a hedge against technology stocks. A hedge should deliver reliable protection in the conditions for which it is purchased. Bitcoin has not demonstrated consistent negative correlation with equities. It may diversify a portfolio over some long periods, but it can also fall sharply during liquidity crises.
The BNAV Launch Turns Stockton’s Technical Process Into a Tradable Product
The launch of the Amplify Fairlead Tactical Bitcoin ETF made the interview more than a market forecast. Stockton was discussing the same technical philosophy that determines how a newly listed investment product will adjust bitcoin exposure.
BNAV launched on July 29, 2026, on the Cboe BZX Exchange. The fund began with approximately $750,000 in net assets, 30,000 shares outstanding and a starting net asset value of $25 per share. Its annual expense ratio is 0.74%. Amplify Investments is the adviser, and Fairlead Asset Management is the sub-adviser responsible for the tactical model.
The fund’s stated objective is long-term capital appreciation through actively managed bitcoin exposure. It maintains a baseline exposure of approximately 70% of net assets and can increase that exposure to approximately 150% when technical conditions are favorable. The model evaluates price, momentum and volatility across short-, intermediate- and long-term horizons.
BNAV does not buy and custody bitcoin directly. The prospectus says it expects to rely primarily on options tied to bitcoin exchange-traded products or the Cboe Bitcoin U.S. ETF Index. It can also use cash-settled bitcoin futures. The remaining assets may be held in U.S. Treasury securities, cash or cash-like instruments for collateral and liquidity.
The initial holdings illustrate the synthetic structure. Amplify’s holdings page showed a purchased call option and a written put option on the iShares Bitcoin Trust ETF, both with a September 18, 2026 expiration and the same stated strike. A long call combined with a short put at the same strike and expiration can create economic exposure similar to holding the underlying asset, subject to option pricing, collateral and execution differences.
The word “tactical” is central. A passive spot-bitcoin ETP generally stays close to 100% exposure to the bitcoin it holds, less fees and operational frictions. BNAV is designed to be underexposed relative to bitcoin at its 70% baseline and overexposed when it raises exposure above 100%. Its success depends not only on bitcoin’s direction but also on whether the model changes exposure at useful times.
BNAV Fund Snapshot
Amplify Fairlead Tactical Bitcoin ETF
- Ticker: BNAV
- Launch date: July 29, 2026
- Primary exchange: Cboe BZX
- Expense ratio: 0.74%
- Target bitcoin exposure: Approximately 70% to 150% of net assets
- Direct bitcoin ownership: None
- Expected instruments: Bitcoin ETP options, options on a bitcoin ETP index and cash-settled bitcoin futures
- Initial net assets: Approximately $750,000
Original sources: BNAV fund page and BNAV prospectus dated July 27, 2026.
How the 70% to 150% Exposure Range Works
BNAV’s exposure range can be understood as three practical states, although the model may make adjustments along a continuum.
Baseline: Approximately 70% Exposure
When the model identifies a weak, uncertain or nonaligned trend, the fund is expected to remain near its baseline. A 70% exposure means that a 10% move in bitcoin would produce an approximate 7% gross directional effect before option pricing, expenses, collateral returns, trading costs and other factors. The actual result can differ.
The baseline prevents the fund from moving entirely to cash. That choice reflects a belief that bitcoin has a long-term secular opportunity and that fully exiting could cause the strategy to miss sudden rallies. It also means the fund is not designed to eliminate bitcoin drawdowns. A severe decline can still produce a large loss at 70% exposure.
Neutral to Improving: Exposure Rises Above 70%
As short-, intermediate- and long-term indicators improve, the model can add exposure. The prospectus does not publish a simple public formula that allows an outside investor to calculate the exact allocation from observable indicators. Fairlead describes the process as systematic and rules-based, but it remains proprietary.
This creates a transparency distinction. Investors know the permitted range and general inputs, but they do not know every threshold, weighting or override in advance. The model’s live performance will eventually show how quickly it responds and how often it changes exposure.
Risk-On: Up to Approximately 150% Exposure
When signals align positively, BNAV can use leverage to reach approximately 150% bitcoin exposure. A 10% move in bitcoin could then create an approximate 15% gross directional effect before costs and tracking differences. Losses can be magnified in the same way.
Unlike many leveraged ETFs that target a fixed multiple of daily returns and reset every session, BNAV does not advertise a constant daily leverage multiple. Its exposure changes according to the model. That may reduce some of the path-dependency associated with a fixed 2x or 3x daily product, but it does not remove leverage risk.
BNAV Versus a Passive Spot-Bitcoin ETP
| Feature | BNAV | Typical Passive Spot-Bitcoin ETP |
|---|---|---|
| Exposure | Approximately 70% to 150%, model driven | Generally close to 100% bitcoin exposure less cash and fees |
| Underlying structure | Primarily options on bitcoin ETPs, with possible futures and related instruments | Holds bitcoin through a trust or similar ETP structure |
| Management style | Active and tactical | Passive price tracking |
| Down-market behavior | Can reduce to about 70%, but remains materially exposed | Usually remains close to fully exposed |
| Up-market behavior | Can raise exposure to about 150% | Generally participates near one-for-one before fees |
| Primary added risk | Model timing, leverage, options, futures and turnover | Bitcoin custody, tracking, market and regulatory risk |
The comparison is not a claim that one structure is universally superior. It shows that the products solve different problems. A passive ETP is designed to provide straightforward exposure. BNAV attempts to improve the path of returns by varying risk.
If the model correctly reduces exposure before large declines and adds exposure during sustained advances, BNAV could outperform a passive product over a full cycle. If it reduces exposure after a decline and then raises it after a rebound, the strategy can lock in relative underperformance. Sideways, volatile markets are especially challenging because repeated trend changes can produce whipsaw.
Fees also matter. BNAV’s 0.74% annual expense ratio is higher than the fees charged by several large passive spot-bitcoin products. The difference pays for active management and the tactical structure, but the strategy must add enough value to overcome the higher expense, trading costs and derivative frictions.
The Most Important BNAV Risks Are Not Hidden in the Marketing Headline
“More exposure in rising markets and less exposure in falling markets” is an appealing summary. The difficult part is identifying those markets before the move is over. BNAV’s prospectus makes clear that the strategy can fail.
Model Risk
The model is built from historical prices, momentum and volatility. Market relationships can change. A signal that worked in one regime may respond poorly when regulation, market structure or investor behavior changes. Backtested or historical logic does not guarantee live results.
Whipsaw Risk
Bitcoin can reverse quickly. A model may reduce exposure after a sharp decline, only for the asset to rebound before the indicators recover. It may then add exposure near a short-term peak. Repeated reversals can cause the tactical strategy to lag a simple hold.
Leverage Risk
Exposure above 100% magnifies gains and losses. A 20% bitcoin decline at 150% exposure implies roughly 30% gross directional loss before other effects. The fund’s exposure can change, but the possibility of rapid bitcoin moves means losses can occur before the model responds.
Options Risk
BNAV expects to use purchased calls and written puts. Written puts create an obligation that can lose value as the underlying ETP falls. Option prices also reflect implied volatility, time to expiration, interest rates and liquidity. The economic exposure may differ from a simple bitcoin holding.
FLEX Options and Liquidity Risk
The prospectus allows FLEX Options with customized terms. They can be less liquid than standardized options, making it harder to close or adjust positions at favorable prices. A small new fund may also have wider bid-ask spreads until trading volume develops.
Futures Basis and Roll Risk
If BNAV uses futures, the futures price can differ from spot bitcoin. In contango, later-dated contracts trade above near-term contracts, and rolling exposure can create a cost. In backwardation, the relationship reverses. Futures can therefore add tracking differences unrelated to the model’s directional call.
Underlying ETP Risk
Options may reference a spot-bitcoin ETP such as IBIT. BNAV then inherits risks from both its own structure and the underlying product, including premiums or discounts, trading halts, benchmark differences, custody and operational issues.
Tax and Turnover Risk
Frequent option and futures transactions can increase turnover and taxable distributions. The prospectus warns that transaction costs are not included in the stated expense ratio. Investors holding the fund in taxable accounts may experience a different after-tax result from a passive product.
Why the Investment Company Act of 1940 Matters—but Does Not Remove Bitcoin Risk
During the interview, Stockton emphasized that BNAV is an ETF registered under the Investment Company Act of 1940. That distinguishes it from spot-bitcoin ETPs structured as commodity trusts or similar products outside the 1940 Act.
A 1940 Act fund operates under a regulatory framework governing investment companies, boards, custody, valuation, reporting and other investor protections. The wrapper can make the product familiar to brokerage platforms and financial advisers.
The regulatory structure does not make the underlying exposure safe. BNAV’s prospectus states that bitcoin is highly speculative and volatile. The fund can use leverage, derivatives and a Cayman Islands subsidiary for futures exposure. It is classified as nondiversified and can concentrate in instruments providing bitcoin exposure.
The distinction is therefore about product structure, not a government endorsement of bitcoin or the model. The prospectus explicitly says the SEC has not approved or disapproved the securities or passed on the adequacy of the document. That standard language is important because investors often confuse registration with approval of the investment thesis.
Stockton’s Conflict of Interest Should Be Disclosed, Not Used to Dismiss the Analysis
Stockton’s market view and BNAV’s launch occurred in the same interview. She has a clear commercial interest in the new ETF’s success as the founder of the sub-adviser managing the strategy. That relationship does not make her technical analysis false, but it should shape how readers evaluate the presentation.
The most relevant question is whether the argument can be tested independently. Her Nasdaq view was specific: the index had broken support, weekly momentum had turned down, the next support zone was lower and a durable low required oversold conditions plus stabilization. Her bitcoin view was also qualified: improving short- and intermediate-term evidence, but a neutral long-term stance.
Those claims are more credible than a blanket bullish pitch because they include conditions under which the view would be wrong. If the Nasdaq quickly recovers support and weekly momentum turns up, the bearish intermediate thesis weakens. If bitcoin breaks below the proposed base and long-term momentum deteriorates, the constructive short-term view fails.
The ETF’s performance will provide a second test. Investors will be able to compare BNAV with bitcoin and passive ETPs across rallies, declines and sideways periods. Until a live record exists, claims about improved risk-adjusted performance remain an objective rather than an accomplished result.
Technical Analysis Has Value as a Discipline, Not as Certainty
Critics often reject technical analysis because a moving average cannot know the future. Practitioners respond that forecasting certainty is not the goal. The purpose is to impose a repeatable framework on price, trend and risk.
There are legitimate reasons technical tools can contain information. Prices aggregate the decisions of millions of participants. Trends can persist because institutions build or unwind positions over time, analysts revise forecasts gradually and investors anchor to prior prices. Momentum has been documented across asset classes in academic finance, although implementation costs and regime changes matter.
There are equally legitimate reasons signals fail. The same indicators are widely known, parameters can be optimized after the fact and market behavior changes. Support levels can become self-fulfilling for a time, then collapse when a new fundamental event overwhelms them. A chart can identify that sellers are in control without explaining why.
The strongest application combines technical and fundamental analysis. Fundamentals identify what an asset may be worth and which variables matter. Technicals identify how the market is responding, where risk has increased and whether price confirms the thesis. A company can be fundamentally attractive but technically weak; an investor may decide to wait, reduce position size or accept the volatility. Another investor may ignore timing and focus on a long horizon.
BNAV represents a pure version of the technical approach because allocation changes are driven by price-based indicators rather than bitcoin valuation. That makes the fund a clear experiment. Its future record will show whether the model can add value after fees in a market famous for rapid reversals.
Three Plausible Market Scenarios From Here
Scenario One: The Correction Extends Toward Lower Support
In the bearish scenario, the July 29 rebound fails, the Nasdaq-100 remains below its 50-day moving average and weekly momentum stays negative. Semiconductor weakness spreads to cloud platforms, software, data-center suppliers and industrial beneficiaries. Oil remains elevated, bond yields rise and the Fed keeps open the possibility of a September hike.
Under those conditions, Stockton’s estimate of another 5% to 6% decline becomes plausible. The S&P 500 may fall less than the Nasdaq-100 because of sector diversification, but rotation would probably not prevent a broader correction. Bitcoin’s relative strength would face a severe test; a break below $58,000 would weaken the basing thesis.
Scenario Two: A Volatile Bottoming Process Develops
In the middle scenario, the Nasdaq makes marginal new lows or retests the July trough, but selling pressure diminishes. Market breadth improves, short-term momentum turns up and leading companies stop making new lows despite negative headlines. Oil stabilizes, the Fed does not intensify its hawkish message and earnings show that AI demand remains strong enough to support the capital cycle.
This would fit Stockton’s preferred sequence: oversold conditions, stabilization and improving short-term momentum. The market might remain choppy for weeks while weekly indicators bottom. Bitcoin could continue to build a base between roughly $58,000 and $65,000.
Scenario Three: The Fed-Day Reversal Becomes a Fast Recovery
In the bullish scenario, the July 29 intraday reversal marks a failed breakdown. QQQ reclaims the 50-day moving average, semiconductor shares recover and mega-cap earnings restore confidence in AI returns. Oil retreats as geopolitical tensions ease, reducing pressure on inflation expectations and yields.
A rapid recovery would challenge the weekly sell signal and punish investors who reduced exposure late in the decline. It would also expose the timing risk in tactical strategies: a model that waits for long-term confirmation may remain at lower exposure during the first stage of the rebound.
None of these scenarios is a forecast. They identify the evidence that would strengthen or weaken the current technical thesis.
What Investors Should Watch Next
The most useful indicators are not a collection of arbitrary chart lines. They are observable developments that connect price action with the economic story.
- Whether the Nasdaq-100 reclaims its 50-day moving average: A sustained recovery would reduce the significance of the breakdown.
- Semiconductor relative strength: The AI trade is unlikely to regain durable leadership if the chip index continues making new lows.
- Market breadth: A healthier bottom would include more stocks holding above support and participating in rebounds.
- AI capital-spending guidance: Investors need evidence that revenue and cash returns can keep pace with infrastructure commitments.
- Long-term Treasury yields: Higher yields would keep pressure on growth-stock valuations even if earnings remain solid.
- Oil persistence: A one-day geopolitical spike has different implications from several weeks above $90 Brent.
- Fed communication: The three dissents make the September meeting and incoming inflation data unusually important.
- Bitcoin’s $58,000 support zone: Holding above it would support the base-building thesis; a decisive break would damage it.
- BNAV’s live allocation and tracking: The fund’s holdings will reveal how its tactical model behaves during real volatility.
A Timeline of the 2026 Market Setup
The late-July correction makes more sense when viewed as the reversal of an unusually rapid sequence of market narratives rather than as an isolated reaction to one earnings report.
First Quarter: Bitcoin Weakens While Equities Absorb Macro Uncertainty
Bitcoin entered 2026 under pressure and fell 22.6% during the first quarter, according to NYDIG’s calculations. The decline reflected a mix of reduced spot demand, leverage, higher real yields and crypto-specific disappointment. Technology equities were volatile as investors weighed inflation, the Middle East conflict and uncertainty about the path of monetary policy.
The divergence between bitcoin and the Nasdaq began here. Both are frequently described as liquidity-sensitive risk assets, yet bitcoin’s decline was much larger. That early weakness later became relevant to Stockton’s July view: bitcoin had already traveled further through its adjustment before the Nasdaq-100 began its own correction.
March and April: A Powerful Equity Recovery
The Nasdaq-100 rebounded sharply from its March lows. Nasdaq research described April as one of the index’s strongest months in decades, supported by improving earnings estimates and continued enthusiasm for AI infrastructure. The rebound restored confidence that large technology companies could absorb high capital spending while maintaining strong profit growth.
That recovery also increased the risk of crowding. When an index rises quickly and the same companies lead across multiple strategies, more investors become sensitive to the same earnings surprises. Momentum funds, growth portfolios, options dealers and retail traders can all respond to a break in similar ways.
May and Early June: New Highs and Maximum Confidence
By early June, the Nasdaq-100 had reached a new peak after a gain of more than 30% from the March trough. The S&P 500 also advanced, but its sector mix created a different pattern. Technology remained central, while financials, industrials and other groups provided additional support.
At this stage, the market was pricing more than strong demand. It was pricing continued execution, favorable financing conditions and a relatively smooth path from AI capital expenditure to revenue. The risk was not that the companies lacked real businesses. The risk was that their shares allowed little room for ordinary disappointment.
June: Bitcoin Continues to Lag
Bitcoin declined another 13.4% during the second quarter even as technology equities rallied. The asset tested the vicinity of $60,000 and at times traded lower. Crypto derivatives and leverage remained important, while spot buyers appeared less aggressive than during prior rallies.
This produced an unusual cross-asset picture: bitcoin was behaving as though financial conditions were restrictive, while the Nasdaq-100 was behaving as though AI earnings could overpower those conditions. One of those narratives eventually had to change, or the correlation relationship had to remain unusually weak.
Mid-July: The AI Trade Begins to Fracture
The first visible cracks appeared in the segments most exposed to AI expectations. Software companies had already faced concerns that generative AI could weaken pricing or alter competitive advantages. Hardware and chip companies initially looked safer because demand for computing capacity remained strong. The late-July decline showed that even infrastructure suppliers were vulnerable when valuations and expectations became too demanding.
Nasdaq research dated the broader AI ecosystem selloff from the June 2 equity highs. By July 17, the Nasdaq-100 was down about 4% for that week, while the 10-year Treasury yield remained elevated. The combination of falling prices and stable or rising yields removed an important source of valuation support.
July 23–28: Earnings and Oil Accelerate the Adjustment
Large technology earnings shifted the debate from whether AI demand existed to whether returns justified spending. At the same time, Middle East developments pushed oil above $100 before a temporary de-escalation caused a sharp retreat. The volatility made it difficult for investors to separate temporary geopolitical pricing from a persistent inflation shock.
Semiconductor shares suffered increasingly large declines. The Philadelphia Semiconductor Index moved into a bear-market-sized drawdown from its late-June high. In South Korea, leveraged positions and crowded enthusiasm amplified losses in SK Hynix and other AI-linked stocks.
July 29: Correction, Fed Hold, Oil Shock and Reversal
The July 29 session concentrated all of these forces. U.S. equities opened lower, technology and industrial shares sold off, and crude oil surged. The Fed then held rates, but with three dissents for a hike. Technology shares recovered sharply from their lows as investors interpreted the decision and press conference as less severe than feared.
The result was not a clean resolution. The Nasdaq-100 remained near correction territory, oil closed sharply higher, the Fed revealed a more divided committee and bitcoin held around $64,000. That is why Stockton’s multiweek framework remained relevant even after the intraday rebound.
Why Index Concentration Raises Both Return Potential and Drawdown Risk
The Nasdaq-100’s concentration is often discussed as though it were automatically dangerous. Concentration is better understood as a source of both strength and fragility.
When the largest companies have superior revenue growth, high margins, strong balance sheets and durable competitive positions, a market-cap-weighted index benefits by allocating more weight to them as they rise. That mechanism helped QQQ outperform many broader benchmarks during the development of cloud computing, mobile platforms, digital advertising and the first stages of the AI cycle.
The same mechanism increases sensitivity when leadership reverses. A diversified portfolio can absorb a 20% decline in a small holding with limited damage. An index in which the largest technology companies represent a substantial share of total weight cannot. Even if most constituents are stable, weakness in the top positions can dominate the return.
Concentration also changes the meaning of “earnings season.” A handful of reports can determine the direction of the entire benchmark. Microsoft and Meta were scheduled to report after the July 29 close, with Amazon and other large platforms following. Investors were not merely evaluating individual companies. They were using those reports to estimate the durability of the AI spending cycle for chipmakers, networking suppliers, utilities, construction companies and software developers.
The valuation effect is equally concentrated. Large technology firms often trade at higher earnings multiples than mature industrial or financial companies because investors expect faster growth. When real yields rise, those multiples can compress together. An index heavily exposed to long-duration growth therefore reacts more strongly to changes in bond yields than an index with more banks, energy producers and dividend-paying defensives.
Stockton’s technical warning can be interpreted as a statement about concentration. The Nasdaq-100 lost momentum first because its leaders weakened. The S&P 500 held longer because rotation offset some of the damage. Once the broader index broke support, the market no longer had the same degree of diversification protection.
The Earnings Bar Was Set by the Rally
Markets do not grade earnings against last year alone. They grade results against expectations embedded in the current price. A company can increase earnings 40% and fall if investors expected 50%. It can report lower profit and rise if the decline is less severe than feared.
AI companies entered the summer with exceptionally high expectations. Supplier backlogs, data-center construction and cloud demand were visible. The uncertainty involved the slope and duration of growth. Investors had to estimate how long shortages would persist, how quickly competitors would add capacity and whether customers would continue spending at the same rate after initial deployments.
Capital spending complicates the analysis because it affects different companies differently. For chipmakers and equipment suppliers, customer capex is revenue. For cloud platforms, capex is a cash outflow that may support future revenue. The same announcement can therefore be bullish for a supplier and bearish for the buyer if investors believe the spending is necessary but low-return.
Cash Flow Is Becoming More Important Than Adjusted Earnings
During the early phase of a growth cycle, investors often focus on revenue and adjusted earnings. As capital intensity rises, free cash flow becomes more important. Depreciation can lag actual spending, meaning current earnings may not fully show the economic cost of replacing and expanding infrastructure.
Data centers also require land, power agreements, cooling, networking and long lead times. The economic return depends on utilization. A server purchased today can create value if customers pay for its capacity at attractive margins. It can destroy value if it becomes obsolete quickly or sits underused.
The market correction is therefore a demand for evidence. Investors want to see not only AI usage but also pricing, renewal behavior, productivity gains and margins. Companies that can demonstrate those outcomes may regain leadership before the rest of the sector.
How BNAV’s Synthetic Bitcoin Exposure Works in Practice
The initial BNAV holdings consisted of a long call and a short put on IBIT with the same expiration and strike. That combination is commonly called a synthetic long position because it can approximate the payoff of owning the underlying security.
A call option gives the buyer the right to purchase the underlying at the strike price. Its value rises when the underlying rises above the strike. A put option gives the buyer the right to sell at the strike. The seller of that put is obligated to absorb losses when the underlying falls below the strike.
By buying the call and selling the put, the fund participates on both sides. If IBIT rises, the call gains value. If IBIT falls, the written put loses value. The combined payoff resembles ownership, subject to premiums, interest rates, dividends, early-exercise terms and execution.
This structure can be capital efficient. The fund can obtain economic exposure while holding Treasury securities or cash as collateral. The collateral earns interest, which can partly offset option costs. The trade also allows the fund to adjust notional exposure without buying or selling large quantities of the underlying ETP.
Capital efficiency is not free leverage. The short put creates downside obligation. The fund must maintain sufficient collateral and liquidity, and rapid declines can produce large mark-to-market losses. Options can also trade with wider spreads during stress, increasing the cost of changing exposure precisely when the model wants to act.
Why the Fund Uses an Underlying Bitcoin ETP
BNAV is a registered investment company and does not hold bitcoin directly. Using options on a listed bitcoin ETP places the derivative on a regulated U.S. options market with clearing through the Options Clearing Corporation. That provides standardized settlement infrastructure.
The trade-off is a layered structure. Bitcoin’s price influences IBIT; IBIT’s price and implied volatility influence the options; the options determine BNAV’s exposure. Each layer can introduce small tracking differences. In normal markets those differences may be limited. In stressed markets, premiums, discounts, volatility and liquidity can widen.
Why a 70% Baseline Is a Strategic Choice
A tactical fund could theoretically move from zero to 150%. BNAV instead maintains approximately 70% exposure. That choice reduces the risk of being entirely absent during a sudden bitcoin rally. Bitcoin trades continuously, while U.S. ETFs and listed options have defined market hours. A major overnight or weekend move can occur before the fund can adjust.
The baseline also reveals the strategy’s philosophical bias. It assumes long-term participation is desirable and that technical signals should modify, not replace, the allocation. Investors should not interpret “risk-off” as “no bitcoin risk.”
Why 150% Is Not the Same as 1.5 Times Every Day
BNAV can reach approximately 150% exposure, but it does not promise 1.5 times bitcoin’s daily return. Exposure may be below 150%, and options can have non-linear behavior. Cash returns, fees and execution also affect results.
A fixed daily leveraged product resets at the end of each session. Over multiple days, compounding can cause its return to differ substantially from a simple multiple of the underlying’s cumulative return. BNAV’s variable exposure creates a different path dependency: results depend on when the model changes allocations.
Simple Performance Math Shows Why Timing Matters
Hypothetical examples can clarify the strategy without predicting its results. These examples ignore fees, option pricing, taxes, trading costs and tracking differences.
A Sustained Bull Trend
Suppose bitcoin rises 40% after the model increases exposure to 150%. The gross directional contribution would be approximately 60%. A passive 100% exposure would gain approximately 40%. In this ideal scenario, leverage adds value.
A Sudden Decline Before the Model Reduces Risk
Suppose bitcoin falls 20% while BNAV is at 150%. The gross directional effect would be approximately negative 30%. If the fund then cuts exposure to 70% after the decline, it has absorbed magnified losses and may participate less in a rebound.
A Long Bear Market Detected Early
Suppose the model reduces exposure to 70% before a 50% bitcoin decline. The gross directional loss would be approximately 35%, compared with 50% for full exposure. That is still a severe drawdown, but materially smaller.
A Sideways Whipsaw
Suppose bitcoin falls 15%, rebounds 18% and then falls again. If the model reduces exposure after the first decline and increases it after the rebound, BNAV can participate less in the gain and more in the next loss. A passive position may finish near its starting point while the tactical strategy loses ground.
These examples explain why a tactical model should be evaluated over multiple regimes. One strong rally or one avoided decline is not enough to demonstrate skill. Investors need to see how the process performs during trends, reversals and ranges.
Historical Corrections Offer Context, Not a Template
Every technology correction invites comparisons with 2000 or 2022. Those episodes are useful only when the differences are kept clear.
The Dot-Com Bust
The late-1990s market contained many companies with weak business models, limited revenue and no profit. Valuations were often disconnected from present cash generation. When capital became less available, numerous firms failed.
The 2026 Nasdaq-100 is dominated by highly profitable global companies with large cash flows and established customer bases. Nasdaq research has emphasized that nearly all constituents reported positive net income and most generated free cash flow in 2025. That makes a complete replay of 2000 an imperfect analogy.
The relevant similarity is expectation. Profitable companies can still fall dramatically when investors pay too much for future growth. Cisco remained an important company after 2000, but its valuation had implied an extraordinary future. Business success and stock returns are related, not identical.
The 2022 Rate Shock
In 2022, rising inflation and aggressive monetary tightening compressed growth-stock valuations. Companies with profits far in the future suffered the most. The current environment shares the risk of elevated yields, but the policy starting point and economic conditions differ.
The July 2026 Fed decision showed that rate-hike risk had returned because of energy supply shocks and persistent inflation. That creates a partial resemblance to 2022: higher discount rates can overpower earnings growth for a time.
Ordinary Corrections in Secular Bull Markets
Strong bull markets frequently experience 10% corrections. They can clear leverage, reset sentiment and allow earnings to catch up with prices. The existence of a secular AI trend does not make corrections unusual; it may make them necessary.
The difference between a healthy correction and the start of a bear market is usually visible only in retrospect. A healthy correction stabilizes as earnings remain intact and financial conditions stop worsening. A bear market deepens when estimates fall, credit tightens and leadership fails to recover.
What the Current Setup Means for Different Investment Objectives
The same evidence can lead to different decisions because investors have different time horizons and constraints. The point is not to prescribe an action but to clarify the trade-offs.
Long-Horizon Equity Investors
An investor focused on ten-year business outcomes may view a 10% Nasdaq correction as normal volatility. The relevant questions are whether the leading companies retain competitive advantages, whether AI demand produces cash flow and whether valuations are reasonable relative to long-term growth.
Technical weakness may influence position sizing or entry timing without changing the fundamental thesis. A long horizon does not eliminate risk; it changes which evidence matters most.
Tactical Traders
A trader focused on weeks or months may place more weight on the 50-day moving average, weekly MACD and support zones. For that investor, the absence of stabilization is central because capital can be redeployed quickly if the trend improves.
Bitcoin Holders
A bitcoin holder choosing between direct exposure, a passive ETP and BNAV faces a structure decision. Direct ownership adds custody responsibilities. A passive ETP provides simple brokerage exposure. BNAV adds active timing and leverage in exchange for higher fees and model risk.
Risk-Controlled Portfolios
Portfolios with volatility limits may find a variable-exposure product conceptually attractive. The key issue is whether the fund’s 70% floor is low enough to meet the desired risk budget. During a severe bitcoin bear market, 70% exposure can still produce losses far larger than those of a diversified equity or bond portfolio.
The central lesson is that product labels do not determine suitability. “Tactical” does not mean low risk, and “ETF” does not mean diversified. Investors must examine the exposure, instruments and behavior under stress.
How to Judge Whether Stockton’s Call Was Right
Market forecasts are often evaluated too loosely. A commentator says prices may fall, the market drops at some point, and the call is declared correct even if the timing, magnitude or conditions were different. Stockton’s July 29 analysis can be assessed more rigorously because it contained identifiable components.
Time Horizon
She described an intermediate-term problem likely to remain relevant for several weeks. A one-day decline or rebound therefore does not settle the question. The appropriate evaluation window begins after the interview and extends through the period in which the weekly MACD signal remains active.
Direction
The core directional claim was that downside risk remained and that the Nasdaq-100 had not yet completed the correction. If the index moved promptly to new highs, held them and reversed its weekly momentum, the call would be weakened. If it tested lower support before stabilizing, the call would be strengthened.
Magnitude
Stockton identified another 5% to 6% of potential downside to the next support area. That zone is not an exact target, but it gives the forecast a measurable scale. A decline of only 1% followed by a sustained recovery would not validate the same thesis as a move toward that support.
Conditions for a Bottom
She wanted to see intermediate oversold conditions, stabilization and improving short-term momentum. A proper review should ask whether those signs appeared before the durable low. If the market bottomed without them, the model may have been too slow. If they appeared and helped identify the turn, the process would have demonstrated practical value.
Relative Asset Calls
Her analysis was not uniformly bearish. She was cautious on the Nasdaq, more constructive on bitcoin over shorter horizons and constructive on crude oil’s longer-term trend. Those relative judgments should be reviewed together. A forecast can be valuable because it identifies leadership and divergence even if every absolute price target is not reached.
This disciplined evaluation is especially important because Stockton manages products based on the same methodology. The relevant standard is not whether every public comment is perfect. It is whether the process produces repeatable, risk-adjusted results after fees.
Data Limitations Matter During a Fast-Moving Session
The July 29 article cutoff occurred before the U.S. equity market closed. Intraday prices can differ substantially from closing levels, especially on a Fed day. QQQ’s recovery from below $664 to roughly $673 illustrated that volatility. Any analysis using those prices should state the time, which is why the market snapshot is anchored at approximately 3:20 p.m. Eastern Time.
Index data also vary by instrument. The Nasdaq-100 cash index, QQQ, futures and total-return versions are related but not identical. QQQ includes fund expenses and can trade at a small premium or discount to net asset value. Futures incorporate financing and market expectations. A correction calculation based on QQQ can differ slightly from one based on the official NDX close.
Bitcoin creates another timing challenge because it trades continuously. A “daily” change depends on the selected cutoff and data provider. One platform may compare with midnight UTC, another with a rolling 24-hour window and another with a 4 p.m. reference rate. The approximately $63,983 figure in this article is a timestamped market snapshot, not a universal closing price.
Oil prices are more standardized but still require contract identification. Brent and WTI are different benchmarks, and front-month futures roll over. A chart showing resistance near $90 may refer to one contract or continuous series, while a news report cites another. That difference can explain apparent inconsistencies in technical levels.
These limitations do not make market reporting impossible. They require precision. Prices need timestamps, percentage moves need comparison points and forecasts need time horizons. Without those details, a market article can sound more certain than the data justify.
Why the Next Earnings Reports May Matter More Than the Next Chart Signal
Technical deterioration can continue until a fundamental event changes expectations. For the Nasdaq-100, the most likely catalyst is earnings from the largest AI spenders and suppliers.
Investors will examine cloud growth, AI revenue, backlog, capital expenditure, depreciation, free cash flow and management guidance. The most important question is not whether executives express confidence. It is whether disclosed numbers show that utilization and monetization are keeping pace with spending.
A strong report can reverse a technical breakdown if it changes the expected path of profits. A weak report can cause support to fail. This is why technical and fundamental analysis should not be treated as rival belief systems. The chart records how investors process earnings; the earnings explain why the chart may change.
The same applies to bitcoin. ETF flows, derivatives funding rates, realized volatility and macro policy can determine whether the $58,000 area becomes a durable base. BNAV’s model will respond to the resulting price pattern, but the underlying catalysts will come from outside the model.
For oil, geopolitical events and physical inventory data can overwhelm momentum readings in hours. A monthly MACD turn may describe the broader regime, while a ceasefire or supply disruption determines the next session.
The market is therefore approaching a sequence of tests rather than one decisive signal. Earnings will test the AI profit story. Inflation data will test the Fed’s hawkish minority. Oil will test the durability of the supply shock. Bitcoin will test its support zone. The quality of the eventual bottom will depend on how these fundamental outcomes interact with price.
Frequently Asked Questions
Is the Nasdaq-100 officially in a correction?
A correction is commonly defined as a decline of at least 10% from a recent high. The Nasdaq-100 traded around and at times beyond that threshold in late July 2026, depending on whether the calculation uses intraday or closing levels. The term describes the drawdown; it does not predict the next move.
How much further did Katie Stockton say the Nasdaq-100 could fall?
Stockton said the next support area in her technical work was approximately 5% to 6% below the level being discussed. That was a conditional support estimate, not a guaranteed price target.
Why did she say it was too early to buy the AI dip?
Her indicators had not yet shown the combination she looks for near an intermediate low: sufficiently oversold conditions, price stabilization and improving short-term momentum. The weekly momentum signal was still newly negative.
What is a weekly MACD sell signal?
It is a bearish momentum change calculated from weekly price data using moving average convergence-divergence. Weekly signals respond more slowly than daily signals and can remain in force for several weeks, but they can lag and produce false signals.
Why did the Fed hold rates instead of raising them?
The FOMC majority voted to maintain the 3.50% to 3.75% target range while assessing inflation, employment and uncertainty related to the Middle East. Three members preferred a quarter-point increase, showing that the hold was not unanimous.
Why are higher oil prices negative for technology stocks?
Persistent oil increases can raise inflation and bond yields, reducing the present value of long-duration growth profits. They can also increase energy, transport and construction costs associated with the AI infrastructure buildout.
Was bitcoin decoupling from the Nasdaq-100?
Bitcoin showed short-term relative strength while technology stocks weakened, but correlation changes across time windows. A brief divergence does not establish bitcoin as a reliable hedge against equity declines.
What bitcoin level did Stockton identify as support?
She discussed the roughly $50,000-to-$58,000 area as an initial long-term support and basing region, with particular attention to the recent stabilization near $58,000.
What is BNAV?
BNAV is the Amplify Fairlead Tactical Bitcoin ETF, launched July 29, 2026. It uses a technical model to adjust bitcoin exposure between approximately 70% and 150% of net assets.
Does BNAV own bitcoin directly?
No. The fund expects to obtain exposure mainly through options on bitcoin ETPs, with flexibility to use bitcoin futures and related instruments. It may hold Treasuries and cash for collateral and liquidity.
Is BNAV safer than owning bitcoin?
Not necessarily. At 70% exposure it may decline less than bitcoin in some down markets, but it remains materially exposed. When leveraged to 150%, losses can be magnified. The fund also adds model, options, futures, liquidity and fee risks.
What is BNAV’s expense ratio?
The stated total annual operating expense ratio is 0.74%. Trading costs, option spreads and other portfolio transaction costs are not fully captured by that figure.
How is BNAV different from a 2x daily bitcoin ETF?
BNAV does not target a fixed daily multiple. Its exposure changes between approximately 70% and 150% based on Fairlead’s model. A daily leveraged ETF generally resets its target every day, creating a different form of compounding and path dependence.
What would invalidate the bearish Nasdaq view?
A sustained recovery above broken support and the 50-day moving average, improving breadth and a reversal in weekly momentum would weaken the intermediate-term bearish thesis.
What would invalidate the constructive bitcoin view?
A decisive break below the proposed support zone, renewed downside momentum and failure to recover would undermine the idea that bitcoin is building a base.
Final Assessment
The late-July Nasdaq-100 correction is not simply a technical event and not simply an AI earnings story. It is the intersection of crowded positioning, demanding valuations, questions about the return on extraordinary capital spending, a renewed energy shock and a Federal Reserve that is debating whether policy is restrictive enough.
Stockton’s warning is credible because it is specific and conditional. The Nasdaq-100 had broken support, the weekly momentum signal had turned down and the semiconductor core of the AI trade had already suffered a much deeper decline. Her argument was not that the AI investment cycle was over. It was that price had not yet produced the evidence required to call the decline a durable buying opportunity.
The strongest counterargument is the July 29 intraday reversal. Technology shares recovered sharply after the Fed held rates, and the index’s largest companies remain profitable, cash-generative and central to a real infrastructure cycle. A correction in strong companies can end faster than bearish indicators expect, particularly when positioning becomes one-sided.
Bitcoin’s stabilization near $64,000 is a genuine relative-strength signal, but it should be judged against the asset’s large first-half decline. The market may be building a base, or it may be pausing before another test of support. The long-term trend still needs confirmation.
BNAV translates this uncertainty into a product: stay materially exposed, reduce risk when trends weaken and add leverage when multiple time horizons align. The concept is coherent. Its success will depend on execution. A model must identify trends early enough to avoid the worst declines and remain flexible enough not to miss the reversals that define bitcoin trading.
The next few weeks will provide clearer evidence. The most important signs are whether the Nasdaq-100 can reclaim broken support, whether semiconductor shares stop underperforming, whether oil’s surge persists and whether bitcoin can hold above its recent base. Until those questions resolve, the market is better described as a correction in progress than a completed reset.
This article is provided for general informational purposes and does not constitute financial, investment, tax, or legal advice.
Sources
- Federal Reserve: July 29, 2026 FOMC statement
- Federal Reserve: July 29, 2026 implementation note
- Federal Reserve: Kevin Warsh biography
- Amplify ETFs: BNAV fund page, holdings and fund details
- Amplify Fairlead Tactical Bitcoin ETF prospectus dated July 27, 2026
- Amplify ETFs: BNAV launch announcement
- Nasdaq Global Indexes: Nasdaq-100 overview
- Nasdaq Global Indexes: Nasdaq-100 historical data
- Nasdaq research: AI earnings, capital spending and the 2026 equity selloff
- Nasdaq research: AI capital expenditure and Nasdaq-100 leverage dynamics
- Reuters: South Korean equity rout and SK Hynix earnings disappointment
- Reuters: Market stress from technology weakness, oil and inflation fears
- Reuters: Oil rises nearly 8% on Middle East conflict and inventory decline
- U.S. Energy Information Administration: Weekly Petroleum Status Report
- NYDIG: Bitcoin second-quarter 2026 review
- CME Group: Bitcoin and Nasdaq-100 correlation research
- U.S. Securities and Exchange Commission: Approval of spot bitcoin ETP shares
- CMT Association: Using MACD to identify long-term trends
- Fairlead Strategies: ETF process and tactical model overview
Affiliate disclosure: Businessfinance.news may earn compensation from qualifying actions completed through selected links on this website, at no additional cost to the reader. Affiliate relationships do not influence our editorial reporting, analysis, or conclusions.