Last updated: July 29, 2026, 9:15 a.m. CEST. Market figures are dated and may change after the stated research cutoff.
South Korea’s stock market suffered one of the most violent reversals in its history on July 29, 2026, even though SK hynix reported the strongest quarterly earnings in the memory-chip maker’s history. The KOSPI fell as much as 12.6% during the session, triggering a 20-minute marketwide trading halt, before recovering part of the loss to close 6% lower. The previous session had already produced a decline of nearly 11%. At the intraday low, approximately $2.18 trillion had been erased from the value of Seoul-listed equities, according to Reuters’ reporting on the South Korean stock rout.
The immediate catalyst was SK hynix’s second-quarter report. Revenue, operating profit and net profit all reached records. Yet revenue and operating profit came in below unusually elevated analyst expectations, advanced HBM4 shipments were slower than some investors had assumed, and management did not provide the detailed shareholder-return plan that parts of the market wanted. SK hynix shares dropped almost 20% intraday and closed 9.6% lower. Samsung Electronics fell as much as 14% before closing down 5.2%. Together, the two semiconductor companies represented more than half of the KOSPI’s market value at the time, turning company-specific disappointment into an index-level shock.
China’s reported progress in domestically produced immersion deep-ultraviolet lithography added a second source of anxiety. The development does not mean that China has matched ASML’s most advanced extreme-ultraviolet systems, nor does it establish that Chinese tools can yet deliver commercially competitive throughput, reliability or manufacturing yield. It does, however, challenge the assumption that export controls can indefinitely preserve foreign suppliers’ dominance in every part of the chip-equipment stack. That distinction matters. The report was not evidence that ASML’s technological moat had disappeared, but it was enough to force investors to put a higher probability on long-term Chinese competition.
The deeper explanation for the selloff lies in market structure. South Korea had become the most successful major equity market of 2026, rising 41.5% in U.S.-dollar terms even after the two-day rout. Much of that performance was concentrated in a small group of AI-linked semiconductor stocks. Retail traders had added leverage through margin borrowing and single-stock leveraged exchange-traded funds. When the leading shares reversed, daily-reset products, forced liquidations, program trading and evaporating liquidity turned a normal reassessment of earnings into a disorderly unwind.
For global investors, the episode is a warning about the difference between a strong business and a safe market price. SK hynix’s operating performance was extraordinary. The stock still fell because the valuation and positioning had been built around results that were even more extraordinary. The question raised by the Korean rout is therefore larger than whether one earnings report was good or bad. It is whether the AI capital-spending cycle can continue to validate the financial expectations already embedded in memory manufacturers, chip-equipment suppliers, data-center builders and leveraged investment products.
Key Takeaways
- Main development: The KOSPI fell as much as 12.6% on July 29, 2026, triggered a 20-minute trading halt and closed 6% lower after an almost 11% decline the previous day.
- SK hynix earnings: The company reported second-quarter revenue of 79.3187 trillion won, operating profit of 60.5426 trillion won and net profit of 93.9226 trillion won, all quarterly records.
- Expectation gap: Operating profit missed the 64 trillion won LSEG SmartEstimate cited by Reuters, while revenue missed an estimate of approximately 84 trillion won.
- Market concentration: SK hynix and Samsung Electronics together accounted for more than half of the KOSPI’s market value, magnifying their effect on the benchmark.
- Leverage problem: Margin positions and single-stock leveraged ETFs accelerated losses as traders were forced to reduce exposure.
- China factor: A reported Chinese immersion-DUV program is strategically important, but initial production is small and the machines reportedly remain behind ASML in performance and reliability.
- What matters next: Investors will focus on HBM4 shipment timing, hyperscaler capital spending, SK hynix’s shareholder-return policy, semiconductor capacity growth and the quality of China’s domestic lithography tools.
Fact Box
The July 29 Market Shock
- KOSPI intraday decline: as much as 12.6%
- KOSPI closing decline: 6%
- Previous session: nearly 11% lower
- Estimated value erased at the intraday low: as much as $2.18 trillion
- SK hynix: nearly 20% lower intraday; 9.6% lower at the close
- Samsung Electronics: as much as 14% lower intraday; 5.2% lower at the close
- KOSPI year-to-date return after the selloff: 41.5% in U.S.-dollar terms
Original source: Reuters market report, July 29, 2026
What Happened in South Korea’s AI-Chip Rout
The first important point is chronological. The market stress did not begin with the publication of SK hynix’s results on Wednesday morning. By then, the Korean semiconductor trade was already unstable. On Tuesday, July 28, the KOSPI fell nearly 11% as investors sold Samsung Electronics, SK hynix and other AI-linked shares. Concerns included the financing burden associated with global data-center construction, the possibility of slower AI infrastructure spending, expanding memory capacity and competitive pressure from Chinese semiconductor companies.
The report that China had started manufacturing domestically developed immersion DUV lithography machines intensified those concerns. The news challenged a widely held belief that China’s semiconductor industry would remain dependent on foreign lithography equipment for many years. European chip-equipment shares fell, including ASML, BE Semiconductor Industries and Soitec. Asian semiconductor shares weakened as investors reconsidered the durability of competitive advantages across the supply chain.
SK hynix then released earnings before the Korean market opened on July 29. On an ordinary valuation, the numbers would have been difficult to describe as disappointing. Revenue rose 257% from the prior-year period. Operating profit increased 557%. The operating margin reached 76%. The company’s cash position strengthened, debt declined and demand for high-bandwidth memory remained robust. Yet the stock market was not comparing the quarter with an ordinary baseline. It was comparing the reported numbers with expectations formed during a spectacular rally.
That difference between absolute strength and relative disappointment is central to understanding the selloff. A company can report record revenue and profit while its shares fall if the market expected even more. The share price reflects the discounted value of future cash flows, not simply the quality of the most recent quarter. When a stock has risen rapidly, the bar for a favorable reaction can become so high that an excellent result is treated as a miss.
The opening decline in SK hynix quickly spread through the benchmark. The company and Samsung Electronics had become dominant weights in the KOSPI. Investors who owned the index indirectly owned a large semiconductor position. Leveraged funds tied to individual chip stocks had to rebalance. Margin calls forced some traders to sell. Buyers who might normally have absorbed the pressure stepped away because intraday volatility made pricing difficult. The exchange’s circuit breaker paused trading, but the pause could not remove the underlying need to reduce leverage.
By the close, the KOSPI had recovered roughly half of its maximum intraday decline. That recovery is important because it shows that the 12.6% loss was not the final daily return. It also demonstrates how unstable liquidity had become. A market that can move from a double-digit loss to a 6% closing decline in a few hours is not producing a clean judgment about long-term value. It is processing positioning, collateral requirements, risk limits and the disappearance of marginal buyers.
A record decline after a record rally
The scale of the fall can appear contradictory when viewed alongside the KOSPI’s year-to-date performance. After the two-day rout, the benchmark was still up 41.5% in U.S.-dollar terms for 2026, according to Reuters. That made it the best-performing major market of the year at the research cutoff. The index had nevertheless lost almost 40% from a peak reached little more than a month earlier.
Both facts can be true because the rally before the peak was exceptionally steep. Investors who bought early in the year could still hold large gains. Investors who entered near the top, particularly with borrowed money or leveraged products, could face severe losses. This uneven distribution of returns helps explain why market commentary could simultaneously describe the KOSPI as the year’s strongest major benchmark and the center of a historic rout.
The path also matters for leveraged vehicles. A daily leveraged ETF is designed to deliver a multiple of one day’s return, not a fixed multiple of the underlying stock’s return over weeks or months. In a volatile market, repeated gains and losses can erode value through compounding. A trader can therefore be correct that the underlying stock remains higher over a longer period and still lose heavily in a daily-reset leveraged product.
SK hynix Q2 2026 Earnings: The Numbers Behind the Disappointment
SK hynix reported revenue of 79.3187 trillion won for the April-to-June quarter, operating profit of 60.5426 trillion won and net profit of 93.9226 trillion won. The company’s official second-quarter financial-results announcement described all three measures as record quarterly performance.
Revenue increased 257% from 22.232 trillion won in the second quarter of 2025. Operating profit increased 557% from 9.2129 trillion won. Compared with the first quarter of 2026, revenue rose from 52.5763 trillion won and operating profit rose from 37.6103 trillion won. The operating margin expanded to 76%, an extraordinary level for a memory manufacturer operating in an industry historically defined by severe pricing cycles.
Net profit requires more careful interpretation. It exceeded operating profit and produced a net margin of 118%, an outcome that cannot be explained by the core sale of memory chips alone. Reuters reported that net profit included 63.3 trillion won of gains from investment assets. Analysts attributed much of that increase to the completion of the sale of SK hynix’s investment in Kioxia. The result was real under the company’s accounting, but it was not a recurring measure of memory-business profitability.
This distinction is essential. A reader who looks only at net income might conclude that the company’s operating economics produced more profit than revenue. In fact, the quarter combined a powerful operating performance with a large investment-related gain. Operating profit is the cleaner measure for judging the core business during the period, while cash flow, working capital, capital expenditure and future pricing determine how much of that profitability can be sustained.
| Measure | Q2 2026 | Q1 2026 | Q2 2025 | Interpretation |
|---|---|---|---|---|
| Revenue | 79.3187 trillion won | 52.5763 trillion won | 22.232 trillion won | Record sales supported by high-value DRAM, HBM and enterprise SSD products. |
| Operating profit | 60.5426 trillion won | 37.6103 trillion won | 9.2129 trillion won | Record core profitability, but below the 64 trillion won estimate cited by Reuters. |
| Operating margin | 76% | Approximately 72% | Approximately 41% | Shows exceptional pricing and product mix, though margins at this level invite questions about cyclicality. |
| Net profit | 93.9226 trillion won | Not used for this comparison | Not used for this comparison | Includes a large investment-asset gain and should not be treated as recurring operating profit. |
Source: SK hynix. Margin comparisons are calculated from the reported revenue and operating-profit figures and are approximate where shown.
Why a 557% increase was not enough
The most direct reason was the expectation gap. Reuters reported that the 60.5 trillion won operating profit was below a 64 trillion won LSEG SmartEstimate. Revenue of 79.3 trillion won was below an estimate of approximately 84 trillion won. Those differences represented only a fraction of the company’s total results, but markets often react more strongly to the direction of an expectations revision than to the absolute level of profit.
Investors had several specific reasons to expect more. First, memory prices had risen sharply. Second, SK hynix had become one of the leading suppliers of high-bandwidth memory used alongside AI accelerators. Third, global technology companies had announced enormous data-center capital-expenditure plans. Fourth, the company’s share price had already signaled that investors expected a prolonged period of scarcity pricing and technological leadership.
A miss becomes more consequential when the market has little tolerance for execution delays. Reuters said slower-than-expected HBM4 shipments delayed revenue recognition in the quarter. SK hynix stated that HBM4 had achieved customer-required operating speeds and that mass shipments had begun, but the timing of deliveries still mattered. In a market priced around rapid generation changes, a quarter of delayed product mix can affect both reported revenue and assumptions about competitive positioning.
The miss also exposed a tension within the company’s strategy. Long-term supply agreements can reduce the volatility of future demand, support investment decisions and protect customers from shortages. Yet those contracts may also limit the producer’s ability to capture every increase in spot or contract memory pricing. Investors who bought the stock for maximum exposure to rising memory prices could view greater contractual stability as a reduction in near-term upside.
The cash question
SK hynix ended the quarter with 88 trillion won of cash and cash equivalents, an increase of 33.6 trillion won from the previous quarter. Total debt declined by 0.7 trillion won to 18.6 trillion won, leaving a net cash position of 69.4 trillion won, according to the company. Reuters reported that management ultimately aims to increase net cash above 100 trillion won.
That balance-sheet improvement changes the nature of the investor debate. During a downturn, cash protects the company and allows it to continue research, equipment purchases and capacity construction. During a boom, a rapidly expanding net cash position raises questions about dividends, buybacks, acquisitions and the appropriate level of capital expenditure. Management said it planned to disclose a shareholder-return policy later in 2026 but did not provide the timing, size or structure investors wanted on July 29.
The absence of detail was not evidence that the company intended to withhold capital permanently. It was evidence that the market had priced in a more immediate transfer of AI-cycle profits to shareholders. When the anticipated catalyst did not arrive, traders had one fewer reason to defend the stock during a forced deleveraging event.
Capital expenditure and the risk of building into the peak
SK hynix planned to raise 2026 capital expenditure to the high-40-trillion-won range, up from 30.2 trillion won in 2025, Reuters reported. The company argued that additional supply requests from major technology customers continued to increase and that AI-service revenue was supporting ongoing infrastructure investment.
The strategic logic is understandable. High-bandwidth memory is difficult to manufacture, qualification periods are long, and customers need predictable supply. A producer that underinvests during a structural demand increase risks surrendering market share. Capacity also cannot be created instantly. Clean rooms, wafer-fabrication equipment, packaging lines and supplier ecosystems require multi-year planning.
The opposing risk is equally familiar. Memory is one of the world’s most cyclical technology industries. When several producers expand at the same time, supply can catch demand, pricing can fall and margins can compress rapidly. The greater the profit at the top of the cycle, the easier it becomes to justify projects that look less attractive after prices normalize. The market’s concern was not that SK hynix lacked demand in the second quarter. It was that today’s extraordinary profitability might induce enough investment to weaken tomorrow’s pricing.
Why High-Bandwidth Memory Became the Center of the AI Trade
High-bandwidth memory, usually shortened to HBM, is not simply faster conventional memory. It is a stack of DRAM dies connected vertically and placed close to a processor or accelerator through advanced packaging. The architecture is designed to move large quantities of data with high bandwidth and relatively efficient power use. That makes HBM especially valuable for artificial-intelligence training and inference, where processors must repeatedly access enormous model parameters and intermediate calculations.
A powerful accelerator can be constrained by how quickly data reaches its computing cores. Increasing arithmetic performance without increasing memory bandwidth produces a bottleneck: the processor is capable of more calculations than the memory system can feed. HBM addresses that imbalance by providing wide interfaces and short physical connections. The result is a memory product whose strategic importance has grown alongside the scale of AI models.
This matters financially because HBM has different economics from commodity memory. It requires leading DRAM technology, sophisticated stacking, thermal management, advanced packaging and close cooperation with accelerator designers and foundries. Qualification is demanding. A failure in one component can affect the value of the entire package. Suppliers that establish reliable production and strong customer relationships can therefore earn higher margins than they would in undifferentiated commodity products.
SK hynix was an early leader in successive HBM generations. Its 2026 results reflected the commercial value of that position. The company said high-value products including HBM, AI-server DRAM and enterprise solid-state drives drove the quarter. It also said HBM4 had reached customer-required operating speeds and that mass shipments had begun. Earlier company materials described HBM4 as doubling the number of input/output lanes from 1,024 to 2,048 and improving power efficiency compared with the previous generation.
The market nonetheless treated the pace of HBM4 revenue recognition as important because product transitions create windows in which competitive leadership can shift. A supplier can lead one generation and lose share in the next if yields, packaging, customer qualification or delivery schedules slip. Samsung Electronics and Micron Technology are not passive competitors. Each has incentives to expand capacity, improve performance and win a larger share of accelerator programs.
HBM demand is connected to a broader spending chain
Demand for HBM ultimately depends on decisions made far beyond the memory manufacturer. Cloud companies decide how many data centers to build. Accelerator designers decide the quantity and type of memory attached to each chip. Foundries decide how much advanced logic capacity to add. Packaging suppliers determine how quickly processors and memory stacks can be integrated. Utilities and grid operators determine whether sufficient power can reach data-center sites. Lenders and capital markets determine how cheaply projects can be financed.
This chain explains why concerns about AI financing affected SK hynix even though the company reported strong customer demand. A memory supplier may have firm near-term orders while the market questions whether the end customer can maintain the same spending rate for several years. Equity valuations extend far beyond the next quarter. If investors reduce the assumed duration of the spending boom, the value of a highly profitable supplier can fall before its order book visibly weakens.
There is also a difference between demand for AI services and returns on AI infrastructure. Users may adopt AI rapidly while providers struggle to convert usage into profits sufficient to justify every data-center project. Conversely, service revenue could grow quickly enough to support sustained investment. The earnings report did not settle that debate. It showed that the current memory market was exceptionally strong and that customers continued to request supply. It did not prove the final return on all planned AI infrastructure.
Why long-term agreements can be both protection and constraint
SK hynix said it had finalized long-term agreements with around 10 customers and was discussing additional arrangements with major industry participants. Reuters reported that these contracts were typically around five years and could include deposits or other safeguards intended to support performance.
For the company, such agreements offer several advantages. They improve visibility before management commits billions of dollars to new capacity. They can reduce the risk that a customer cancels orders after a market downturn. They help synchronize product road maps and qualification schedules. They may also make it easier to finance plants because future demand is supported by contractual commitments rather than broad forecasts.
For customers, the arrangements can secure critical components and reduce exposure to shortages. AI accelerators have little value if memory or packaging is unavailable. A cloud operator may therefore prefer to commit early, even at the cost of reduced purchasing flexibility.
The tradeoff is pricing. A long-term agreement can include formulas, floors, ceilings or renegotiation mechanisms that limit the supplier’s ability to collect the highest possible price during a shortage. The exact economics of SK hynix’s contracts were not publicly disclosed. Investors therefore had to judge whether the agreements primarily protected volume, preserved price or traded some upside for stability. The lack of detail created room for a skeptical interpretation during an already fragile market.
The Memory Cycle Has Not Disappeared
The phrase “AI supercycle” can create the impression that the semiconductor industry has escaped its historical cyclicality. The second-quarter numbers were evidence of structural demand growth, but they were not proof that the memory cycle had ended.
DRAM and NAND markets are driven by a familiar interaction. Producers invest when demand and prices are strong. New capacity arrives with a delay. Customers build inventories when shortages appear likely and reduce inventories when demand slows or supply improves. Because memory products are relatively standardized, additional supply can move prices sharply. Profitability then contracts, producers reduce investment and the cycle begins again.
HBM changes parts of this pattern. The product is more specialized, packaging capacity can be constrained and customer qualification creates barriers. Its growth also pulls wafer capacity away from conventional DRAM, potentially tightening the broader market. Yet HBM is still memory, and its economics remain connected to production yields, competitor investment, product transitions and customer bargaining power.
SK hynix’s 76% operating margin is evidence of unusually favorable conditions. It also gives competitors an enormous incentive to expand. If Samsung, Micron and emerging Chinese suppliers close technology gaps, customers will gain alternative sources. If accelerator architectures change, memory requirements may evolve. If model efficiency improves faster than workload growth, the number of expensive systems required for a given task could fall. None of these outcomes was established on July 29, but all belong in a long-term valuation.
Conventional memory still matters
One of the most important details in the company’s report was that both DRAM and NAND prices increased quarter over quarter. The profit surge was therefore broader than a single premium product. AI servers require conventional memory and storage alongside HBM. Data-center construction can support enterprise solid-state drives. Consumer-device recovery can improve demand for mobile and PC memory. At the same time, higher HBM production can absorb DRAM wafer capacity and support prices elsewhere.
This breadth strengthens the positive interpretation of the quarter. SK hynix was not relying exclusively on one narrow product. It was benefiting from a market in which high-performance AI memory and more conventional categories improved together.
It also broadens the downside if the cycle turns. When multiple memory categories reach high prices simultaneously, customers have strong incentives to optimize usage, delay purchases or seek alternative suppliers. Producers have strong incentives to add output. A synchronized upturn can therefore be followed by a synchronized correction.
China’s Reported DUV Breakthrough: What Is Confirmed
On July 27, The Information reported that China had begun manufacturing domestically developed immersion deep-ultraviolet lithography machines. Reuters summarized the original report and said the machines were expected to be delivered in 2026 to Semiconductor Manufacturing International Corporation, Hua Hong Semiconductor and ChangXin Memory Technologies.
The state-backed manufacturer was not identified in the report because of the sensitivity of the subject. Initial production was expected to be limited to about five machines in 2026 and roughly 20 in 2027. The tools reportedly remained behind ASML’s systems in performance and reliability and required more testing before true mass production. China was also said to be developing a domestic EUV system, but that project remained at the prototype stage.
These qualifiers are not minor. Manufacturing five machines is not equivalent to supplying a global semiconductor industry. Delivering a tool is not equivalent to qualifying it for high-volume production. Printing a test pattern is not equivalent to maintaining high throughput, overlay accuracy, uptime and yield across millions of wafers. A lithography system creates value only as part of an integrated production environment that includes masks, resists, metrology, process control, service, spare parts and trained operators.
The report nevertheless marked a strategic milestone. Immersion DUV is the most advanced lithography category available to Chinese chipmakers after export restrictions blocked access to EUV systems and limited access to some advanced DUV tools. A viable domestic alternative would reduce dependence on foreign servicing and equipment approvals. It could support mature-node production immediately and, through multiple patterning, contribute to more advanced manufacturing at higher cost and complexity.
Fact Box
China’s Reported Immersion-DUV Program
- Reported 2026 output: approximately five machines
- Reported 2027 output: approximately 20 machines
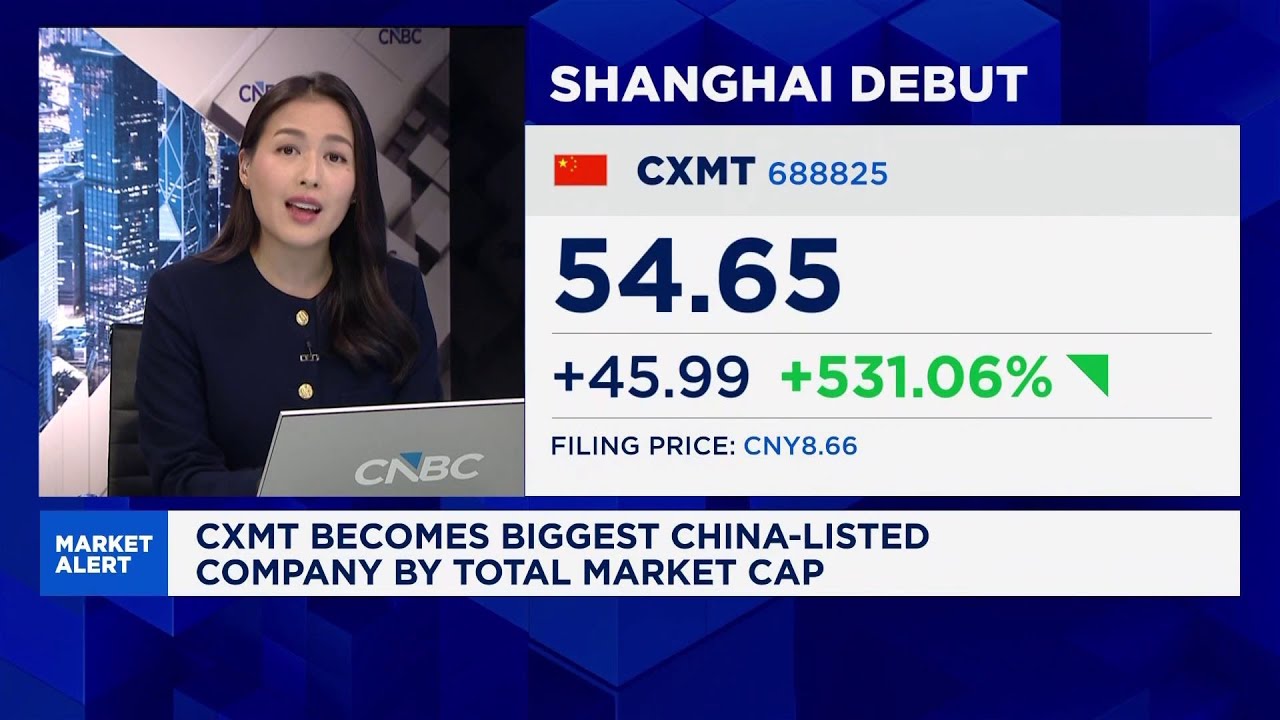
- Expected recipients: SMIC, Hua Hong Semiconductor and CXMT
- Current status: manufacturing and initial delivery plans reported; performance and reliability remain behind ASML
- Domestic EUV effort: reportedly at prototype stage
- What is not established: commercially competitive yield, uptime, throughput, service capability or large-scale production
Original reporting: The Information’s report on China’s domestic DUV tools; Reuters summary and market reaction
DUV, EUV and Why the Difference Matters
Lithography is the process of projecting patterns onto light-sensitive material placed on a silicon wafer. Those patterns define the tiny structures that become transistors and interconnections. The smaller and more accurately the system can reproduce a pattern, the more advanced the chipmaker’s process can become.
Deep-ultraviolet lithography uses ultraviolet light produced by excimer lasers. Modern immersion systems commonly use argon-fluoride light with a wavelength of 193 nanometers. A layer of water is placed between the final lens and the wafer, increasing the numerical aperture and improving resolution. ASML explains the underlying method in its overview of immersion lithography, lenses and mirrors.
Extreme-ultraviolet lithography uses 13.5-nanometer light and a reflective optical system rather than conventional lenses. EUV can print finer features with fewer patterning steps at leading-edge nodes. The technology is exceptionally difficult because EUV light is absorbed by air and by most materials. The system requires a vacuum, highly specialized mirrors, an intense light source, precision motion and enormous computational control.
ASML is the only commercial supplier of EUV lithography systems. That position is stronger than its position in DUV because there is no direct high-volume EUV alternative. A domestic Chinese immersion-DUV machine therefore does not eliminate ASML’s EUV monopoly. It targets a different, though still important, part of the market.
The word “older” can be misleading when applied to DUV. The technology predates EUV and cannot match its single-exposure resolution, but DUV remains essential across the semiconductor industry. Mature-node chips for automobiles, industrial equipment, power management, communications and consumer electronics rely on DUV. Even advanced chips use DUV for many layers that do not require EUV. A credible Chinese immersion tool could therefore be commercially useful long before China develops EUV.
Multiple patterning can extend DUV, at a cost
Chipmakers can use multiple DUV exposures and processing steps to create smaller effective features than one exposure would allow. This technique helped the industry continue scaling before EUV entered high-volume manufacturing and remains relevant where EUV access is restricted.
The tradeoff is complexity. Every additional exposure introduces alignment requirements, process steps, cycle time and opportunities for defects. The fab may need more deposition, etch and metrology equipment. Throughput falls and cost rises. A producer can sometimes manufacture an advanced design with DUV multiple patterning, but doing so does not mean the economics match an EUV-based process.
That is why a Chinese DUV tool can be strategically meaningful without creating immediate parity. It may allow domestic fabs to replace unavailable imports for selected layers and processes. It may support experimentation and learning. It may reduce the risk that service restrictions idle existing production. Yet the system’s real value will depend on how reliably it works inside a production line.
Yield is the hidden test
Yield is the proportion of manufactured chips or dies that meet specifications and can be sold. A lithography machine can print patterns and still be economically inferior if small errors cause too many defects. High yield requires accurate imaging, precise overlay between layers, stable focus, clean operation, consistent light output, reliable software and rapid detection of process drift.
Throughput and uptime matter alongside yield. A machine that produces acceptable wafers only at low speed may be useful for research but unattractive for a commercial fab. A tool that performs well until a component fails may become costly if spare parts and technicians are unavailable. ASML’s competitive advantage includes decades of installed-base knowledge, service infrastructure and improvements developed from customer data. China’s challenge is therefore industrial as much as scientific.
Investors reacted to the possibility that the learning process had advanced further than expected. They did not have evidence that the process was complete.
Why ASML’s Moat Remains Strong
ASML entered the selloff from a position of financial and technological strength. On July 15, the company reported second-quarter net sales of €9.326 billion, gross profit of €5.035 billion and net income of €2.918 billion. Gross margin reached 54%. ASML sold 86 new lithography systems and five used systems during the quarter. The company raised its 2026 sales outlook to €43 billion to €45 billion and expected a full-year gross margin of 54% to 56%, according to ASML’s official Q2 2026 results.
Chief Executive Christophe Fouquet said customer commitments across the portfolio had improved longer-term visibility. ASML planned to add 30% to its 2026 low-numerical-aperture EUV capacity of around 65 systems for 2027 and was studying another 30% increase for 2028. It planned a similar 30% increase to 2026 immersion-DUV capacity of around 130 systems for 2027, followed by a possible further increase in 2028.
Those figures provide scale for the Chinese report. Five domestic Chinese immersion machines in 2026 would be strategically notable but small beside ASML’s planned output of about 130 immersion systems. Scale is only one advantage. ASML also has relationships with leading foundries and memory manufacturers, a global service network, established suppliers and a vast body of process knowledge.
Its EUV position is stronger still. EUV systems depend on specialized optics from Carl Zeiss SMT, high-power laser technology, precision mechatronics, contamination control and software. Reproducing one subsystem does not reproduce the full machine. Integrating all of them at commercial reliability is a long-duration engineering challenge.
The moat is not the same as immunity
A strong moat can narrow without disappearing. China does not need to beat ASML globally to affect ASML’s China business. A domestic supplier that meets the needs of Chinese fabs at acceptable cost could take local orders, reduce demand for imported DUV tools and weaken the strategic power of export controls. Government support can sustain development through years of low profitability. Domestic customers may accept lower initial efficiency in exchange for supply security.
Export restrictions can also accelerate substitution. When a buyer cannot rely on access to foreign equipment, the economic value of an imperfect domestic alternative rises. Capital, talent and procurement can be directed toward local suppliers. The same restrictions that preserve a near-term technology gap can increase the long-term incentive to close it.
ASML’s exposure therefore has two layers. The first is direct: potential loss of Chinese DUV demand. The second is geopolitical: broader restrictions on sales, parts or service can change the value of its installed base. In 2026, China remained an important legal market for less-advanced equipment even though EUV sales were prohibited and certain immersion-DUV exports were restricted.
The U.S. Department of Commerce’s Bureau of Industry and Security has expanded controls covering semiconductor manufacturing equipment, advanced computing chips and high-bandwidth memory. Its official description of strengthened semiconductor export controls includes controls on specified lithography, deposition, etch, metrology and other equipment. The stated objective is to restrict China’s ability to produce advanced semiconductors for military applications. The commercial consequence is that equipment suppliers must operate inside a changing licensing environment.
What the market may have overestimated
The immediate selloff appeared to treat China’s reported progress as a broad threat to semiconductor incumbents. That interpretation can become too sweeping. A new domestic DUV supplier could compete with ASML in China while increasing equipment demand elsewhere if global fabs accelerate investment. It could pressure mature-node economics without changing the near-term supply of leading AI accelerators. It could weaken an export-control bottleneck while leaving advanced packaging, EDA software, precision components and EUV unresolved.
The report also came through unnamed sources, and ASML declined to comment to Reuters. The manufacturer’s identity was not disclosed. Investors therefore lacked direct data on machine specifications, customer acceptance, wafer throughput or production yield. The responsible conclusion was not that the report was false, but that its commercial implications remained substantially uncertain.
Leverage Turned a Semiconductor Correction Into a Market Event
The speed of the KOSPI decline cannot be explained by earnings forecasts alone. Forecasts usually change in increments. A 12.6% intraday move in a broad benchmark requires a mechanism that transforms changing opinions into urgent trades. In South Korea, that mechanism included concentrated index weights, margin borrowing, leveraged exchange-traded products and forced risk reduction.
Leverage increases exposure using borrowed money or derivatives. A trader who invests 100 units of personal capital and borrows another 100 has twice the market exposure. A 10% increase in the asset produces a gain of roughly 20% on the trader’s original capital before financing costs. A 10% decline produces a loss of roughly 20%. If the asset falls far enough, the lender or broker may require more collateral or close the position.
This asymmetry is especially dangerous after a rapid rally. Rising prices increase account equity, encourage additional borrowing and make the strategy appear safer. Volatility may remain low because buyers repeatedly step in. When the trend reverses, the same structure works in the opposite direction. Falling prices reduce collateral, forced sales push prices lower and lower prices trigger additional forced sales.
How single-stock leveraged ETFs intensify daily moves
A single-stock leveraged ETF uses swaps, futures or other derivatives to target a multiple of one stock’s daily return. A fund offering two times the daily return of SK hynix seeks approximately 2% on a day when the shares rise 1%, before fees and tracking differences. It also seeks approximately minus 2% when the stock falls 1%.
To maintain its target, the fund must rebalance exposure. After the underlying stock rises, the fund may need to add exposure to restore the desired leverage relative to its larger asset base. After the stock falls, it may need to reduce exposure. Across a large group of products, those adjustments can create buying into strength and selling into weakness, particularly near the end of a trading session.
The products are not automatically responsible for every market move. Their flows depend on fund size, hedging arrangements, dealer positioning and investor transactions. Yet they can become an amplifier when they are concentrated in a few securities and the underlying market is already under stress.
South Korea introduced leveraged ETFs linked to Samsung Electronics and SK hynix in late May 2026, during the chip-driven rally. On July 16, the Financial Services Commission announced measures intended to reduce risk. The required retail deposit was raised from 10 million won to 30 million won, the minimum trading unit was increased from one share to 20, additional risk education was required and brokerages were discouraged from launching or promoting new products. Those measures were described in Reuters’ report on the new ETF restrictions.
By July 29, Finance Minister Koo Yun-cheol and Financial Services Commission Chairman Lee Eog-weon had publicly apologized for the way the products were introduced and regulated. Lawmakers argued that the funds had intensified the selloff and exposed retail investors to risks that were not adequately considered. The apology did not establish that leveraged ETFs were the sole cause of the rout. It did confirm that the government regarded their role as serious enough to warrant a rare public acknowledgment of regulatory failure.
Daily leverage is not long-term leverage
Many losses in leveraged ETFs arise from a misunderstanding of the word “two times.” The target normally applies to one trading day. Over longer periods, returns compound.
Consider an underlying stock that falls 20% one day and rises 25% the next. It returns to its starting value because a 25% gain on 80 restores 100. A fund delivering twice the daily return would fall 40%, from 100 to 60, and then rise 50%, from 60 to 90. The underlying stock is unchanged over the two days, while the leveraged fund is down 10%, before fees and tracking effects.
Large alternating moves create this volatility drag. During a smooth trend, daily leverage can outperform a simple multiple of the cumulative return. During unstable trading, it can underperform severely. The July rout combined steep declines with sharp intraday recoveries, exactly the environment in which investors should not assume a leveraged product will behave like a long-term doubled position.
Margin accounts and forced liquidation
Margin borrowing creates a more direct feedback loop. Brokers lend against a portfolio but require the account to maintain minimum equity. When the value falls below the requirement, the customer must add cash or securities. If the customer cannot do so, the broker sells assets.
Forced liquidation is price-insensitive. The objective is to reduce risk, not to obtain a favorable valuation. A broker may sell the most liquid stock because it can be sold quickly, even if the original loss occurred elsewhere. This is one reason a concentrated index can fall broadly during a stress event. The largest, most liquid semiconductor shares become sources of cash.
Reuters reported that much of the KOSPI rally had been supported by small investors using borrowed money and that brokers were forcibly closing losing positions. Market volume was described as light, suggesting that natural buyers had stepped away. A small quantity of forced selling can move prices dramatically when the opposite side of the order book is thin.
Why the KOSPI Was Especially Vulnerable
South Korea is one of the world’s most important industrial economies, with major businesses in automobiles, batteries, shipbuilding, biotechnology, internet services and consumer products. Its stock benchmark, however, had become dominated by two memory-chip companies during the 2026 rally.
SK hynix and Samsung Electronics together accounted for more than half of the KOSPI’s market capitalization, according to Reuters. That concentration created a simple mathematical problem. If the two largest companies fall sharply, other sectors can rise and the index can still decline. Passive funds tracking the benchmark must hold the same concentrated exposure. Active managers measured against the index may also feel pressure to own the leading stocks because avoiding them during a rally creates large relative underperformance.
Concentration can become self-reinforcing. Rising share prices increase index weights. Larger weights attract more passive flows. Strong performance attracts global investors and domestic retail traders. Analysts raise targets as earnings expand. The companies then represent a greater share of market wealth, collateral and sentiment.
The process reverses during a decline. Index funds receive redemptions and sell the largest holdings. Active managers cut risk. Leveraged products rebalance. Falling market capitalization reduces the apparent diversification of the entire national market.
The benchmark was measuring an AI-memory bet
By mid-2026, buying the KOSPI was no longer a neutral decision about the Korean economy. It was, to a considerable degree, a decision about the global AI-memory cycle. A foreign investor could believe that Korean banks, automakers or industrial companies were reasonably valued and still experience a loss driven by semiconductor shares.
This distinction matters for portfolio construction. Country funds are often treated as diversified geographic exposures. In practice, a country index can contain a dominant sector, company or commodity factor. Taiwan is heavily influenced by semiconductor manufacturing. Some Gulf markets are influenced by energy and banks. South Korea in 2026 had become heavily influenced by memory and AI infrastructure.
The July rout did not prove that concentrated benchmarks are inherently defective. Concentration can reflect genuine economic leadership. It did show that investors should understand the factor exposure hidden inside a country label.
Foreign flows and the won
Foreign profit-taking had added pressure before the earnings report. When overseas investors sell Korean equities, they may also sell won to convert proceeds into dollars or other currencies. Currency weakness can increase the U.S.-dollar loss on Korean assets and encourage further risk reduction.
The relationship is not mechanical. Exporters can benefit from a weaker won, and currency hedges can separate equity exposure from exchange-rate exposure. Yet during market stress, equity and currency moves often reinforce each other. A global fund facing losses in Korean shares and a weakening won may reduce the position faster than a domestic investor who measures returns only in local currency.
Reuters’ year-to-date comparison used U.S.-dollar returns, which is useful for international investors. Even after the selloff, the KOSPI remained up 41.5% in dollars. That gain explains why foreign investors had substantial profits available to realize.
Trading Halts, Sidecars and What Market Safeguards Can Do
The Korea Exchange uses several mechanisms to manage extreme volatility. A “sidecar” suspends certain program-trading orders for five minutes after specified moves in futures and the spot market. A marketwide circuit breaker stops trading more broadly when the index falls through defined thresholds.
On July 29, the KOSPI’s decline triggered a 20-minute marketwide halt. The pause gave market participants time to process information, review collateral and enter orders. It did not establish a floor for prices or guarantee that selling would end.
South Korea’s sidecar mechanism had already been activated repeatedly in 2026. Korea JoongAng Daily reported that 42 sidecars had been triggered on the KOSPI during the year by July 28, exceeding the previous annual record of 26 during the 2008 financial crisis. Its examination of Korea’s trading-curb system explained that a KOSPI sidecar suspends program orders in the relevant direction when futures move at least 5% for one minute.
A pause can reduce immediate disorder, but it can also concentrate orders when trading resumes. Investors who decide to sell during the halt may submit orders simultaneously. If buyers remain absent, the reopened market can move sharply. A mechanism that delays execution does not remove leverage or improve a company’s earnings outlook.
Price discovery versus market stability
Every trading halt involves a tradeoff. Continuous trading allows prices to adjust and gives investors the ability to transact. A pause can prevent feedback loops and operational errors from escalating, but it temporarily removes liquidity.
The appropriate design depends on the source of volatility. If a technical failure or erroneous order causes the move, a pause can allow correction. If investors are rationally reducing risk after new information, a halt postpones rather than eliminates selling. If leveraged products must rebalance, the demand to trade remains after the market reopens.
The KOSPI’s recovery from a 12.6% intraday fall to a 6% closing loss shows that the session did eventually find buyers. It does not show that the trading halt caused the recovery. Government comments, valuation changes, short covering and the completion of some forced sales may also have contributed.
South Korea’s Regulatory Reckoning
The July 29 apologies by Finance Minister Koo Yun-cheol and FSC Chairman Lee Eog-weon were important because they shifted the story from market volatility to policy accountability. The government had supported the development of new investment products during a period of public enthusiasm for technology shares. When losses arrived, lawmakers asked whether authorities had underestimated the products’ ability to amplify volatility and harm inexperienced investors.
The earlier rules had already raised deposit requirements and restricted product promotion. On July 28, Lee said authorities could consider a cap on each retail investor’s total holdings of single-stock leveraged ETFs. After the second day of market disruption, the political pressure for stronger action increased.
Possible responses include tighter eligibility requirements, lower leverage, position limits, restrictions on new listings, stronger suitability tests, clearer warnings, enhanced disclosure of daily-reset mechanics and closer supervision of hedging flows. Each option carries costs. High barriers can protect some investors while pushing speculation into less transparent products. Position caps can reduce risk concentration but limit market access. Bans can move activity offshore.
The central policy question is not whether investors should be protected from all losses. Loss is part of market participation. The question is whether a complex product was distributed and promoted in a way that allowed buyers to understand its time horizon, compounding behavior, path dependence and liquidation risk.
Investor education is necessary but not sufficient
Risk courses and disclosure documents can help, but they do not solve every structural problem. An investor may understand that a product targets twice the daily return and still underestimate how quickly volatility can destroy capital. Marketing during a sustained rally can overpower formal warnings. Social proof can make a risky trade appear ordinary when friends, colleagues and online communities report gains.
Product design also affects the market beyond the buyer. A leveraged ETF can create hedging flows in the underlying stock. Regulators therefore need to consider systemic effects, not only whether an individual signed an acknowledgment.
The concentration of the products in Samsung Electronics and SK hynix made the issue more serious. These were not small speculative shares. They were the core of the national benchmark, widely held by households, pensions and global funds. Amplified volatility in them affected the broader financial system.
Global Spillovers From the Korean Semiconductor Selloff
The rout spread beyond Seoul because the semiconductor supply chain is global and the AI investment thesis links companies across regions. TSMC shares fell 3.5% in Taipei on July 29. European equipment suppliers had already weakened after the China DUV report. U.S. memory and processor shares traded under pressure as investors examined whether Korean results contained information about global demand.
Not every semiconductor company has the same exposure. SK hynix sells memory. TSMC manufactures chips designed by customers. Nvidia and AMD design accelerators and processors. ASML supplies lithography systems. Tokyo Electron, Applied Materials and Lam Research supply different categories of fabrication equipment. Broadcom participates in networking and custom silicon. A single development can affect them differently.
For example, stronger Chinese DUV capabilities may be negative for foreign equipment sales in China but positive for Chinese foundry capacity. Slower hyperscaler spending may reduce demand for accelerators and HBM, but a shift toward more efficient inference could support different chips or networking equipment. Lower memory prices could hurt producers while reducing costs for server manufacturers.
The market’s first response often sells the entire theme. The second stage separates business models.
Why U.S. investors should care
U.S. portfolios are exposed through semiconductor holdings, technology indexes, country ETFs, depositary receipts and companies that depend on Korean memory supply. The episode also matters as a test of the AI capital-spending cycle. If record profit at a critical supplier is insufficient to support its valuation, investors may demand more evidence of returns from every company connected to AI infrastructure.
Large U.S. technology companies had become central to the demand outlook cited by SK hynix. Microsoft, Alphabet, Amazon, Meta Platforms and Oracle were among the hyperscalers whose spending plans influenced memory assumptions. A reduction in their capital expenditure would affect equipment orders and component demand with different lags.
At the same time, scarcity can protect suppliers. If HBM remains constrained and customer contracts remain firm, a decline in equity prices may reflect positioning rather than a collapse in end demand. The Korean selloff was therefore a signal to investigate, not a complete forecast for U.S. technology earnings.
Why Europe should care
ASML’s reaction showed that China’s industrial policy can affect European valuations even when the immediate product is less advanced than the European leader’s flagship technology. The Dutch company is strategically important to both Western export controls and the global semiconductor expansion. Its customers need greater capacity, while governments restrict part of its addressable market.
European suppliers also occupy specialized positions in optics, lasers, materials, power semiconductors and assembly equipment. A domestic Chinese lithography program could create opportunities for some component suppliers and restrictions for others. Governments may tighten controls if they believe foreign parts are enabling Chinese advances. China may increase domestic-content requirements in response.
The Strongest Case That the Selloff Went Too Far
The positive interpretation begins with operating evidence. SK hynix did not report weakening demand. It reported record revenue, record operating profit, a 76% operating margin, rising DRAM and NAND prices, stronger cash and lower debt. Major customers continued to request supply. The company had reached long-term agreements with around 10 customers and was negotiating more.
HBM remains difficult to produce at high yield and is essential to leading AI systems. Product qualification and customer integration create barriers that cannot be removed by announcing new capacity. SK hynix’s early lead, manufacturing experience and customer relationships have economic value.
The company’s balance sheet provides resilience. A 69.4 trillion won net cash position gives it room to invest through volatility, support research and absorb a future downturn. Large nonrecurring investment gains should not be treated as operating earnings, but the resulting financial resources are still available.
The KOSPI’s intraday decline also contained obvious technical elements. Leverage was being unwound, buyers had withdrawn and forced liquidations were occurring. The index recovered substantially before the close. Such price action can overshoot changes in fundamental value.
China’s reported DUV production was modest. Five machines in 2026 and 20 in 2027 would not match ASML’s scale. The tools reportedly lagged on performance and reliability. China’s EUV program remained at the prototype stage. Treating the report as proof of immediate parity was not supported by the available evidence.
ASML itself had just raised its annual outlook and planned significant capacity increases. Strong order intake and supply constraints indicated that customers still needed more advanced equipment than the industry could readily deliver.
The Strongest Skeptical Case
The skeptical interpretation begins with expectations and durability. A 76% operating margin in memory may represent exceptional scarcity rather than a normal long-term earning level. Competitors and customers will respond. Capacity additions can weaken pricing. Long-term agreements can limit upside. Product delays can give competitors openings.
SK hynix planned capital expenditure in the high-40-trillion-won range, a large increase from 2025. That investment may be necessary, but it raises the amount of future supply and the cash required to maintain leadership. If AI infrastructure growth slows before the capacity earns an acceptable return, the company could experience falling prices and high depreciation simultaneously.
The earnings miss also contained more than market psychology. Revenue and operating profit were below consensus. HBM4 shipment timing affected recognition. Management did not provide the shareholder-return detail investors expected. Strong demand did not prevent a shortfall relative to the assumptions embedded in the stock.
The concentration and leverage that accelerated the rally had not necessarily been fully removed by one or two days of selling. Analysts cited by Reuters said further deleveraging could occur. A market can remain fundamentally attractive and continue falling while collateral is being repaired.
China’s program may be small today but strategically important over a decade. Government-supported development does not need to meet a public company’s short-term return threshold. Domestic fabs can provide a protected customer base. Engineers can improve machines through use. Export controls increase the incentive to tolerate early inefficiency. ASML can retain global leadership while losing part of the Chinese market.
Finally, the AI investment chain depends on returns at the end-user level. If hyperscalers conclude that some projects cannot generate adequate revenue, orders can slow rapidly. Supplier contracts provide protection, but they do not eliminate renegotiation, delays or the economic consequences of weaker end demand.
Timeline of the AI-Chip Rally and Reversal
- January 2026: Korean semiconductor shares begin the year with strong momentum as investors anticipate expanding AI infrastructure demand and continued HBM scarcity.
- April 22, 2026: SK hynix reports first-quarter revenue of 52.5763 trillion won and operating profit of 37.6103 trillion won, setting a high base for second-quarter expectations.
- Late May 2026: Single-stock leveraged ETFs linked to Samsung Electronics and SK hynix are introduced in South Korea during the chip-led market rally.
- June 2026: Korean semiconductor shares and the KOSPI reach extraordinary highs. SK hynix later loses more than half of its value from its record level, even though it remains sharply higher for the year.
- July 15, 2026: ASML reports €9.3 billion in quarterly sales, raises its 2026 outlook and outlines plans to expand both EUV and immersion-DUV capacity.
- July 16, 2026: South Korea announces tighter rules for single-stock leveraged ETFs, including a higher minimum deposit and larger minimum trading unit.
- July 27, 2026: The Information reports that China has begun manufacturing domestically developed immersion-DUV lithography machines for delivery to leading Chinese chipmakers.
- July 28, 2026: The KOSPI falls nearly 11% as semiconductor shares weaken, financing concerns rise and regulators discuss further limits on leveraged products.
- July 29, 2026: SK hynix reports record results that miss elevated estimates. The KOSPI falls as much as 12.6%, trading is halted for 20 minutes, and the benchmark closes down 6%.
- July 29, 2026: Finance Minister Koo Yun-cheol and FSC Chairman Lee Eog-weon apologize over the handling of single-stock leveraged ETFs.
How to Think About Valuation After an Extreme Move
A sharp decline does not by itself make a stock inexpensive. Price is only one side of valuation. The other side is the earnings, cash flow and balance-sheet value expected over time. If the market reduces its estimate of sustainable profit, a lower price can represent the same or even a higher valuation.
SK hynix presents a particularly difficult case because current earnings are far above historical norms. A simple price-to-earnings ratio based on the latest quarter can make the stock appear cheap, but that calculation assumes the quarter represents a durable run rate. If memory prices normalize, capital expenditure increases depreciation and HBM competition grows, future earnings could be lower. If AI demand remains structurally strong and long-term contracts preserve pricing, current earnings could be more durable than previous memory peaks.
Investors therefore need a normalized framework rather than a single multiple. One approach is to model several states of the memory cycle: sustained scarcity, gradual normalization and a traditional downturn. Each state should include assumptions for HBM volumes, conventional DRAM pricing, NAND pricing, operating margin, capital expenditure and cash returns. The probability-weighted result is more informative than annualizing one record quarter.
Revenue quality
Revenue quality depends on the source and durability of growth. HBM revenue tied to multi-year customer programs may be more visible than spot-market commodity memory. Conventional DRAM price increases can generate large profit but reverse when supply expands. Enterprise SSD demand linked to data centers may be stronger than consumer storage demand, yet it remains exposed to customer inventory decisions.
The mix also affects margins. A shift toward premium products can raise average selling prices and profitability even without equal unit growth. If competitors gain share, the mix benefit can weaken before total market demand declines.
Earnings quality
Operating profit of 60.5426 trillion won is the key measure of the core quarter. Net profit of 93.9226 trillion won should not be annualized because it included a 63.3 trillion won investment-asset gain. A valuation based on reported net income without adjusting for that gain would overstate recurring earning power.
High operating margins also require scrutiny. They can reflect technological leadership and product scarcity, but they may include prices that attract future competition. The more exceptional the margin, the more important it becomes to examine capacity plans across the industry.
Cash flow and capital intensity
Profit is not the same as free cash flow. Semiconductor manufacturers must spend heavily on fabrication facilities, clean rooms, equipment and packaging. Capital expenditure in the high-40-trillion-won range will consume a meaningful portion of operating cash. Some of that spending supports growth; some replaces equipment or maintains process competitiveness.
Net cash gives SK hynix flexibility, but investors need to judge how much is truly excess after planned investments, working-capital needs and cycle protection. A future shareholder-return policy will reveal management’s view of the appropriate cash buffer.
Balance-sheet value
A 69.4 trillion won net cash position is a genuine asset. It lowers financial risk and reduces the probability that the company must issue equity or borrow on unfavorable terms during a downturn. In valuation, however, cash should not be counted twice. Analysts who subtract net cash from enterprise value must also ensure that earnings and cash-flow forecasts include the investments needed to sustain the business.
Five Variables That Will Decide Whether the AI Memory Boom Lasts
1. Hyperscaler capital expenditure
The largest cloud and internet companies are funding the demand chain. Their budgets determine how many accelerators, servers, networking systems and memory products are purchased. Headline capital expenditure is not enough; investors must examine how much is directed to AI computing, how quickly assets enter service and whether revenue grows with the installed base.
A continued increase would support SK hynix’s demand argument. A slower growth rate would not necessarily cause a downturn if supply remains constrained. An outright reduction or project cancellation would challenge the assumption that every planned capacity expansion is needed.
2. HBM4 qualification and shipment timing
The transition to HBM4 is both a revenue opportunity and an execution test. Customer qualification, yields, packaging integration and shipment schedules determine when sales are recognized. Delays can shift profit between quarters and create openings for competitors. Successful ramping can reinforce long-term agreements and justify capital spending.
The distinction between “mass production has begun” and “the expected revenue has been recognized” is important. A company can start shipments while the volume and mix remain below market assumptions.
3. Conventional DRAM and NAND pricing
SK hynix benefited from quarter-over-quarter price increases across both categories. If those increases continue, the company can offset some HBM pricing constraints. If customers resist prices or inventories rise, profit can normalize quickly. Contract-price data, customer inventory commentary and competitor utilization rates will provide early signals.
4. Industry capital expenditure
SK hynix’s own spending is only part of the supply response. Samsung, Micron, Chinese memory producers, foundries and packaging companies are expanding. The timing matters because capacity announced today may not affect output for several quarters or years. Investors should distinguish clean-room construction from installed, qualified and productive capacity.
5. Chinese technology progress
The commercial test of domestic DUV machines will be measured in wafers, not announcements. Important evidence would include verified throughput, overlay, defect rates, uptime, customer acceptance and repeat orders. Progress in light sources, optics, stages, software and service would indicate that China is building a sustainable platform rather than a limited demonstration.
The same discipline applies to EUV claims. A prototype is not a production system. Evidence of a light source or optical component is not evidence that the complete machine can manufacture advanced chips economically.
Three Plausible Scenarios for the Next Phase
Scenario One: Technical reset, strong fundamentals
In the first scenario, the July rout primarily clears leverage from a fundamentally strong market. Hyperscalers maintain spending, HBM4 shipments accelerate, memory prices remain firm and long-term agreements support capacity investment. SK hynix’s earnings continue to exceed historical norms, though quarter-to-quarter growth becomes less spectacular. The KOSPI stabilizes after leveraged positions are reduced, and semiconductor valuations rebuild on a less speculative base.
China’s DUV program advances slowly and serves selected domestic needs without matching ASML’s reliability or scale. ASML’s global demand remains supply constrained, and lost Chinese orders are partly offset by expansion in Taiwan, South Korea, the United States, Europe and other markets.
Evidence supporting this scenario would include sustained customer commitments, improving HBM4 revenue recognition, stable memory contract prices and reduced volatility after ETF and margin exposure falls.
Scenario Two: Earnings normalize without an AI collapse
In the middle scenario, AI demand keeps growing but at a rate below the market’s peak assumptions. New memory capacity arrives, conventional prices stop rising and HBM competition increases. SK hynix remains highly profitable, but operating margins move down from 76%. The company uses long-term contracts to protect volumes, while those same contracts limit pricing upside.
The KOSPI remains volatile because semiconductor earnings are still important, but the market broadens toward banks, industrials, consumer companies and other sectors. ASML retains EUV leadership while facing gradual DUV substitution in China.
This scenario would validate neither the most bullish nor the most bearish interpretation. The AI infrastructure buildout would continue, but equity returns would depend more on valuation, capital discipline and market share than on expanding multiples.
Scenario Three: Capacity and financing collide
In the bearish scenario, hyperscalers delay projects because power, financing or revenue constraints reduce expected returns. HBM orders slow as new capacity reaches the market. Conventional memory prices fall. Long-term agreements are renegotiated, delayed or provide less protection than investors assumed. SK hynix faces lower margins while depreciation and capital spending remain high.
Leverage continues to unwind across Korean equities. Retail losses weaken domestic risk appetite, and regulatory restrictions reduce marginal demand for chip shares. China improves domestic equipment faster than expected, taking local DUV orders and supporting additional memory capacity.
This outcome would not require AI to fail as a technology. It would require the financial returns on infrastructure to fall below the assumptions used to justify the most aggressive investment plans.
What the Selloff Does and Does Not Say About AI
The Korean market decline does not prove that artificial intelligence is a bubble, and record SK hynix earnings do not prove that every AI-related valuation is justified. Both conclusions are too broad.
AI can be commercially transformative while some investments produce poor returns. Railroads, telecommunications networks and the internet created enormous economic value, yet investors in particular companies or projects sometimes lost money because capacity was overbuilt, financing was excessive or entry prices were too high. Technology adoption and investment return are related but separate questions.
The July episode suggests that investors had compressed those questions into one trade. Strong AI adoption was assumed to produce sustained hyperscaler spending. Sustained spending was assumed to produce lasting HBM scarcity. Scarcity was assumed to preserve exceptional margins. Exceptional margins were assumed to justify rising semiconductor valuations. Leverage was then added to the chain.
Each link can remain positive while becoming less positive. Spending can grow more slowly. Supply can catch part of demand. Margins can remain strong but fall from records. A stock can decline even while the underlying company continues to grow.
Productivity gains can increase or reduce infrastructure demand
More efficient AI models create an ambiguous effect. If efficiency lowers the cost of using AI, demand may expand enough to increase total computing needs, a pattern sometimes associated with the Jevons paradox. More users, applications and automated tasks can consume the savings.
Efficiency can also reduce the hardware required for a fixed workload. Companies may achieve the same output with fewer accelerators or delay upgrades. The net result depends on how rapidly new use cases expand relative to efficiency gains.
Memory suppliers benefit if total data movement and model usage continue to grow. They are vulnerable if efficiency improvements outpace the creation of new workloads.
Lessons for Investors Using Country ETFs and Leveraged Products
The first lesson is to inspect index concentration. A fund labeled “South Korea” may behave like a leveraged semiconductor exposure if its largest holdings dominate performance. Country diversification does not guarantee sector diversification.
The second lesson is to separate company quality from position risk. SK hynix can be a technologically strong, profitable company while an oversized leveraged position in its shares remains dangerous. Risk depends on entry price, position size, borrowing, liquidity and time horizon.
The third lesson is to understand daily-reset products. Leveraged ETFs are trading instruments, not simple long-term multiples. Their returns depend on the path of daily prices. A volatile sequence can create losses even when the underlying asset ends near its starting point.
The fourth lesson is that market halts do not provide an exit price. Trading can resume lower. Orders can accumulate. A circuit breaker offers time, not protection from economic loss.
The fifth lesson is that record earnings can coincide with a falling stock. Markets discount the future and compare results with expectations. A positive press release is not the same as a positive surprise.
What SK hynix Management Must Establish
Management’s immediate task is not to control the stock price. It is to reduce uncertainty around the assumptions that matter most.
Investors will want clearer information about HBM4 shipments and the portion of delayed revenue expected to move into later periods. They will want evidence that long-term agreements contain meaningful protections while preserving acceptable economics. They will want a capital-expenditure framework that links spending to committed demand and avoids uncontrolled supply growth.
The shareholder-return policy will also matter. A credible framework could define a minimum cash buffer, base dividend, variable distributions or buyback criteria. The company must balance returns with the strategic value of maintaining financial strength in a cyclical industry.
Management should also distinguish recurring operating performance from investment gains. The record net profit attracted attention, but the underlying memory business is best assessed through operating profit, cash generation and capital needs.
What ASML and the Semiconductor-Equipment Industry Must Establish
ASML does not need to prove that China can never build a competitive tool. It needs to show that its systems continue to create enough economic value to justify their price and preserve customer loyalty. That means higher throughput, better overlay, improved uptime, faster installation, upgrades and service.
The company’s EUV position remains unique, but its DUV business faces a different competitive horizon. Investors will monitor legal China sales, service revenue, export licenses and any evidence that domestic Chinese systems are entering production.
Equipment suppliers also need to manage geopolitical concentration. Expanding capacity for global AI demand while governments restrict certain customers creates planning risk. A machine ordered today may face different export rules when it is ready to ship. Service arrangements can be affected after installation.
What Happens Next
The most immediate market question is whether forced selling has been exhausted. That cannot be determined from valuation alone. Margin balances, ETF flows, dealer hedges, foreign positioning and liquidity will influence the next sessions. A sharp rebound would not prove the fundamental concerns were resolved, just as another decline would not prove that AI demand had collapsed.
South Korean authorities are likely to face continued pressure to tighten leveraged-product rules. Measures under discussion included individual investment caps. Policymakers must decide whether the July actions are sufficient or whether product design, distribution and market-making require broader reform.
SK hynix said a more detailed shareholder-return plan would be disclosed later in 2026. Investors will also examine subsequent information on HBM4 shipments, long-term agreements and capital expenditure. Samsung Electronics was due to publish its full second-quarter results on July 30, after the research cutoff for this article, offering another test of memory pricing and competitive positioning.
For ASML, the next evidence will come from customer orders, legal China sales and verified performance data from domestic Chinese tools. The company’s planned 2027 capacity increases indicate confidence in global demand, but the distribution of that demand may shift.
For the broader AI trade, upcoming earnings from cloud companies and semiconductor designers will be more important than slogans about bubbles or supercycles. Investors need data on capital expenditure, utilization, AI-service revenue, power availability and expected returns.
Frequently Asked Questions
Why did the KOSPI fall so sharply on July 29, 2026?
The decline combined weaker-than-expected SK hynix earnings, concern about AI spending, reported Chinese progress in lithography, concentrated semiconductor index weights and the forced unwinding of leveraged positions. The KOSPI fell as much as 12.6% and closed 6% lower.
Did SK hynix report bad earnings?
No. The company reported record revenue, operating profit and net profit. The negative reaction occurred because revenue and operating profit were below very high analyst expectations, HBM4 revenue timing disappointed some investors and management did not provide a detailed shareholder-return plan.
How much operating profit did SK hynix report?
SK hynix reported second-quarter 2026 operating profit of 60.5426 trillion won, up 557% from the same quarter of 2025. Reuters cited a 64 trillion won LSEG SmartEstimate.
Why was net profit higher than revenue?
Net profit included a large investment-asset gain. Reuters reported 63.3 trillion won of such gains, which analysts associated with the completed sale of SK hynix’s Kioxia investment. The result should not be treated as recurring memory-business profit.
What is high-bandwidth memory?
HBM is vertically stacked DRAM designed to provide very high data bandwidth near processors and AI accelerators. It reduces the memory bottleneck that can limit computing performance and requires advanced manufacturing and packaging.
Has China matched ASML’s lithography technology?
No. China was reported to have begun manufacturing immersion-DUV systems, but initial output was small and the tools reportedly lagged ASML in performance and reliability. ASML remained the only commercial supplier of EUV systems, while China’s EUV effort was reported to be at the prototype stage.
Why is immersion DUV important if EUV is more advanced?
DUV is used widely for mature-node chips and for many layers of advanced chips. Immersion DUV can also be extended through multiple patterning. A domestic Chinese system could therefore reduce reliance on imported equipment even without matching EUV.
What is a single-stock leveraged ETF?
It is a fund designed to deliver a multiple of one stock’s daily return, usually through derivatives. The target resets daily, so long-term performance can differ substantially from a simple multiple of the stock’s cumulative return.
Why did South Korean officials apologize?
Finance Minister Koo Yun-cheol and FSC Chairman Lee Eog-weon said authorities had fallen short in the introduction and regulation of single-stock leveraged ETFs. Lawmakers blamed the products for intensifying volatility and retail losses.
Is the KOSPI still up in 2026?
Yes. Despite the two-day rout, Reuters reported that the KOSPI remained up 41.5% in U.S.-dollar terms year to date at the July 29 research cutoff.
Does the selloff mean the AI boom is over?
No. The selloff showed that valuations and leverage had become vulnerable. SK hynix still reported strong demand. The durability of the boom will depend on hyperscaler spending, AI-service revenue, HBM supply, product execution and the return on new infrastructure.
What should readers watch next?
Key indicators include HBM4 shipment timing, memory prices, industry capital expenditure, hyperscaler budgets, SK hynix’s shareholder-return policy, Korean ETF regulation and verified performance data from China’s domestic lithography tools.
Final Assessment
South Korea’s semiconductor rout was a collision between outstanding business results and an even more demanding market narrative. SK hynix demonstrated that AI demand had produced extraordinary revenue, profit, cash generation and pricing power. The company did not demonstrate that those conditions would exceed every expectation, remain immune to capacity growth or immediately translate into shareholder distributions.
The market’s fall was too large and too fast to interpret as a pure revision to long-term earnings. Concentration and leverage were decisive. Single-stock leveraged ETFs, margin accounts and forced liquidations converted disappointment into urgent selling. The recovery from a 12.6% intraday decline to a 6% closing loss further showed that liquidity and positioning, not only fundamentals, drove the session.
China’s reported DUV progress deserves attention without exaggeration. A handful of machines that still lag ASML do not erase the Dutch company’s scale, service network or EUV monopoly. They do show that China’s substitution effort is moving from aspiration toward hardware. The long-term threat is not immediate technological parity. It is steady domestic learning supported by customers who value supply security and a government willing to fund the process.
The strongest positive evidence is SK hynix’s operating performance and customer demand. The strongest concern is that today’s margin, valuation and capital spending all depend on a prolonged period of AI infrastructure growth. The July 29 selloff changed the burden of proof. Investors are likely to demand evidence of durable contracts, successful HBM4 execution, disciplined capacity and cash returns rather than rewarding exposure to the AI theme alone.
The next phase will not be decided by whether AI is described as a boom or a bubble. It will be decided by measurable economics: how much customers spend, what revenue their infrastructure produces, how quickly memory supply expands, what yields manufacturers achieve and whether the cash generated at the top of the cycle survives the investments required for the next one.
Why Record Earnings Can Be a Warning in a Cyclical Industry
Record profit is usually presented as evidence of strength, and in SK hynix’s case it unquestionably reflected strong demand, favorable pricing and technological leadership. In a cyclical industry, however, the same result can also identify the point at which risks begin to accumulate. High prices encourage customers to redesign products, negotiate harder and search for alternative suppliers. High margins attract capital. Competitors accelerate projects that previously looked uneconomic. Suppliers expand to capture demand before the opportunity closes.
The resulting capacity does not arrive immediately. That delay can make the boom look safer than it is. Orders remain strong while factories are under construction. Prices stay high while new equipment is being installed and qualified. Analysts extrapolate current margins because the supply response is not yet visible in reported output. When the additional capacity finally reaches the market, the adjustment can be abrupt.
This does not mean the second quarter marked the peak of SK hynix’s earnings. It means investors should treat the margin as a variable rather than a permanent characteristic. The durability of the result depends on how quickly competitors improve HBM yields, how much conventional memory capacity returns, whether customers honor long-term agreements at attractive prices and whether AI workloads expand faster than hardware efficiency.
The company’s balance sheet reduces financial danger but does not eliminate operating cyclicality. Net cash allows SK hynix to continue investing through a downturn and may help it gain share from weaker competitors. It cannot prevent market prices from falling if supply exceeds demand. Strong finances can make the company a relative winner while shareholders still experience lower earnings and valuation compression.
The same logic applies to ASML from a different direction. Its backlog, technological position and capacity constraints are strengths. They also encourage governments and customers to fund alternatives because dependence on one supplier is strategically uncomfortable. A monopoly can remain profitable for years while the probability of substitution rises at the margin.
The July selloff therefore contained a rational question beneath the forced selling: were investors valuing peak conditions as though they were ordinary? The answer will not come from one volatile session. It will come from the relationship between demand growth, capital spending, product execution and pricing over the next several reporting periods.
Sources
- Reuters: South Korea $2 trillion stock rout breaks records as SK Hynix results disappoint
- Reuters: SK Hynix record profit misses forecasts
- SK hynix: Q2 2026 financial results
- Reuters: China begins making homegrown DUV chipmaking tools
- The Information: China begins mass production of homegrown DUV chipmaking tools
- ASML: Q2 2026 financial results and outlook
- ASML: Lithography principles, lenses and mirrors
- Reuters: South Korea tightens regulation of single-stock leveraged ETFs
- Reuters: South Korean policymakers apologize over leveraged ETFs
- Reuters: Analyst reactions to the South Korean stock rout
- Korea JoongAng Daily: Review of KOSPI sidecars and trading curbs
- U.S. Bureau of Industry and Security: Semiconductor export-control measures
This article is provided for general informational purposes and does not constitute financial, investment, tax, or legal advice.
Affiliate disclosure: Businessfinance.news may earn compensation from qualifying actions completed through selected links on this website, at no additional cost to the reader. Affiliate relationships do not influence our editorial reporting, analysis, or conclusions.