Last updated: July 30, 2026, 10:41 a.m. CEST (4:41 a.m. EDT).
Microsoft ended its 2026 fiscal year with the clearest evidence yet that its enormous artificial-intelligence infrastructure program is producing commercial demand at scale. Azure and other cloud-services revenue grew 43% in the fiscal fourth quarter, the fastest reported pace in roughly four years. Microsoft 365 Copilot passed 30 million paid seats, up from 20 million three months earlier. Total Microsoft Cloud revenue reached $59.3 billion for the quarter, and Azure exceeded $100 billion in annual revenue for the first time.
Those figures help explain why Microsoft shares jumped more than 8% in extended trading after the results. The quarter answered the most immediate investor question: demand for Microsoft’s cloud capacity and enterprise AI products is not merely holding up while the company spends aggressively; it is accelerating. Revenue of $90.0 billion and diluted earnings per share of $4.81 both exceeded Wall Street expectations, while management projected approximately 45% constant-currency Azure growth for the September quarter.
The harder question remains open. Microsoft’s capital spending reached $41 billion in the June quarter, more than 70% above the comparable period a year earlier. Free cash flow fell 23% to $19.6 billion despite strong operating cash generation. Microsoft Cloud gross margin declined to 65%, and the company disclosed $329.1 billion of data-center leases that had been signed but had not yet commenced. A lower-looking calendar-2026 capital-expenditure forecast of about $175 billion did not represent a comparable reduction in the underlying buildout; it largely reflected an accounting change that will classify more future leases as operating leases rather than finance leases.
The result is a quarter that materially strengthens Microsoft’s AI investment case without closing it. Azure growth, Copilot adoption and a $678 billion commercial backlog show that customers are committing substantial money to Microsoft’s platform. Yet the economic test is no longer simply whether AI can generate revenue. It is whether revenue, margins and cash flow can eventually grow fast enough to produce attractive returns on an infrastructure base expanding at an extraordinary pace.
Key Takeaways
- Azure accelerated: Azure and other cloud-services revenue grew 43% in Microsoft’s fiscal fourth quarter ended June 30, 2026, above the roughly 40% consensus estimate and the fastest reported rate since early 2022.
- Copilot adoption improved sharply: Microsoft 365 Copilot exceeded 30 million paid seats, compared with 20 million at the end of the March quarter.
- The headline earnings beat was broad: Quarterly revenue rose 18% to $90.0 billion, operating income increased 18% to $40.6 billion and GAAP diluted EPS climbed 32% to $4.81.
- Capital intensity remains extreme: Quarterly capital expenditure reached $41 billion, while additions to property and equipment totaled $35.8 billion and free cash flow declined 23% to $19.6 billion.
- The lower CapEx forecast needs context: Microsoft said the underlying investment plan had not changed materially. A revised useful-life assumption for data centers and office buildings will shift more leases into operating-lease accounting, reducing reported CapEx without reducing all contractual spending.
- Demand still exceeds available capacity: Management said Azure demand remained above supply and guided to about 45% constant-currency Azure growth in the September quarter.
- The backlog is large but not equivalent to near-term revenue: Commercial remaining performance obligations reached $678 billion, with a weighted average duration of 2.3 years and approximately 30% expected to be recognized over the next 12 months.
- The decisive metric is shifting: Investors are moving from asking whether enterprise AI has demand to asking whether Microsoft can convert that demand into durable margins and free cash flow.
Microsoft’s Fiscal Fourth-Quarter Results at a Glance
Microsoft’s fiscal 2026 fourth-quarter earnings release showed strength across its cloud and productivity franchises, offset by weakness in consumer-oriented computing and gaming. The period covered the three months ended June 30, 2026.
| Metric | Fiscal Q4 2026 | Year-over-year change | Why it matters |
|---|---|---|---|
| Revenue | $90.0 billion | Up 18% | Exceeded the consensus expectation reported by the Associated Press of $87.62 billion. |
| Operating income | $40.6 billion | Up 18% | Shows that operating profit kept pace with revenue even as infrastructure and AI costs rose. |
| GAAP net income | $35.8 billion | Up 31% | Included a $3.2 billion gain related to Microsoft’s Anthropic investment and other discrete items. |
| GAAP diluted EPS | $4.81 | Up 32% | Above the $4.24 analyst expectation cited by the Associated Press, though investment gains improved the statutory result. |
| Microsoft Cloud revenue | $59.3 billion | Up 27% | Cloud now represents almost two-thirds of quarterly revenue. |
| Azure and other cloud services | Revenue growth of 43% | Accelerated from 40% in Q3 | The central evidence that cloud and AI capacity is being absorbed rapidly. |
| Capital expenditure | $41.0 billion | Up more than 70% | Demonstrates the scale of Microsoft’s AI and cloud buildout. |
| Free cash flow | $19.6 billion | Down 23% | The clearest near-term cost of the infrastructure program despite strong operating cash flow. |
The quarter was not simply an earnings-per-share story. Microsoft’s results mattered because they addressed three interconnected concerns that had weighed on the stock during fiscal 2026: whether Azure could reaccelerate, whether Copilot could become a paid enterprise product rather than a lightly used add-on, and whether capital spending was moving too far ahead of revenue.
Azure answered the first concern convincingly for this quarter. Copilot’s seat count provided a stronger answer to the second than Microsoft had offered in previous reports. The third concern remains the central debate because the spending base, lease obligations and falling free cash flow are all becoming too large to treat as temporary footnotes.
Fact Box
Microsoft’s Fiscal 2026 Scale
- Annual revenue: $331.8 billion, up 18%.
- Annual operating income: $155.2 billion, up 21%.
- Annual GAAP net income: $133.7 billion, up 31%.
- Annual operating cash flow: $182.9 billion.
- Annual additions to property and equipment: $115.9 billion.
- Microsoft Cloud annual revenue: $214.4 billion.
- Azure annual revenue: more than $100 billion for the first time.
Original source: Microsoft fiscal 2026 fourth-quarter earnings release
Why 43% Microsoft Azure Growth Matters
Azure’s 43% reported growth rate was important for more than the numerical beat. It broke a pattern in which Microsoft’s cloud growth had remained strong but appeared constrained by capacity and burdened by comparison with faster-growing Google Cloud. According to Microsoft’s quarterly performance metrics, Azure grew 39% in the June 2025 quarter, 40% in September 2025, 39% in December 2025, 40% in March 2026 and 43% in June 2026. Full-year fiscal 2026 growth was 41%.
A three-percentage-point acceleration may sound modest in isolation. At Azure’s scale, it is economically meaningful. Microsoft disclosed that Azure generated more than $100 billion during fiscal 2026, compared with more than $75 billion in fiscal 2025. A business of that size cannot add four percentage points of annual growth through a small product launch or one unusually large contract. It requires broad customer consumption, additional capacity and large enterprise commitments.
The historical comparison also matters. Microsoft reported 46% Azure growth in the quarter ended March 31, 2022, and 40% in the quarter ended June 30, 2022. The latest 43% rate therefore represents the fastest reported quarterly pace since early 2022, before Microsoft’s current generative-AI infrastructure cycle became the dominant strategic issue. The company has effectively returned Azure to a growth rate associated with a much earlier stage of cloud adoption, but now from a substantially larger revenue base.
That is the core reason the market reaction was so strong. Investors had spent much of the year evaluating an uncomfortable equation: capital spending was growing much faster than Azure revenue, cloud gross margins were declining and Microsoft was still not disclosing enough direct AI-product revenue to measure payback. The June quarter did not reverse every part of that equation, but it improved the revenue side considerably.
Reuters reported that Azure’s 43% growth exceeded the Visible Alpha consensus estimate of 39.98%. More importantly, Microsoft guided to approximately 45% Azure growth in constant currency for the September quarter, compared with an analyst expectation near 41%. If delivered, that would indicate that the June acceleration was not simply the result of one contract, a favorable comparison or capacity arriving at the end of the period.
Management attributed the outperformance partly to operating efficiencies and capacity that came online earlier than expected. Chief Financial Officer Amy Hood said demand continued to exceed available supply. That qualification is important: the acceleration was not evidence of unlimited capacity but of Microsoft becoming better at converting installed infrastructure into billable usage. In a capacity-constrained business, delivery timing can shift revenue between quarters. Sustained growth requires both continued demand and reliable execution in data-center construction, power availability, networking and server deployment.
Azure’s $100 Billion Milestone Improves Transparency
Microsoft historically disclosed Azure’s percentage growth without reporting the platform’s absolute revenue. That made it difficult to compare Azure directly with Amazon Web Services, which reports both revenue and operating income. Microsoft began giving more annual scale markers as investor scrutiny of AI spending intensified. Azure exceeded $75 billion in fiscal 2025 and passed $100 billion in fiscal 2026.
The disclosure is useful because it allows a rough assessment of the relationship between infrastructure spending and revenue expansion. An annual Azure business above $100 billion is no longer a speculative side bet attached to Microsoft’s Office franchise. It is one of the world’s largest enterprise technology businesses in its own right. It also gives Microsoft a platform through which it can sell computing, storage, databases, security, developer tools and model access, rather than depending entirely on the economics of a single consumer chatbot or software subscription.
The disclosure still has limits. Microsoft does not provide quarterly Azure dollars, Azure gross margin or Azure operating profit. Azure is reported inside the broader Intelligent Cloud segment, which also includes server products and enterprise services. Microsoft Cloud gross margin combines Azure with commercial portions of Microsoft 365, Dynamics 365 and other cloud products. That means investors can see the direction of Azure growth but cannot calculate a clean quarterly return on the capital dedicated to Azure and AI infrastructure.
The missing information matters more as capital intensity rises. A 43% revenue growth rate is impressive, but the economic value depends on the cost of serving that growth. Traditional cloud workloads can often become more profitable as infrastructure is utilized efficiently. Generative-AI workloads may carry different economics because they require expensive accelerators, intensive networking, large energy consumption and frequent hardware refreshes. Microsoft’s disclosure that roughly two-thirds of quarterly CapEx was directed toward short-lived assets such as CPUs and GPUs reinforces that distinction.
What the Earnings Discussion Got Right
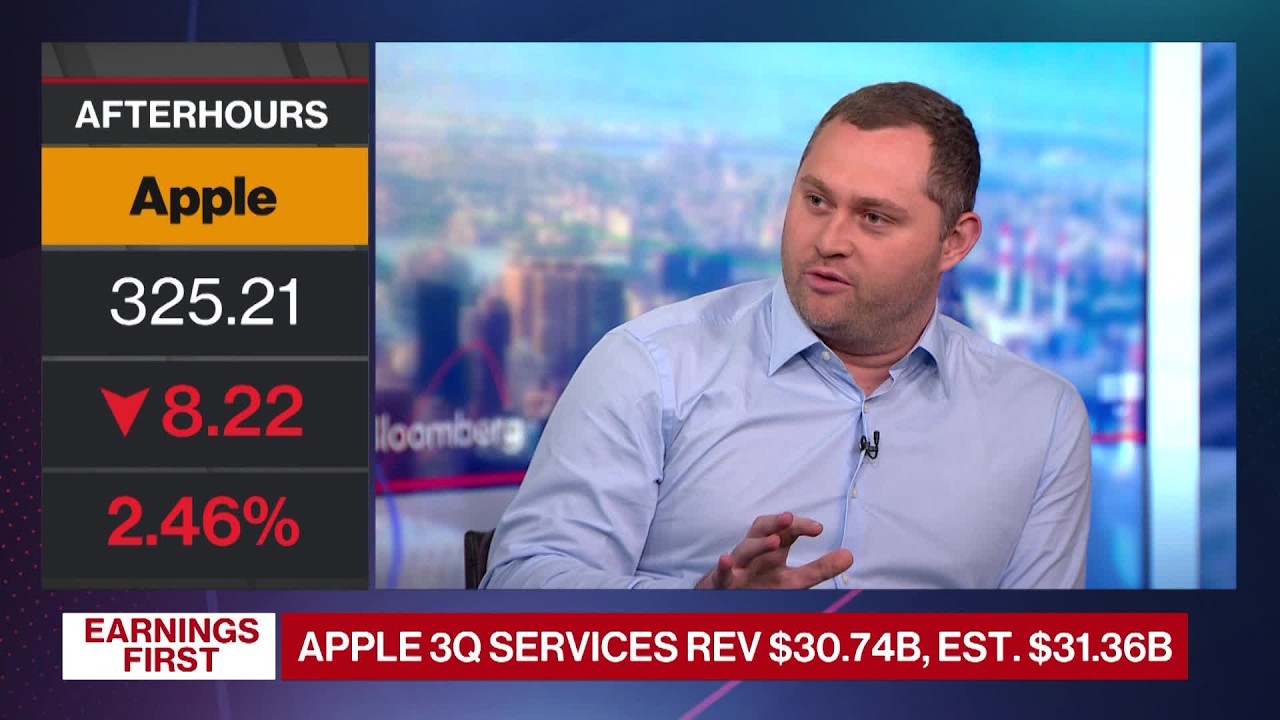
Bloomberg Technology host Ed Ludlow’s immediate discussion of the results focused on a simple comparison: Azure growth of about 43% versus capital expenditure growing more than 50% on a forward-looking basis. That framing captures the central investor concern. If the infrastructure base expands far faster than the revenue it produces for an extended period, free cash flow and returns on invested capital will remain under pressure. If Azure and Copilot revenue accelerate toward the pace of infrastructure spending, the market can begin to view the buildout as productive growth investment rather than an open-ended cost.
The discussion also correctly emphasized Microsoft’s increased disclosure. The annual Azure revenue figure, Copilot paid-seat count and commercial backlog provide more tangible evidence than broad claims about customer interest. Microsoft’s AI narrative is moving from product demonstrations and pilot projects toward measurable adoption.
The 30 million paid Microsoft 365 Copilot seats were particularly important. Microsoft had reported 20 million paid seats at the end of March, meaning the count rose at least 50% in one quarter. Reuters estimated that analysts had expected about 26.9 million seats. Paid-seat growth is easier to understand than abstract references to token usage because it connects AI adoption to a familiar enterprise software model.
Yet the simple CapEx-versus-Azure-growth comparison is incomplete. Capital expenditure supports more than Azure. It also supports Microsoft 365, GitHub, search, security, gaming, internal model training and future products. Some infrastructure is leased rather than purchased. Some spending is recorded immediately in cash flow, while some is depreciated over years. Azure revenue growth is a percentage applied to an undisclosed quarterly base, while CapEx growth is measured in dollars and can be volatile as projects are completed.
The better test uses several measures together: Azure growth, Microsoft Cloud gross margin, operating income, operating cash flow, free cash flow, backlog quality, utilization, product adoption and the timing of depreciation. On that broader scorecard, the June quarter was encouraging but not conclusive.
Microsoft 365 Copilot’s 30 Million Paid Seats: A Material Milestone With Important Gaps
Microsoft 365 Copilot is strategically different from Azure. Azure monetizes infrastructure consumption, while Copilot attempts to attach an AI subscription or premium service to Microsoft’s enormous installed base of commercial productivity users. The combination is central to Microsoft’s strategy: it can earn revenue from the computing layer and from the application layer that consumes that computing.
Passing 30 million paid seats is meaningful for four reasons.
First, the count increased rapidly. Moving from 20 million to more than 30 million in one quarter implies at least 10 million net additions. Microsoft said net paid-seat additions more than doubled sequentially. That suggests large enterprise deployments are moving beyond limited trials.
Second, enterprise distribution is becoming broader. Chief Executive Satya Nadella said the number of customers with more than 50,000 Copilot seats increased more than sevenfold from a year earlier. He also said the number of enterprise customers deploying Copilot to a majority of their information workers rose 75% from the previous quarter. These figures indicate that the product is beginning to reach company-wide rollouts rather than isolated teams.
Third, paid seats create a more visible revenue path than free chat usage. Microsoft can bundle Copilot with Microsoft 365 plans, sell premium functionality and use adoption to defend its broader productivity franchise against AI-native competitors. The product may also increase the value of Microsoft’s security, identity, data and compliance tools because enterprise AI requires controlled access to corporate information.
Fourth, Copilot adoption can improve the economics of Microsoft’s infrastructure. When Microsoft sells an application-layer subscription that runs on its own cloud, it can capture more of the value chain than a pure infrastructure provider. That vertical integration is one reason the company is willing to invest so aggressively in computing capacity.
Why the Seat Count Does Not Reveal Copilot Revenue
The 30 million figure should not be multiplied mechanically by the original $30-per-user monthly list price to estimate annual revenue. Enterprise contracts include negotiated discounts, bundled plans, partial-period deployments, different product tiers and customers who may pay through broader enterprise agreements. Microsoft also uses the Copilot name across consumer, developer, security and business applications, making it easy to combine unlike products.
Microsoft has not disclosed Microsoft 365 Copilot revenue, average revenue per paid seat, renewal rates, usage intensity or gross margin. Those omissions prevent a precise assessment of the product’s current economics. A paid seat can be commercially valuable even if usage is light, but light usage may create renewal risk. Heavy usage can improve customer value while increasing inference costs. The ideal outcome is high, durable usage with enough pricing power and efficiency gains to preserve attractive margins.
Independent research provides some evidence that enterprise AI tools can save time, but it also shows that adoption is uneven. A 2025 field experiment involving more than 6,000 workers across 56 firms found that employees given Microsoft 365 Copilot spent less time reading email and completed documents faster, while fewer than half used the product regularly throughout the study. A 2026 Microsoft-affiliated analysis of millions of anonymized Copilot Chat sessions found broad use in writing, information retrieval and analysis, but different adoption patterns across occupations.
These studies support a measured interpretation. Copilot can create real productivity value, but the value is not automatic and may vary by job, workflow, training and data quality. Microsoft’s commercial opportunity depends on turning that uneven usefulness into repeatable organizational deployment, measurable outcomes and renewals.
Fact Box
What Microsoft Disclosed About Copilot
- Microsoft 365 Copilot paid seats exceeded 30 million at June 30, 2026.
- The comparable count was 20 million at the end of the March quarter.
- Customers with more than 50,000 seats increased more than sevenfold year over year.
- Enterprise customers deploying Copilot to most information workers increased 75% sequentially.
- Microsoft did not disclose Copilot revenue, average price, renewal rate or product-level margin.
Original source: Microsoft fiscal 2026 fourth-quarter earnings call
The $678 Billion Backlog Is Powerful Evidence, but It Is Not Cash in the Bank
Microsoft’s commercial remaining performance obligations, commonly called RPO, reached $678 billion at the end of June. That was up 84% from a year earlier and up from $627 billion three months earlier. RPO represents contracted revenue that has not yet been recognized, including both billed and unbilled commitments. It is one of the strongest indicators that customers are making long-term commitments to Microsoft’s cloud and software portfolio.
The backlog matters because AI infrastructure is built before all related revenue arrives. Data centers, power connections, accelerators and networking equipment require large upfront commitments. A large contracted revenue base reduces the risk that Microsoft is building capacity solely on management optimism. It suggests that customers have signed agreements that will consume services over time.
The composition is as important as the total. Microsoft said the sequential increase in RPO came entirely from customers outside the small group of frontier-model developers. Excluding OpenAI, commercial RPO grew 25% year over year. Management also said nearly 90% of fiscal 2026 cloud revenue came from customers outside frontier-model companies. Those details address a recurring concern that Microsoft’s apparent AI demand may be overly concentrated in OpenAI or a few model laboratories whose financing and cloud commitments can be interconnected with their strategic investors.
Still, RPO should not be treated as immediate revenue, profit or cash. Microsoft reported a weighted average duration of 2.3 years, and only about 30% of the balance was expected to be recognized during the next 12 months. Some contracts can include flexible consumption schedules, renewal choices, service-level conditions or dependencies on capacity. The backlog provides visibility, not a guarantee that every dollar will arrive on the original timing or carry the same margin.
The rapid growth also reflects very large multiyear agreements. A single contract can add substantially to RPO even if near-term revenue recognition is limited. That is why the market should evaluate the backlog together with commercial bookings, cloud consumption and cash collections. Microsoft said commercial bookings grew 18% excluding OpenAI, a healthy but far slower rate than the 84% headline RPO increase. The difference illustrates how contract timing and a few large commitments can make backlog growth more volatile than underlying revenue.
Backlog Quality Is Improving Through Diversification
The most reassuring part of the disclosure was not the absolute $678 billion figure. It was management’s statement that the quarter-to-quarter increase came from customers outside frontier AI laboratories. Enterprise adoption across financial services, health care, manufacturing, retail, software and the public sector would create a more diversified revenue base than dependence on model developers alone.
Diversification also supports cross-selling. A customer that begins with Azure AI infrastructure may add Microsoft 365 Copilot, GitHub Copilot, security, identity, databases and analytics. Conversely, an existing Microsoft 365 customer can adopt Copilot and then increase Azure consumption for custom agents and internal applications. This is the commercial advantage of Microsoft’s integrated platform.
The risk is that integration can obscure economics. A large enterprise agreement may bundle discounts across products, making it difficult for outsiders to know whether Microsoft is earning attractive returns on the AI component or using its established software franchise to support adoption. The company’s consolidated operating income shows that the overall model remains highly profitable, but product-level disclosure will become more important as AI infrastructure absorbs a larger share of capital.
The CapEx Headline Is More Complicated Than It Looks
Microsoft’s capital expenditure reached approximately $41 billion in the June quarter. About $35.8 billion represented cash additions to property and equipment, while roughly $5.6 billion came through finance leases. Management said around two-thirds of CapEx was directed to short-lived assets, primarily CPUs and GPUs, with the remainder going to longer-lived assets such as data-center buildings and network infrastructure.
The distinction between short-lived and long-lived assets is central to the economics. Buildings and electrical infrastructure can support many generations of hardware. Accelerators and servers have shorter useful lives and may become less efficient relative to new chips within a few years. A capital program dominated by short-lived equipment requires continuous reinvestment, even if demand remains strong.
Microsoft’s calendar-2026 reported CapEx forecast moved to approximately $175 billion from an earlier market understanding near $190 billion. Taken at face value, that could look like a meaningful spending reduction. Management explicitly warned against that interpretation.
Beginning in fiscal 2027, Microsoft is extending the estimated useful life of data centers and office buildings from 15 years to 25 years. The change affects lease classification. Under U.S. accounting rules, one test for determining whether a lease is a finance lease considers how much of the asset’s economic life is covered by the lease term. Extending the assumed life means that some leases previously classified as finance leases will instead be classified as operating leases.
Finance-lease additions are included in Microsoft’s reported capital-expenditure presentation even when the cash payment occurs over time. Operating leases generally do not enter that CapEx measure in the same way. As a result, the accounting change lowers reported CapEx without necessarily reducing the amount of infrastructure Microsoft has contracted to use or the cash it will pay over the life of those leases.
Amy Hood said the underlying calendar-2026 investment expectations remained essentially unchanged. The lower reported number was therefore a classification effect rather than a strategic retreat from data-center construction.
A Plain-English Example of the Lease Change
Consider a simplified example. Suppose Microsoft signs a 15-year lease for a data-center building. If the building is assumed to have a 15-year useful life, the lease covers all of its economic life and is likely to resemble a financed purchase. If the same building is assumed to last 25 years, the 15-year lease covers only 60% of its life and is more likely to qualify as an operating lease.
The building, capacity and contractual payments can be identical in both examples. What changes is the accounting classification. The first arrangement can create a finance-lease asset and liability included in a CapEx measure. The second creates an operating-lease asset and liability that may not be included in the same reported CapEx figure.
This does not mean the accounting is improper. Companies regularly revise useful-life estimates when experience, construction methods and asset economics change. Microsoft said the operating-income effect would be minimal because lower building depreciation would be offset by operating-lease expense. The issue for investors is comparability: a headline decline in reported CapEx after the change does not necessarily indicate lower infrastructure commitments.
Fact Box
What Changed—and What Did Not
- Changed: Microsoft extended estimated useful lives for data centers and office buildings from 15 to 25 years beginning in fiscal 2027.
- Changed: More future leases are expected to be classified as operating leases rather than finance leases.
- Changed: Reported calendar-2026 CapEx is expected to be approximately $175 billion, lower than the previous roughly $190 billion presentation.
- Did not materially change: Management’s underlying calendar-2026 investment expectations.
- Still rising: Fiscal 2027 capital expenditure is expected to increase from fiscal 2026, with more than $50 billion projected for the September quarter alone.
Original source: Microsoft fiscal 2026 fourth-quarter earnings call
Why $329.1 Billion of Uncommenced Leases Deserves Attention
Microsoft disclosed $329.1 billion of data-center leases that had been signed but had not yet commenced. These obligations are scheduled to begin between fiscal 2027 and fiscal 2033. The figure was up sharply from the March quarter, when the comparable amount was about $196.6 billion.
Uncommenced leases are not the same as current debt. Microsoft has not yet taken possession of the facilities or begun recognizing lease expense for all of them. The obligations will start over multiple years, and the related capacity may generate revenue before or while payments are made. Nevertheless, the figure demonstrates how much future infrastructure Microsoft has already contracted.
The commitments make the AI buildout less reversible than ordinary discretionary operating spending. Microsoft can slow new lease signings, defer some projects or change equipment orders, but it cannot instantly unwind contracts already executed without economic consequences. This increases the importance of accurate long-range demand planning.
It also changes how investors should think about capital discipline. Traditional CapEx analysis focuses on cash purchases of property and equipment. For a hyperscale cloud company, lease commitments, power contracts, networking obligations and purchase agreements can be just as important. A comprehensive view of Microsoft’s infrastructure exposure therefore includes cash CapEx, finance leases, operating leases and other contractual commitments.
Free Cash Flow Is the Most Important Counterweight to the Growth Story
Microsoft generated $55.4 billion of operating cash flow in the June quarter, up from $42.6 billion a year earlier. That is a remarkable cash-generation result. Yet free cash flow fell to $19.6 billion because capital spending rose so sharply. The contrast shows why revenue growth alone cannot settle the AI investment debate.
Free cash flow is not a perfect measure. Microsoft defines it as operating cash flow minus additions to property and equipment, and it does not include every economic cost of leases in the same period. Working-capital movements can also make quarterly comparisons volatile. Even so, free cash flow captures the central trade-off: how much cash remains after Microsoft funds the infrastructure required to operate and expand its businesses.
In the short term, falling free cash flow is not automatically a sign of weak economics. A company can rationally spend ahead of demand when it has strong contracts, limited supply and a high probability of future revenue. Microsoft’s cloud backlog, Azure acceleration and capacity constraints support that argument. The company also retains exceptional financial flexibility, with $76.8 billion of cash and short-term investments at June 30 and annual operating cash flow of $182.9 billion.
The concern is duration. If capital spending remains elevated for years while cloud margins decline, the investment case requires increasingly large future cash flows to compensate. Microsoft said it expects to remain free-cash-flow positive and projected only a modest decline in full-year operating margin for fiscal 2027. That guidance indicates confidence that the software and cloud franchises can absorb the infrastructure costs. Investors will need evidence in subsequent quarters that free cash flow stabilizes or begins to grow despite the continued buildout.
Microsoft Cloud Gross Margin Fell to 65%
Microsoft Cloud gross margin declined to 65% in the June quarter from 68% a year earlier. The full-year margin was 66%. Management attributed the pressure to sales mix, higher infrastructure costs and increased usage of AI services.
A 65% gross margin remains exceptionally high for most industries, but the direction matters. Microsoft’s historic strength came from software economics: once developed, another copy of software could be distributed at low incremental cost. Cloud computing replaced some of that model with ongoing server, networking and energy expenses. Generative AI intensifies the trend because inference consumes expensive computing each time a user submits a prompt or an agent performs a task.
Microsoft can offset these costs in several ways. It can increase prices, improve model efficiency, design custom chips, raise hardware utilization, route tasks to lower-cost models and sell higher-value application subscriptions. Nadella said Microsoft’s work on models and chips had produced efficiency improvements of up to 40% in some areas. The company’s multi-model strategy also allows it to choose among OpenAI, Anthropic, its own models and open-weight alternatives depending on price and performance.
The margin trajectory will reveal whether those gains can keep pace with usage. If cloud gross margin stabilizes while Azure growth remains above 40%, the economic case for the buildout strengthens substantially. If margin continues to fall and free cash flow remains under pressure, the revenue acceleration may be less valuable than the headline suggests.
The Earnings Beat Was Real, but GAAP EPS Included Investment Gains
Microsoft reported GAAP diluted EPS of $4.81, up 32% from a year earlier. The number exceeded the analyst expectation of $4.24 cited by the Associated Press. It should not be interpreted as a pure measure of operating improvement.
The quarter included a $3.2 billion gain related to Microsoft’s investment in Anthropic. Microsoft also recorded other discrete items, including severance costs and impairments associated with Xbox. The company said the net effect of these items increased diluted EPS by $0.27 relative to the guidance framework it had provided in April. Microsoft’s non-GAAP diluted EPS was $4.74, up 23%.
The distinction matters because an unrealized or valuation-related investment gain is not recurring revenue from Azure or Copilot. It can be economically valuable, but it does not demonstrate that Microsoft’s core operations became more profitable. The operating results were strong without the gain: revenue and operating income both increased 18%, and non-GAAP net income rose 22%.
Microsoft’s Anthropic position also reflects a broader strategic pattern in the AI industry. Cloud providers invest in model developers, which in turn commit to consume cloud infrastructure. Microsoft announced in November 2025 that it would invest up to $5 billion in Anthropic while Anthropic committed to substantial Azure usage. The arrangement gives Microsoft access to another leading model provider and reduces product dependence on OpenAI, but it can make the relationship between investment gains, cloud commitments and reported demand more complex.
The cleanest reading is therefore twofold. Microsoft’s core quarter exceeded expectations and showed stronger operating momentum. The statutory EPS growth rate was additionally helped by investment accounting and should not be used alone to measure the success of the cloud and AI strategy.
Microsoft’s Segment Results Show Where the Growth and Profits Are Coming From
Microsoft organizes its financial reporting into three segments: Productivity and Business Processes, Intelligent Cloud, and More Personal Computing. The June quarter reinforced how decisively the company’s economic center has shifted toward cloud services and enterprise software.
Productivity and Business Processes
Productivity and Business Processes generated $37.8 billion of quarterly revenue, up 14%. The segment includes Microsoft 365 commercial and consumer products, LinkedIn and Dynamics. For the full fiscal year, it produced $140.0 billion of revenue and $83.9 billion of operating income.
This remains Microsoft’s most profitable segment. Its operating margin for the full year was approximately 60%, reflecting the durability of subscriptions, enterprise agreements and the Microsoft 365 installed base. Microsoft 365 Commercial cloud revenue grew 14% as reported in the June quarter, or 16% after adjusting for a prior-year revenue-recognition issue disclosed by the company. Commercial seat growth remained 6%.
Copilot matters partly because it can increase revenue per user even when seat growth is in the mid-single digits. Microsoft’s productivity franchise is mature in large enterprises, so future growth increasingly depends on premium tiers, security, analytics and AI rather than adding entirely new users. Thirty million Copilot seats represent only a fraction of the broader commercial base, leaving room for expansion if customers see measurable value.
Intelligent Cloud
Intelligent Cloud generated $39.3 billion of quarterly revenue, up 32%, and $137.8 billion for the full year. Annual segment operating income was $57.0 billion. The segment includes Azure, server products and enterprise services.
Intelligent Cloud is now roughly as large as Productivity and Business Processes by annual revenue but substantially less profitable. The difference reflects the capital and operating costs of data centers, hardware and energy. Its faster growth is shifting Microsoft’s revenue mix toward a business with lower current margins than the productivity segment.
That mix shift is not necessarily negative. Azure can become more profitable as capacity fills, and it gives Microsoft strategic control over the infrastructure layer. But it explains why consolidated cloud gross margin can decline even while revenue growth accelerates. The company is growing fastest in the part of its portfolio that requires the most physical investment.
More Personal Computing
More Personal Computing generated $12.9 billion of quarterly revenue, down 4%. Windows OEM and Devices revenue fell 7%, while Xbox content and services revenue declined 10%. Search and news advertising revenue excluding traffic-acquisition costs grew 10%.
The segment’s weakness provides useful context. Microsoft’s headline 18% revenue growth was not the result of uniform strength. Cloud and productivity businesses more than offset declines in Windows-related hardware and gaming. For the full year, More Personal Computing produced $54.1 billion of revenue and $14.4 billion of operating income, making it far smaller and less profitable than Microsoft’s two enterprise-oriented segments.
This portfolio structure reduces Microsoft’s dependence on any single consumer cycle. Weak PC shipments or gaming performance can matter without dominating consolidated results. It also means the company can continue funding AI infrastructure from mature software profits while Azure scales.
| Segment | FY2026 revenue | FY2026 operating income | Approximate operating margin |
|---|---|---|---|
| Productivity and Business Processes | $140.0 billion | $83.9 billion | 59.9% |
| Intelligent Cloud | $137.8 billion | $57.0 billion | 41.3% |
| More Personal Computing | $54.1 billion | $14.4 billion | 26.6% |
Source: Microsoft fiscal 2026 fourth-quarter earnings release. Approximate margins are calculated by dividing segment operating income by segment revenue and may differ slightly because of rounding.
How AI Is Changing Microsoft’s Business Model
Microsoft’s financial structure was built around software subscriptions with high gross margins, predictable renewals and relatively modest physical capital requirements. Azure had already changed that model before generative AI arrived, but the latest infrastructure cycle is accelerating the transformation. Microsoft is becoming a company in which software, cloud utilities, specialized hardware and long-term energy commitments are inseparable.
The change can be seen on both sides of the balance sheet. Property and equipment are expanding rapidly, while lease commitments reach years into the future. On the income statement, cloud services account for a growing share of revenue and carry higher delivery costs than traditional software licenses. On the cash-flow statement, operating cash generation remains enormous, but a greater portion is being reinvested before shareholders can receive it.
This evolution does not necessarily make Microsoft a worse business. It can deepen the company’s competitive moat. Enterprise customers cannot easily replicate global computing infrastructure, proprietary chips, model partnerships, identity systems and productivity applications. A provider that controls the full stack can optimize performance and capture revenue at multiple layers.
It does change the standards by which performance should be judged. Software investors traditionally emphasize recurring revenue, retention and operating margin. Infrastructure investors must also examine utilization, asset life, replacement cycles, energy costs and returns on invested capital. Microsoft now requires both sets of analysis.
From Selling Software Seats to Selling Work Completed
Microsoft’s language about the “cost-to-outcome” curve reflects another change. The company historically charged for access to software—an operating system, productivity suite or server license. Cloud computing added consumption-based billing for storage and processing. AI introduces a model in which customers increasingly evaluate the price of completing a task: summarizing a legal file, writing code, handling a service request or analyzing a supply chain.
This outcome-based framing can expand Microsoft’s addressable market. If an AI system saves enough labor or improves revenue, customers may pay more than they would for a conventional software seat. The value can also vary widely by industry and task, giving Microsoft opportunities to create specialized agents and vertical products.
The challenge is measurement. Customers may struggle to separate AI productivity gains from training, workflow redesign or broader economic changes. Some tasks are easy to count, while others depend on quality, judgment and risk. An agent that completes more work but introduces costly errors can have negative value. Microsoft therefore needs governance and monitoring products alongside the models themselves.
Why Application Revenue May Be More Valuable Than Token Revenue
Azure earns money when customers consume computing resources. That revenue can grow quickly, but it carries ongoing hardware and energy costs. Copilot and other application products can potentially command a higher margin because customers pay for a business solution rather than raw computation.
Microsoft’s ideal economic model combines the two. Azure captures infrastructure spending from customers and model developers, while Copilot captures application value from end users. Security, identity, data and developer tools add further recurring revenue. The same underlying infrastructure can support several products, improving utilization.
The risk is internal competition for capacity. Microsoft must decide whether a scarce GPU should serve a third-party Azure customer, an OpenAI workload or an internal Copilot product. The most strategically important use may not produce the highest immediate revenue. Poor allocation can slow customers, raise costs or reduce product quality.
A More Capital-Intensive Microsoft Can Still Produce Strong Returns
Capital intensity should not be confused with low profitability. AWS has shown that cloud infrastructure can generate high operating income, while Microsoft’s own Intelligent Cloud segment remains very profitable. The critical issue is whether incremental returns stay attractive as the industry builds capacity at unprecedented scale.
Microsoft’s mature software franchises give it an advantage during the transition. They generate cash, provide enterprise relationships and create application demand for the infrastructure. The June quarter shows that this flywheel is functioning. The next several years will determine whether it becomes more efficient as it scales or requires permanently higher reinvestment than Microsoft’s historic valuation assumed.
Microsoft’s Competitive Position in the Cloud AI Race
Azure’s acceleration occurred in a cloud market that is expanding rapidly rather than shifting entirely from one provider to another. Synergy Research Group estimated that enterprise spending on cloud infrastructure services reached $129 billion in the first quarter of 2026, up 35% from a year earlier. Amazon Web Services held an estimated 28% share, Microsoft 21% and Google 14%. Together, the three companies controlled about two-thirds of the public-cloud market.
Microsoft’s second-place position is both a strength and a source of pressure. Azure is large enough to benefit from global scale, enterprise relationships and a broad partner ecosystem. At the same time, Amazon remains the market leader, while Google has been growing faster and using its expertise in models, custom accelerators and data infrastructure to gain share.
Amazon Web Services: The Scale and Profit Benchmark
Amazon Web Services generated $37.6 billion of revenue in the first quarter of 2026, up 28%, and $14.2 billion of operating income. AWS remains the most transparent benchmark because Amazon reports the unit’s revenue and operating profit separately. Its approximately 38% operating margin in that quarter demonstrates that cloud infrastructure can produce substantial profit at scale, even while the parent company invests heavily in AI capacity.
Microsoft does not disclose an equivalent Azure operating margin. Intelligent Cloud’s annual operating margin of about 41% includes higher-margin server products and services in addition to Azure, so it cannot be compared directly with AWS. The absence of a pure Azure profit figure gives Microsoft more flexibility in how it presents the business but leaves investors with less visibility into returns.
AWS has advantages in infrastructure breadth, developer familiarity and a large installed base of cloud-native customers. Microsoft’s counterweight is its enterprise software distribution. A company already using Entra identity, Microsoft 365, Windows, SQL Server, Teams and Dynamics may find it operationally easier to build AI applications on Azure and govern them through Microsoft’s security stack. That integration can matter as AI moves from experimentation into regulated business processes.
Google Cloud: Faster Growth and Strong AI Credentials
Alphabet reported Google Cloud revenue of $24.8 billion for the June 2026 quarter, up 82% from a year earlier, with operating income of $8.8 billion. The extraordinary growth rate was driven by enterprise AI infrastructure and solutions as well as core Google Cloud Platform services.
Google’s acceleration creates a more demanding comparison for Microsoft than AWS’s larger but slower-growing business. Google controls its Gemini model family, designs Tensor Processing Units and has deep expertise in data, search and machine learning. Its cloud division has also moved from persistent losses to substantial profitability.
The comparison requires caution. Alphabet’s reported Google Cloud revenue includes Google Workspace as well as Google Cloud Platform, while Microsoft’s Azure growth rate excludes most Microsoft 365 revenue. The businesses use different definitions and revenue bases. Google’s 82% growth therefore cannot be treated as a direct like-for-like victory over Azure’s 43%.
Still, Google’s progress raises the competitive bar. Enterprise customers increasingly use more than one cloud and more than one model provider. Microsoft must demonstrate that its advantage is not only an early relationship with OpenAI but a durable platform capable of offering competitive models, prices, tools and governance.
Why Microsoft’s Distribution Advantage Still Matters
Microsoft’s greatest strategic asset may be neither a model nor a chip. It is distribution into the daily workflow of businesses. Microsoft 365, Teams, GitHub, Windows, Dynamics and security products give the company many points at which to introduce AI capabilities. Azure gives customers infrastructure for building their own systems, while Copilot products offer packaged applications for employees and developers.
This creates a reinforcing loop. More enterprise applications can generate more Azure consumption. More Azure workloads make Microsoft’s security, identity and data tools more valuable. More Copilot users create pressure to organize corporate data and permissions within Microsoft’s ecosystem. The combination can increase customer switching costs and expand revenue per account.
The same integration creates antitrust and customer-choice concerns. Regulators and competitors may argue that bundling AI features into dominant productivity products disadvantages independent software providers. Customers may also resist paying for overlapping Copilot products if pricing and product boundaries become difficult to understand. Microsoft must balance cross-selling with transparency and flexibility.
Microsoft Is Reducing Its Dependence on Any Single AI Model Provider
Microsoft’s partnership with OpenAI gave it an early advantage in generative AI. Azure became the primary infrastructure partner for OpenAI, and Microsoft integrated OpenAI models across Copilot products. That relationship helped Microsoft move faster than many enterprise competitors after the launch of ChatGPT.
By fiscal 2026, concentration had become a strategic risk. OpenAI was both a major customer and a model supplier. Large cloud commitments could inflate Microsoft’s backlog while raising questions about circular financing, particularly when Microsoft invested capital in model developers that then spent money on Azure. Product dependence could also expose Microsoft to pricing disputes, model delays, governance changes or direct competition from OpenAI applications.
Microsoft’s response has been to broaden its model and infrastructure strategy. The company invested up to $5 billion in Anthropic and added Claude models to parts of its platform. It continued developing smaller in-house models, expanded access to open-weight models and invested in custom silicon. Nadella described Microsoft’s approach as multi-model and multi-silicon, with the goal of choosing the most efficient combination for each workload.
This strategy has several advantages. Competition among model providers can lower inference costs. Smaller models can handle routine tasks that do not require frontier-level reasoning. Custom accelerators can reduce dependence on Nvidia for some workloads, while CPUs and GPUs from multiple suppliers improve negotiating leverage. Customers in regulated industries may also prefer model choice because of data-residency, explainability or risk-management requirements.
The strategy is not a clean break from OpenAI. Microsoft still has deep commercial, technical and financial ties to the company, and OpenAI commitments remain a meaningful part of backlog. The more realistic objective is diversification rather than independence.
The Anthropic Gain Shows Both Opportunity and Complexity
Microsoft’s $3.2 billion quarterly gain on its Anthropic investment illustrates the financial upside of backing successful model providers. Anthropic raised substantial capital at rising valuations during 2026, increasing the marked value of Microsoft’s position.
The gain also makes the financial statements harder to interpret. Microsoft can benefit as an investor, a cloud provider and a distributor of Anthropic models. Anthropic can receive capital from Microsoft and commit to consume Azure services. Each element may be commercially rational, but investors should distinguish investment appreciation from operating revenue and contracted cloud demand from realized cash flow.
The key evidence in Microsoft’s favor is that backlog and cloud revenue growth are broadening beyond frontier-model companies. If Azure’s acceleration depended mainly on OpenAI and Anthropic, the growth would be less diversified and potentially more vulnerable to financing conditions in the model industry. Management’s ex-OpenAI disclosures reduce that concern without eliminating it.
Capacity Constraints Are Both a Positive Signal and an Execution Risk
Microsoft said demand continued to exceed available Azure capacity. The company added 31 data centers during the June quarter and 88 during the fiscal year, while adding approximately one gigawatt of capacity in the quarter. Management said it remained on track to roughly double capacity over two years.
Capacity constraints can be interpreted positively because they indicate that customers want more computing than Microsoft can currently supply. New capacity can be monetized quickly, supporting revenue acceleration and reducing the risk of empty facilities.
Constraints can also limit growth and damage customer relationships. If customers cannot obtain GPUs or cloud capacity when needed, they may move workloads to AWS, Google Cloud, Oracle or specialized providers. Large enterprise AI programs require predictable supply, not merely access to a future queue. Microsoft therefore faces a difficult allocation problem among internal products, OpenAI, other model companies and ordinary Azure customers.
Execution involves more than buying chips. Data centers require land, permits, grid connections, transformers, cooling systems, networking equipment and skilled labor. Power availability has become one of the most significant bottlenecks. Projects can be delayed even when Microsoft has the money and customer demand.
Hardware deployment also creates technology risk. Accelerators ordered today may be less efficient by the time a facility is fully operational. Microsoft can reduce that risk by standardizing designs, using modular construction and deploying chips quickly, but it cannot remove the possibility that new architectures change the economics of existing equipment.
Efficiency Gains Are Becoming as Important as New Capacity
Microsoft’s June-quarter outperformance partly came from efficiency improvements. In a constrained environment, better scheduling, software optimization, networking and model compression can create billable capacity without waiting for a new building. Nadella said the company had achieved efficiency gains of as much as 40% in some model and chip combinations.
Efficiency has a direct effect on margins. If the same server can process more tokens, Microsoft can serve more demand with a given capital base. If a smaller model can perform a task at similar quality, inference costs fall. If workloads can be shifted to off-peak periods or distributed across regions, utilization improves.
These operational gains may ultimately determine which cloud providers earn attractive returns. Hardware access is increasingly available to all major hyperscalers, even if allocation differs. The lasting advantage may come from integrating chips, models, software and scheduling systems well enough to lower cost per useful business outcome.
Microsoft’s Enterprise AI Challenge Is Moving From Pilots to Outcomes
Enterprise AI adoption often begins with demonstrations and limited trials. The difficult stage is deployment across real workflows, where systems must connect to company data, respect permissions, produce reliable outputs and justify their cost. Microsoft’s 30 million Copilot seats suggest that more customers are moving into this second stage, but the company still has to prove that deployments renew and expand.
Microsoft launched its Frontier Company initiative in July 2026 with a planned $2.5 billion investment and thousands of engineers and specialists assigned to help customers implement AI systems. The initiative reflects a strategic recognition: selling access to models is not enough. Customers need help redesigning processes, measuring outcomes, securing data and managing organizational change.
This services-heavy approach can accelerate consumption and strengthen customer relationships. It can also pressure margins if projects require extensive human support. Microsoft must turn successful implementations into repeatable products and templates rather than treating every deployment as a bespoke consulting engagement.
The company’s language has shifted toward the “cost-to-outcome” curve. That framing is more economically useful than measuring token volume alone. Tokens represent model activity, but customers ultimately care about completed tasks, revenue gains, cost savings, risk reduction and employee productivity. A cheaper model that solves a business problem reliably can create more value than a larger model that consumes more tokens without improving the result.
The Strongest Case Supporting Microsoft’s AI Strategy
The favorable interpretation of the quarter rests on a combination of scale, acceleration and strategic position.
Demand Is Visible in Multiple Measures
Azure grew 43%, Microsoft Cloud grew 27%, Copilot paid seats exceeded 30 million and RPO reached $678 billion. Each measure has limitations, but together they show demand across infrastructure, applications and long-term contracts. The result is harder to dismiss as hype than an isolated product announcement or management anecdote.
Microsoft Can Fund the Buildout Internally
Annual operating cash flow reached $182.9 billion. The company ended June with $76.8 billion of cash and short-term investments and roughly $40.3 billion of current and long-term debt. Microsoft therefore has far more financial capacity than most AI companies. It can invest through temporary margin pressure without relying on repeated equity issuance or fragile external financing.
Enterprise Distribution Creates a Revenue Advantage
Microsoft can sell AI through existing commercial relationships rather than acquiring every customer from the beginning. Microsoft 365, Azure, GitHub, Dynamics and security products provide a broad surface for monetization. Enterprise buyers also value identity, compliance and contractual support, areas in which Microsoft has decades of experience.
Capacity Is Being Absorbed Quickly
Demand exceeding supply is preferable to overbuilding empty data centers. Microsoft said newly available capacity was monetized rapidly. The September-quarter Azure guidance suggests that additional infrastructure will continue translating into revenue.
Model Diversification Can Improve Economics
A multi-model strategy reduces dependence on OpenAI and allows Microsoft to route tasks to the lowest-cost model that meets quality requirements. Custom chips and software optimization can further lower cost per task. These gains could stabilize margins even as usage grows.
The Existing Software Franchise Provides a Margin Cushion
Productivity and Business Processes generated nearly $84 billion of annual operating income. That profit base gives Microsoft time to build infrastructure and refine AI products. Few competitors can combine a high-margin enterprise subscription franchise with a hyperscale cloud platform.
The Strongest Skeptical Case
The skeptical interpretation does not require denying that Azure and Copilot are growing. It questions whether the returns will justify the scale and duration of the investment.
Spending Is Still Growing Faster Than the Proven Cash Return
Quarterly CapEx rose more than 70%, while Azure revenue grew 43% and free cash flow fell 23%. The comparison is imperfect, but the direction is clear: Microsoft is investing faster than current cash generation is expanding. The company expects fiscal 2027 CapEx to grow again.
Cloud Margins Are Declining
Microsoft Cloud gross margin fell to 65% from 68%. If AI usage produces lower gross margins than traditional software and cloud workloads, revenue growth may not translate into proportional profit growth. Efficiency gains and pricing must offset expensive inference and frequent hardware replacement.
Accounting Changes Can Make Spending Look Lower Without Reducing Commitments
The shift from roughly $190 billion to $175 billion of calendar-2026 reported CapEx is mainly a classification change. Investors focused only on the headline could underestimate the continuing buildout. The $329.1 billion of uncommenced leases reveals substantial future obligations outside a simple cash CapEx figure.
Copilot Revenue Economics Remain Opaque
Thirty million paid seats are encouraging, but Microsoft has not disclosed revenue, discounts, renewal rates or usage. Large enterprises may have received favorable pricing to accelerate adoption. The product’s long-term value depends on renewal and expansion after customers evaluate actual productivity gains.
Backlog Includes Long-Dated and Concentrated Contracts
RPO is not immediate cash. Only about 30% is expected to be recognized within 12 months, and OpenAI remains a material component. Large contracts can be renegotiated or consumed more slowly than anticipated, especially if the AI industry’s financing environment weakens.
Competition Is Intensifying
Google Cloud’s rapid growth, AWS’s market leadership and the rise of specialized AI infrastructure providers limit Microsoft’s pricing power. Enterprise customers increasingly pursue multi-cloud strategies to avoid dependence on one vendor. Open-source and open-weight models may also reduce the value of proprietary model access.
The skeptical case is strongest when framed as a return problem rather than a demand problem. The June quarter makes it difficult to argue that Microsoft lacks AI demand. It does not yet prove that the demand will earn returns comparable with Microsoft’s historic software economics.
How to Compare Azure Growth With Capital Spending Without Misreading the Numbers
The most common shorthand in the Microsoft earnings debate compares Azure’s revenue growth rate with the growth rate of capital expenditure. The intuition is sensible: a company spending aggressively should eventually produce revenue and cash flow that justify the investment. The calculation becomes misleading when the percentages are treated as though they measure the same economic quantity.
Azure growth is a year-over-year percentage applied to an annual revenue base that Microsoft now says exceeds $100 billion. Capital-expenditure growth is a year-over-year percentage applied to a spending number affected by project timing, hardware deliveries, finance leases and accounting classification. One is a revenue flow; the other is an investment flow that creates assets used over several years. They should be connected, but they should not be expected to match in every quarter.
Several timing differences complicate the comparison. Microsoft may order accelerators months before installation, recognize finance-lease additions before all cash is paid and build data centers before customer workloads begin. Revenue can arrive after the asset enters service, while depreciation spreads part of the cost across its useful life. A quarter with unusually large equipment deliveries can therefore show explosive CapEx growth even if demand and long-term returns remain healthy.
The reverse can also occur. A lower reported CapEx number can look disciplined even when Microsoft has signed large operating leases or purchase commitments that do not appear in the same measure. The fiscal 2027 useful-life change makes this especially relevant. More leases will move outside the finance-lease component of reported CapEx, although Microsoft will still use the facilities and pay contractual rent.
A Better Analytical Framework
A more reliable assessment begins with the amount of incremental revenue Microsoft is generating. Fiscal 2026 Azure revenue exceeded $100 billion after surpassing $75 billion in fiscal 2025. Those thresholds indicate at least $25 billion of additional annual Azure revenue, although the exact increase cannot be calculated because Microsoft uses “more than” figures rather than precise totals. Microsoft Cloud revenue rose to $214.4 billion for the year, providing a broader measure of cloud monetization.
The next step is to examine operating profit and margin. Intelligent Cloud operating income increased, but cloud gross margin declined. This tells readers that the additional revenue is profitable at the segment and company level while also carrying heavier infrastructure costs. The direction of margin over the next several years will show whether utilization and efficiency improve enough to offset the more capital-intensive mix.
Cash flow is the third step. Operating cash flow measures cash generated before property and equipment spending. Free cash flow subtracts cash additions to property and equipment, making it more sensitive to the current buildout. Lease liabilities and other commitments should then be considered because they represent future payments not fully captured by a single period’s free-cash-flow calculation.
The fourth step is utilization. Management’s statement that demand exceeds capacity is useful, but utilization is not directly disclosed. Azure growth, rapid monetization of new capacity and rising backlog act as indirect evidence. If new data centers come online and Azure growth remains high, utilization is likely strong. If growth slows while capacity expands, the risk of overbuilding increases.
The fifth step is the durability of demand. A large backlog, paid Copilot seats and multiyear enterprise contracts support durability, but renewals and actual consumption matter more than signatures alone. Microsoft’s disclosure that backlog growth broadened outside frontier-model companies improves the quality of this evidence.
Finally, investors should compare the lifetime cash generation of the assets with their full cost, not merely one year of revenue growth. That requires estimates of hardware life, replacement spending, energy costs, lease payments, pricing and customer retention. Microsoft does not provide enough product-level data for an exact public calculation. The most responsible conclusion is therefore probabilistic: the June quarter improved the evidence of attractive returns, while the scale of future commitments keeps uncertainty unusually high.
What Microsoft’s Balance Sheet Says About Its Ability to Keep Spending
Microsoft’s balance sheet gives it a substantial advantage in the AI infrastructure race. At June 30, 2026, the company held $76.8 billion of cash, cash equivalents and short-term investments. Current debt was $9.2 billion and long-term debt was $31.1 billion. Annual operating cash flow reached $182.9 billion, while annual net income was $133.7 billion.
These figures mean Microsoft is not financing its data-center program from a position of financial distress. It can fund most investment from internal cash generation, maintain dividends and repurchases and preserve access to low-cost debt markets. The company returned $10.2 billion to shareholders through dividends and repurchases in the June quarter even while capital spending reached a record level.
Balance-sheet strength reduces financing risk, but it does not make poor investment harmless. Every dollar committed to infrastructure has an opportunity cost. Microsoft could otherwise return more capital, acquire businesses, increase research spending or preserve cash. The relevant question is not whether Microsoft can afford the buildout. It plainly can. The question is whether the buildout creates more value than alternative uses of the capital.
Property and equipment, net, increased to $313.1 billion from $205.0 billion one year earlier. That roughly $108 billion increase shows how quickly Microsoft is transforming from a software company with data centers into a physical-infrastructure owner and lessee on an unprecedented scale. Depreciation and lease expense will affect the income statement long after the initial construction wave.
This asset growth can produce a durable competitive barrier. Smaller competitors cannot easily replicate Microsoft’s global regions, power procurement, security certifications and enterprise support. Capacity ownership can also protect Microsoft when accelerators are scarce. The same assets become a burden if demand shifts, model efficiency reduces computing needs faster than expected or customers choose other providers.
Why Depreciation Will Matter More in Fiscal 2027 and Beyond
Capital spending does not reduce operating income immediately in the same way as an ordinary expense. Once an asset is placed in service, its cost is generally recognized through depreciation over its estimated useful life. This creates a lag between cash outflow and income-statement expense.
During the early stage of a buildout, free cash flow can weaken before the full depreciation burden appears in operating profit. As more facilities and servers enter service, depreciation rises. Revenue must grow enough to absorb that expense. Microsoft’s guidance for less than a one-percentage-point decline in fiscal 2027 operating margin suggests management expects revenue growth and cost discipline to offset most of the pressure.
The useful-life extension from 15 to 25 years will reduce annual depreciation on affected buildings, all else equal, because their cost is spread over a longer period. Microsoft said the overall operating-income effect would be minimal because changes in lease classification would create offsetting operating-lease expense. Short-lived servers and accelerators, which represent most current CapEx, are not protected by the building-life extension and will continue to depreciate over much shorter periods.
This is why hardware efficiency and utilization are so important. A GPU that remains heavily used throughout its economic life can generate strong returns even if it becomes technologically outdated. A lightly used GPU can destroy value quickly because depreciation and obsolescence continue regardless of demand.
How the Quarter Changes the Valuation Discussion Without Settling It
Microsoft’s earnings report affects valuation through both the numerator and the denominator of investor models. Stronger Azure growth, Copilot adoption and guidance increase expected future revenue and profit. Higher CapEx, lease commitments and margin pressure increase the capital required to produce those profits and can reduce near-term free cash flow.
A traditional price-to-earnings multiple may overstate the immediate improvement if GAAP earnings include investment gains and do not yet reflect the full depreciation of newly installed infrastructure. A free-cash-flow multiple may make the business look more expensive during the construction phase because current spending is deducted before all future revenue arrives. Neither measure is useless; each captures a different part of the cycle.
Scenario analysis is more informative than a single target. In a favorable scenario, Azure remains above 40% growth, Copilot becomes a large recurring software business, cloud margin stabilizes and free cash flow rebounds as capacity utilization rises. In that case, current spending creates a durable platform with strong strategic and financial returns.
In a middle scenario, Azure grows strongly but margin remains below Microsoft’s historical software level. The business still creates substantial value, although investors may assign a lower multiple because more cash must be reinvested continuously. Microsoft would look increasingly like a hybrid of a software company and a capital-intensive utility for digital intelligence.
In an unfavorable scenario, capacity additions outpace durable demand, customers optimize usage, Copilot renewals disappoint and competition pushes down prices. Depreciation, leases and replacement spending would then weigh on cash flow long after the initial enthusiasm fades.
The June results increased the probability of the favorable and middle scenarios because customer demand is stronger and broader than expected. They did not eliminate the unfavorable scenario because the contractual and physical investment base is also larger than previously appreciated. This is why the stock reaction can be rationally positive while a cautious long-term analysis remains appropriate.
Why Microsoft Shares Rose After the Earnings Report
Microsoft shares rose more than 8% in extended trading after the July 29 release. The Associated Press reported an after-hours price of approximately $426.03, up about 9%, compared with a regular-session close near $390.54. Extended-hours prices can change rapidly and are not equivalent to an official closing price, but the scale of the move showed that the results materially exceeded prevailing expectations.
The market reaction appears to have reflected five factors.
First, Azure growth beat expectations. The difference between 43% actual growth and an estimate near 40% was meaningful because investors had questioned whether capacity limitations and competition would prevent acceleration.
Second, the forward outlook was stronger than expected. Microsoft projected about 45% constant-currency Azure growth for the September quarter and total revenue between $89.85 billion and $90.95 billion. Reuters reported that the midpoint of $90.4 billion exceeded the then-current consensus estimate.
Third, Copilot adoption provided a tangible application-layer metric. The increase from 20 million to more than 30 million paid seats showed faster commercial distribution than analysts had expected.
Fourth, backlog growth reduced concern about empty capacity. The $678 billion RPO balance and management’s statement that the sequential increase came from customers outside frontier-model companies suggested that demand was broadening.
Fifth, management projected continued positive free cash flow. Although free cash flow fell during the quarter, the company’s confidence that it could remain positive while spending more than $50 billion in the September quarter reassured investors about financing capacity.
The share-price response does not prove that the quarter resolved Microsoft’s valuation questions. Markets react to the difference between results and expectations, not to an objective verdict on long-term value. A strong after-hours move can fade or expand during subsequent regular trading as analysts update models and investors examine the earnings call. The appropriate conclusion is narrower: Microsoft delivered better cloud growth, adoption and guidance than the market had priced immediately before the report.
Microsoft’s Fiscal 2027 Outlook Raises the Bar
Microsoft’s guidance implies that the company expects momentum to continue despite difficult comparisons and continued capacity constraints. For the September quarter, management forecast:
- Total revenue of $89.85 billion to $90.95 billion.
- Productivity and Business Processes revenue of $36.7 billion to $37.0 billion.
- Intelligent Cloud revenue of $40.95 billion to $41.25 billion.
- More Personal Computing revenue of $12.2 billion to $12.7 billion.
- Azure growth of approximately 45% in constant currency.
- Capital expenditure above $50 billion.
For the full fiscal year, Microsoft said capital expenditure would increase and operating margin would decline by less than one percentage point. The company also expected to remain free-cash-flow positive.
The guidance creates a demanding combination. Microsoft must add capacity rapidly enough to support Azure growth near 45%, while limiting the effect of depreciation, energy, hardware and staffing costs on operating margin. It must also demonstrate that application revenue from Copilot and other AI products becomes large enough to improve the return on infrastructure.
The September quarter will be particularly important because CapEx above $50 billion would set another record. A continued Azure acceleration would support the argument that Microsoft is investing into demand. Any unexpected slowdown would renew concern that spending has moved ahead of monetization.
The Most Important Risks to Watch
1. Infrastructure Execution
Microsoft’s plans depend on timely access to power, land, chips, networking equipment and construction capacity. Delays can prevent the company from recognizing revenue even when customer demand is available. Rapid deployment also increases the risk of cost overruns and inefficient asset utilization.
2. Hardware Obsolescence
About two-thirds of quarterly CapEx was allocated to shorter-lived equipment. AI accelerators improve quickly, and future models may require different memory, networking or precision characteristics. Microsoft must keep current hardware busy enough to earn a return before newer systems reduce its relative efficiency.
3. Margin Compression
Cloud gross margin has already declined. If inference costs remain high or price competition intensifies, Azure and Copilot growth may produce less incremental profit than investors expect. Microsoft can offset pressure through efficiency, custom chips and premium applications, but those gains are not guaranteed.
4. Customer Concentration and Circular Economics
OpenAI and other model developers can sign exceptionally large cloud contracts. When a cloud provider is also an investor, the economic relationships deserve careful analysis. Microsoft’s ex-OpenAI backlog growth is encouraging, but continued disclosure will be necessary to evaluate concentration.
5. Copilot Renewal and Usage
Paid seats are an adoption metric, not a final measure of customer value. Enterprises may reduce licenses after pilot periods if employees do not use the product or if productivity gains are difficult to quantify. Microsoft needs strong renewal, expansion and engagement data over multiple years.
6. Competition and Multi-Cloud Purchasing
AWS, Google Cloud, Oracle and specialized providers are investing aggressively. Customers may distribute workloads among providers for resilience, bargaining power or access to different models. Multi-cloud adoption can limit Microsoft’s ability to convert every Copilot or Azure relationship into exclusive infrastructure demand.
7. Dependence on External Model Providers
Microsoft’s diversification reduces but does not remove dependence on OpenAI and Anthropic. Disputes over pricing, access, governance or product competition could affect Microsoft’s AI roadmap. In-house models must become competitive enough to provide credible alternatives.
8. Cybersecurity, Data Governance and Reliability
Enterprise AI systems can expose sensitive data, produce inaccurate outputs or take unintended actions. Microsoft’s reputation and commercial relationships make security failures particularly costly. The expansion from assistants to autonomous agents raises the importance of identity, permissioning, monitoring and auditability.
9. Regulatory and Antitrust Scrutiny
Regulators may examine Microsoft’s investments in model developers, cloud contracting practices and bundling of Copilot with established software products. New AI rules can increase compliance costs or restrict how data and models are used across jurisdictions.
10. Energy and Environmental Constraints
Data centers consume substantial electricity and water. Grid limitations can delay projects, while energy costs can affect margins. Microsoft has climate commitments that may become more difficult to achieve as AI capacity expands. Communities and regulators may also resist projects that strain local infrastructure.
11. Workforce and Organizational Complexity
Microsoft is simultaneously expanding infrastructure, integrating multiple model providers, developing custom chips and restructuring parts of its organization. Execution across these programs requires specialized engineering and operational talent. Cost control can become harder when capital projects and product priorities change rapidly.
12. Economic Sensitivity
Cloud and productivity software are recurring businesses, but they are not immune to economic weakness. Enterprises can optimize cloud consumption, delay migrations, reduce seats or negotiate harder during downturns. Large AI contracts may be particularly vulnerable if customers struggle to demonstrate near-term returns.
What Would Confirm That Microsoft’s AI Spending Is Paying Off?
No single quarterly metric can answer the question. A more persuasive case would emerge if several trends develop together over the next four to eight quarters.
- Azure growth remains above 40% after additional capacity becomes available and comparisons become harder.
- Microsoft Cloud gross margin stabilizes as efficiency gains offset the cost of AI infrastructure and usage.
- Free cash flow returns to growth even while the company continues investing at an elevated level.
- Copilot paid seats continue to expand and Microsoft begins disclosing revenue, renewals or other evidence of durable monetization.
- Commercial backlog remains diversified outside OpenAI and other frontier-model developers.
- Capacity constraints ease without utilization falling, showing that new facilities can be filled rapidly.
- Operating margin declines remain limited and eventually reverse as depreciation and inference costs are absorbed.
- Custom chips and model routing produce measurable cost reductions rather than remaining strategic promises.
The most important combination would be sustained Azure growth, stable cloud margins and improving free cash flow. That would show not only that customers want Microsoft’s AI services, but that Microsoft can serve the demand efficiently enough to create increasing economic value.
What Could Weaken the Investment Case?
The argument would weaken if Azure slows materially after the current capacity wave, Copilot seat growth stalls, cloud margins continue falling and free cash flow remains depressed. A widening gap between contracted backlog and recognized revenue would also raise questions about consumption timing and contract quality.
Investors should pay particular attention to any change in management language around supply constraints. When demand exceeds supply, slower growth can be explained by insufficient capacity. As capacity expands, Microsoft will have less room to use that explanation. The company will need to show that customers continue consuming at high rates once more infrastructure is available.
A second warning sign would be an increasing reliance on investment gains or accounting presentation changes to support headline results. Microsoft’s core operating performance was strong in the June quarter, so there is no basis for that accusation today. Continued transparent reconciliation between operating results, investments, leases and cash flow will nevertheless be essential.
A Brief Timeline of Microsoft’s Current AI Investment Cycle
- Fiscal 2025: Microsoft disclosed that Azure annual revenue exceeded $75 billion and accelerated spending on data centers and AI hardware.
- September 2025 quarter: Azure growth remained near 40% as demand continued to exceed available capacity.
- November 18, 2025: Microsoft, Nvidia and Anthropic announced strategic partnerships. Microsoft committed to invest up to $5 billion in Anthropic, while Anthropic committed to substantial Azure consumption.
- December 2025 quarter: Commercial RPO rose sharply as large AI and cloud commitments expanded.
- March 2026 quarter: Azure grew 40%, Microsoft 365 Copilot reached 20 million paid seats and management discussed a calendar-2026 CapEx outlook near $190 billion.
- July 2, 2026: Microsoft announced the Frontier Company initiative, including a planned $2.5 billion investment to help enterprises deploy AI systems and agents.
- July 29, 2026: Microsoft reported fiscal fourth-quarter revenue of $90.0 billion, Azure growth of 43%, more than 30 million Copilot paid seats and $678 billion of RPO.
- Fiscal 2027: Microsoft will extend the useful life of data centers and office buildings from 15 to 25 years, changing the classification of some leases and lowering reported CapEx relative to the prior presentation.
- September 2026 quarter: Management expects Azure growth of approximately 45% in constant currency and capital expenditure above $50 billion.
Frequently Asked Questions
How much revenue did Microsoft report in fiscal Q4 2026?
Microsoft reported $90.0 billion of revenue for the quarter ended June 30, 2026, an increase of 18% from a year earlier. The Associated Press reported that analysts had expected approximately $87.62 billion.
How fast did Microsoft Azure grow?
Azure and other cloud-services revenue grew 43% year over year in the fiscal fourth quarter. Microsoft said the rate was the fastest reported quarterly growth since early 2022 and guided to approximately 45% constant-currency growth for the following quarter.
How large is Azure now?
Microsoft disclosed that Azure generated more than $100 billion of revenue during fiscal 2026. The company does not report Azure’s quarterly revenue or stand-alone operating income.
Why did Microsoft stock rise after earnings?
Shares rose more than 8% in extended trading after Azure growth, total revenue, earnings, Copilot paid seats and forward guidance exceeded expectations. The move also reflected relief that strong customer demand was absorbing Microsoft’s rapidly expanding infrastructure.
How many Microsoft 365 Copilot paid seats are there?
Microsoft said Microsoft 365 Copilot had more than 30 million paid seats at June 30, 2026, compared with 20 million three months earlier. The company did not disclose product revenue or average revenue per seat.
Did Microsoft reduce its AI spending plan?
Not in the straightforward sense suggested by the lower headline. Microsoft’s reported calendar-2026 CapEx estimate moved to approximately $175 billion, but management said the underlying investment expectations were essentially unchanged. The difference largely reflects a change in lease classification after Microsoft extended estimated useful lives for data centers and office buildings.
How much did Microsoft spend on capital expenditure in the quarter?
Microsoft reported approximately $41 billion of quarterly capital expenditure, including $35.8 billion of cash additions to property and equipment and about $5.6 billion of finance leases.
Why did Microsoft’s free cash flow fall?
Operating cash flow increased to $55.4 billion, but additions to property and equipment nearly doubled. As a result, free cash flow declined 23% to $19.6 billion.
What is Microsoft’s commercial backlog?
Commercial remaining performance obligations reached $678 billion. The balance represents contracted revenue not yet recognized. Its weighted average duration was 2.3 years, and Microsoft expected to recognize approximately 30% during the next 12 months.
How dependent is Microsoft on OpenAI?
OpenAI remains an important customer, model provider and strategic partner. Microsoft is reducing concentration risk by offering Anthropic, in-house and open-weight models and by developing custom chips. Management said ex-OpenAI RPO grew 25% and the sequential backlog increase came from customers outside frontier-model companies.
Is Microsoft Cloud becoming less profitable?
Microsoft Cloud gross margin fell to 65% from 68% a year earlier, primarily because of sales mix, infrastructure investment and AI usage. Microsoft remains highly profitable overall, but stabilizing cloud margin is a key test of the AI strategy.
What should investors watch in Microsoft’s next earnings report?
The most important measures will be Azure growth relative to the approximately 45% guidance, cloud gross margin, free cash flow, CapEx above $50 billion, Copilot seat expansion, backlog composition and any additional disclosure about AI revenue or efficiency.
Final Assessment
Microsoft’s fiscal 2026 fourth quarter materially changed the AI spending debate. Before the report, the company’s infrastructure commitments were easier to measure than the commercial payoff. After the report, the payoff is more visible: Azure grew 43% from a base exceeding $100 billion annually, Copilot paid seats passed 30 million, Microsoft Cloud revenue reached $59.3 billion and commercial backlog climbed to $678 billion.
The results support management’s argument that enterprise demand is absorbing new capacity. They also show that Microsoft’s distribution strategy is working across two levels of the market. Azure sells the infrastructure and model access; Copilot sells AI inside software employees already use. Backlog growth outside frontier-model companies suggests the opportunity is spreading beyond a small group of heavily financed AI laboratories.
The strongest concern is no longer whether AI demand exists. It is whether Microsoft can preserve the economic quality that made its software franchise exceptional. Quarterly free cash flow fell, cloud gross margin declined and future lease commitments reached $329.1 billion. The lower-looking CapEx forecast did not represent a comparable reduction in underlying investment. Microsoft is committing to a physical infrastructure base that will require high utilization and continued reinvestment.
The June quarter deserves to be viewed as an important positive data point rather than a final verdict. Microsoft has shown that revenue can accelerate while it builds. It has not yet shown that margins and free cash flow can fully absorb the buildout over a complete investment cycle. The next stage of the story will be decided by execution: bringing capacity online, filling it quickly, reducing cost per AI task and converting Copilot deployments into renewals and higher-value enterprise workflows.
For readers evaluating Microsoft’s business rather than a single after-hours stock move, three measures matter most from here: sustained Azure growth, stabilization in Microsoft Cloud gross margin and a return to free-cash-flow growth. If those arrive together, fiscal Q4 2026 may be remembered as the quarter Microsoft began proving that its AI infrastructure was earning its cost. If they do not, the same quarter may instead mark the point at which strong demand failed to resolve the return problem.
This article is provided for general informational purposes and does not constitute financial, investment, tax, or legal advice.
Sources
- Microsoft fiscal 2026 fourth-quarter earnings release and financial statements
- Microsoft fiscal 2026 fourth-quarter performance metrics
- Microsoft fiscal 2026 fourth-quarter earnings call
- Reuters: Microsoft says cash will keep flowing from AI, shares rise
- Associated Press: Microsoft beats Wall Street expectations with $90 billion in revenue
- Synergy Research Group: Q1 2026 cloud infrastructure market analysis
- Alphabet second-quarter 2026 earnings release filed with the SEC
- Amazon first-quarter 2026 results
- Microsoft, Nvidia and Anthropic strategic partnership announcement
- Microsoft Frontier Company announcement
- Microsoft fiscal 2022 third-quarter earnings release
- Microsoft fiscal 2022 fourth-quarter earnings release
- Early Impacts of M365 Copilot, field experiment research paper
- AI in the Enterprise: How People Use M365 Copilot Chat
Affiliate disclosure: Businessfinance.news may earn compensation from qualifying actions completed through selected links on this website, at no additional cost to the reader. Affiliate relationships do not influence our editorial reporting, analysis, or conclusions.