Last updated July 30, 2026, at approximately 11:45 a.m. EDT. Market prices and policy expectations can change rapidly.
The Federal Reserve did not raise interest rates on July 29. Yet the market response looked nothing like a conventional relief rally. Shorter-dated Treasury yields edged lower, the 30-year yield surged to levels not seen since 2007, the dollar weakened, and investors began debating whether Chairman Kevin Warsh’s forceful language on inflation was being matched by a sufficiently forceful policy reaction. At the same time, renewed U.S.-Iran strikes kept an oil-supply risk premium alive, while Microsoft and Meta produced opposite market verdicts on the economics of artificial intelligence spending.
Those developments may appear to belong to separate stories: a central-bank meeting, a Middle East conflict, and a busy technology earnings season. In reality, they converged around one question. How much inflation, borrowing and capital spending can the financial system absorb before long-term interest rates become the binding constraint on growth and valuations?
The early answer is that the bond market was not simply pricing another quarter-point Federal Reserve increase. It was demanding more compensation for holding long-dated debt in an environment where inflation remains above target, oil is exposed to geopolitical disruption, Treasury issuance remains substantial, and the artificial-intelligence investment boom is consuming enormous quantities of equipment, power, construction capacity and financing. The sharp steepening of the yield curve therefore mattered more than the unchanged policy rate itself.
This feature examines what the Federal Reserve actually decided, what the Treasury curve was signaling, why a long-bond selloff can become a credibility problem, how the Iran conflict complicates inflation policy, why Microsoft was rewarded while Meta was punished, and what the post-meeting economic data changed. It also separates confirmed facts from market interpretation and explains what households, business owners and investors should watch before the next Federal Reserve decision.
Key takeaways
- The Federal Open Market Committee held its target range at 3.5% to 3.75% in a 9–3 vote. Beth Hammack, Neel Kashkari and Lorie Logan preferred a quarter-point increase.
- The most revealing market move was the divergence across maturities: the two-year yield slipped while the 10-year and 30-year yields rose. That pattern suggested uncertainty about near-term Fed action alongside rising concern about longer-run inflation, supply and credibility.
- The 30-year Treasury yield reached 5.2444% intraday on July 30, its highest level since mid-2007, according to Reuters market data.
- June inflation slowed on a year-over-year basis, but headline PCE inflation remained 3.7% and core PCE inflation 3.3%, both above the Fed’s 2% objective.
- Second-quarter real GDP increased at a 1.5% annual rate, but real final sales to private domestic purchasers rose 3.9%, showing stronger underlying private demand than the headline suggested.
- Brent crude briefly traded above $93 before easing below $90 as markets weighed renewed U.S.-Iran strikes against possible diplomacy over the Strait of Hormuz.
- Microsoft gave investors evidence that AI infrastructure is generating cloud revenue and backlog. Meta reported strong advertising growth, but its costs, capital spending and sharply lower free cash flow made the payback period harder to evaluate.
- Samsung’s rounded public divisional figures imply a semiconductor operating-profit increase of roughly 223 times, not exactly 250 times. The popular “250-fold” headline is best treated as an approximation based on unrounded data.
The Federal Reserve held rates, but the curve delivered the verdict
The Federal Open Market Committee left the federal-funds target range unchanged at 3.5% to 3.75% after its July 28–29 meeting. The official statement described economic activity as expanding at a solid pace, noted that productivity and capital investment had been strong, and said inflation remained elevated. Three of the 12 voting members dissented in favor of a quarter-percentage-point increase. That was a meaningful split, especially because the dissents came from officials who represented different parts of the Federal Reserve System rather than a single institutional bloc.
The decision itself was not a surprise. A hold had been widely expected after the Federal Reserve had already maintained its range through several meetings. The surprise was the combination of a divided committee, an intentionally restrained policy statement and a press conference in which Warsh defended the decision without offering the kind of explicit forward guidance that markets became accustomed to under previous chairs.
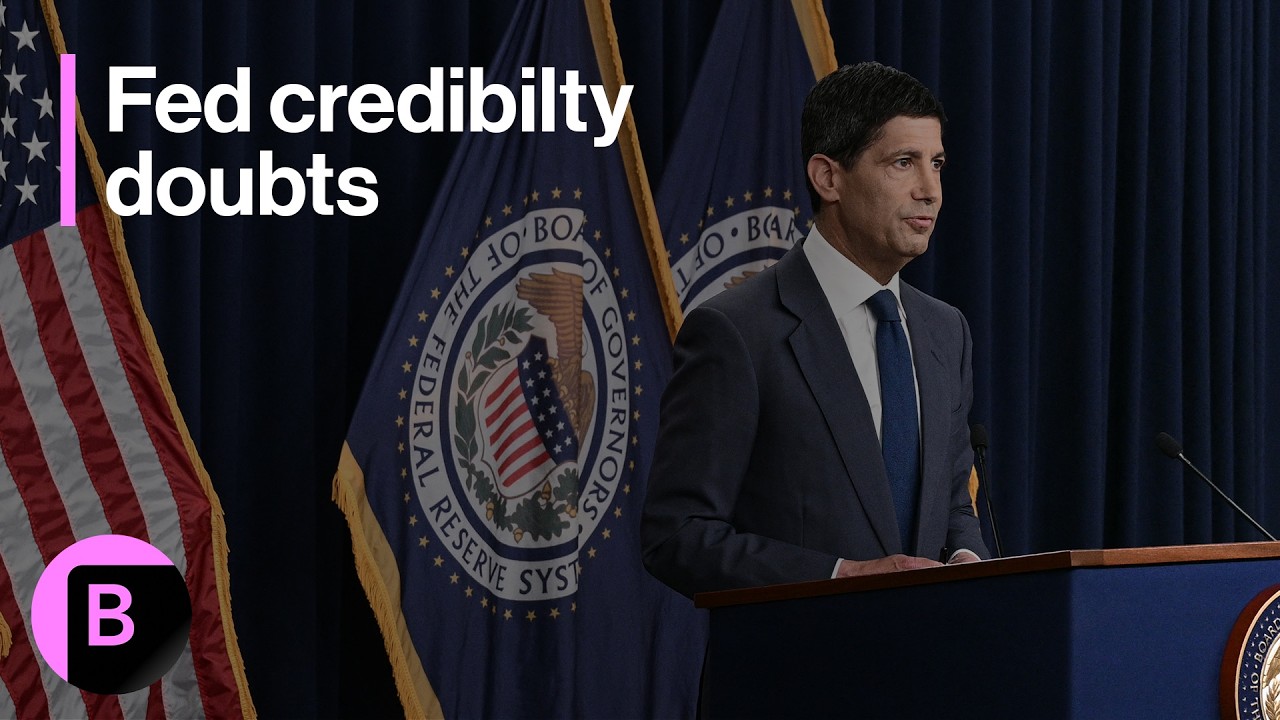
Warsh emphasized that the Federal Reserve had no informal or “soft” inflation objective above 2%. He also said interest rates could be part of the solution if inflation remained elevated. But he resisted committing to a September move and argued that financial markets had already tightened conditions through higher nominal and real yields. That distinction is defensible in theory: monetary policy works partly through market rates, and a central bank does not need to mechanically validate every movement in the bond market. In practice, however, the message created a circular problem. If the market was lifting long-term yields because it doubted the central bank’s reaction function, citing those same yields as evidence that policy was tightening did not necessarily reassure investors.
The Treasury curve captured that tension. Reuters reported that the two-year yield fell to about 4.223% on July 30, while the 10-year yield climbed to about 4.667% and the 30-year yield briefly reached 5.2444%. The two-year maturity is especially sensitive to expectations for the policy rate over the next several years. The 30-year yield is influenced by those expectations too, but it also embeds a much larger premium for inflation uncertainty, fiscal supply, duration risk and the possibility that investors will be repaid in dollars with less purchasing power.
When short yields fall and long yields rise after a central-bank decision, the market is not sending one simple message. It may be lowering the probability of an immediate increase while raising the compensation demanded for long-run risk. That is why the post-meeting move was more troubling than a uniform rise across all maturities would have been. A parallel upward shift could have meant that investors expected tighter policy. A steepening led by the long end suggested that investors were less certain about the central bank’s willingness or ability to contain inflation without allowing longer-term financing costs to rise.
What a bear steepener means in plain English
The yield curve is a map of interest rates across different Treasury maturities. It is commonly summarized by comparing the two-year and 10-year yields, but the 30-year bond adds useful information because its price is extremely sensitive to changes in long-run inflation and real-rate assumptions. A “steepening” occurs when the gap between longer and shorter yields widens. A “bear steepener” usually describes a steepening caused mainly by long yields rising, which means long-duration bond prices are falling.
The July reaction had elements of that pattern. Investors did not simply conclude that every interest rate should rise by the same amount. Instead, they appeared to distinguish between the probable path of the policy rate and the risk of owning long-term debt. That distinction matters for the entire economy.
| Rate or maturity | What it mainly reflects | Why it matters |
|---|---|---|
| Federal-funds rate | The overnight policy range set by the Federal Reserve | Influences money-market rates, bank funding and expectations for the wider curve |
| Two-year Treasury | Expected policy rates over the next few years, plus a smaller term premium | A close market gauge of anticipated near-term Fed policy |
| 10-year Treasury | Expected short rates, long-run real growth, inflation and term premium | Benchmark for mortgages, corporate debt, valuations and global capital markets |
| 30-year Treasury | Very long-run inflation, fiscal supply and duration risk | Highly sensitive to credibility and the compensation investors demand for locking up capital |
A Treasury yield can be thought of as two broad components. The first is the average short-term interest rate investors expect over the life of the bond. The second is the term premium, or the extra compensation demanded for uncertainty and price volatility over a long holding period. The Federal Reserve Bank of New York publishes model estimates of term premiums, but those estimates are not directly observed and can vary with methodology. The useful concept is more important than any single model reading: a long yield can rise even when traders reduce their forecast for the next policy move.
That is exactly why a steepening curve can transmit tighter conditions without a formal rate increase. Mortgage rates are linked more closely to longer-term Treasury yields and mortgage-backed-security spreads than to the overnight policy rate. Corporate bond coupons depend on Treasury benchmarks plus credit spreads. Equity valuations discount future cash flows using market rates, not merely the federal-funds target. State and local borrowing, infrastructure finance, commercial real estate and leveraged buyouts all respond to the price of duration.
In other words, the central bank can hold its benchmark steady while the economy experiences a new tightening impulse. The uncomfortable question is whether that impulse reflects confidence that growth is strong or distrust that inflation will be controlled. The answer can vary by day and by asset, but the post-meeting pattern made the second interpretation difficult to dismiss.
Why the move looked like a credibility warning
Central-bank credibility is not a personality contest, and it cannot be measured by whether bond traders approve of every decision. It is the degree to which households, businesses and markets believe policymakers will ultimately deliver their stated objective. A credible inflation-targeting central bank can sometimes look through a temporary price shock because people expect inflation to return to target. A less credible institution may need to act more aggressively because the same shock is more likely to alter wages, prices and long-term expectations.
The July meeting exposed three credibility risks. First, inflation had remained above 2% for years, making repeated assurances less powerful than they would be after a long period of price stability. Second, Warsh had cultivated a hawkish reputation and spoke forcefully about the importance of the target, but he voted with the majority to hold. Third, his preference for limited forward guidance left investors with less information about what would trigger action.
None of those facts proves that the decision was wrong. A central bank should not increase rates merely to satisfy a reputation. Policy must respond to the outlook, not to the chair’s prior image. Yet a gap between rhetoric and the perceived reaction function can raise the term premium. Investors may demand a larger buffer if they cannot tell whether the central bank will respond to another month of elevated inflation, a sustained oil shock, a rise in inflation expectations or a further steepening of the curve.
Reuters quoted TD Securities economist Oscar Munoz arguing that Warsh’s reluctance to provide forward guidance was hurting credibility because the market appeared to be doing part of the Fed’s work without a clear promise of policy follow-through. That was an analyst interpretation, not an established fact. Still, it captured the market’s concern: the Federal Reserve was relying on financial conditions that might themselves reflect doubt about the Federal Reserve.
A stronger credibility signal could come in several forms. The committee could specify the data pattern that would justify an increase, clarify how it interprets supply-driven inflation, show greater internal consensus, or explain why it is comfortable with the real policy rate at current levels. Warsh could also use future speeches to distinguish between a temporary rise in oil and a generalized inflation process. The goal would not be to pre-commit to a mechanical move. It would be to reduce the range of plausible reaction functions that investors must price.
The strongest case for the Fed’s decision
A fair analysis must take the Federal Reserve’s case seriously. There were credible reasons to hold rates on July 29 even with inflation above target and three dissents.
The first reason is that monetary policy was already restrictive. The target range of 3.5% to 3.75% stood above many estimates of a neutral rate, and real interest rates remained positive using several inflation measures. Long-term yields had risen substantially before the meeting, tightening mortgage, corporate and government financing conditions. Because policy operates with lags, a central bank that reacts to every market move risks overtightening after financial conditions have already changed.
The second reason is that the latest inflation impulse had a significant energy and geopolitical component. Interest-rate increases cannot reopen a shipping lane, restore refinery capacity or negotiate a ceasefire. Raising rates against a temporary oil shock can damage demand without producing more energy. The correct response depends on whether the shock broadens into wages, services inflation and expectations.
The third reason is uncertainty about the real economy. Headline second-quarter GDP growth slowed to 1.5% at an annual rate. Although private domestic demand was stronger than that headline, the economy was not clearly overheating across every dimension. Manufacturing structures declined, government spending fell and trade flows distorted the aggregate. Waiting for additional labor-market and inflation data reduced the risk of reacting to an advance GDP estimate that will be revised.
The fourth reason is that a divided committee can still produce a coherent hold if members agree that the threshold for immediate action has not been crossed. Dissents reveal disagreement, but they also demonstrate that the committee is actively debating the issue rather than suppressing alternative views. Warsh described the discussion as a vigorous internal argument. Transparency about disagreement can support credibility if subsequent communications explain the competing frameworks.
The fifth reason is that capital investment may improve supply over time. The Federal Reserve statement highlighted productivity and capital spending, and Warsh drew attention to rapid growth in high-technology equipment and software. AI data centers, semiconductors, automation and energy infrastructure can raise demand in the near term, but successful investment could also expand productive capacity, improve efficiency and lower unit costs. Tightening too aggressively before those supply benefits appear could interrupt an investment cycle that ultimately helps contain inflation.
Those arguments make a hold defensible. They do not make it costless. The challenge is that waiting requires the public to believe the Federal Reserve will act if evidence of persistence strengthens. The bond market’s reaction suggested that this conditional promise was not yet fully trusted.
The strongest skeptical case
The skeptical argument begins with the level and duration of inflation. The Federal Reserve’s preferred PCE price index was still rising 3.7% from a year earlier in June, while the core measure was up 3.3%. Those rates were lower than the previous month but remained far above 2%. The second-quarter price index for gross domestic purchases increased at a 5.7% annual rate, and the quarterly PCE price index rose at a 5.1% annual rate. The mix of annual, monthly and quarterly measures is important, but none supported a declaration of victory.
From that perspective, a quarter-point increase would have reinforced the target when oil risk, resilient private demand and investment spending were all potentially adding pressure. The three dissenters may have judged that the cost of acting slightly too early was lower than the cost of allowing expectations to drift. Because policy remained only moderately restrictive relative to current inflation, they may also have believed that an increase would not constitute an extreme tightening.
The skeptical case also focuses on communication. Warsh’s approach appears designed to reduce the false precision of dot plots and repeated guidance. That can be healthy. Central banks do not know the future, and overly specific guidance can encourage leverage or make policymakers reluctant to change course. But reducing guidance while the committee is split and inflation is high transfers uncertainty to the term premium. The market charges for ambiguity.
A third concern is the idea that higher bond yields can substitute for a policy decision. Market tightening is not always stable. If yields rise because investors expect the Federal Reserve to act, then failing to act could reverse the tightening. If yields rise because investors fear inflation or fiscal deterioration, the higher rates may persist but damage credibility and debt sustainability. In neither case should the central bank assume that the market has solved the policy problem for it.
A fourth concern is distribution. Long rates impose costs unevenly. They affect first-time homebuyers, small businesses, commercial-property refinancing and the federal budget more directly than large cash-rich corporations. Relying on the long end to restrain demand can therefore produce a less targeted form of tightening than a transparent policy-rate path. That does not mean the Fed controls the entire curve, but it does mean that a credibility-driven increase has real consequences.
The skeptical conclusion is not that the Federal Reserve had to raise rates in July. It is that the burden of proof now shifts to the central bank. If inflation remains elevated, oil stays high and private demand remains firm, another hold would require a clearer explanation. A central bank can be patient, but it cannot be vague indefinitely.
What the data released after the broadcast changed
The July 30 economic releases made the policy debate more complicated rather than resolving it. The Bureau of Economic Analysis reported that real GDP increased at a 1.5% annual rate in the second quarter, down from 2.1% in the first quarter. A reader looking only at that headline could conclude that the economy had slowed enough to justify patience.
But the details showed more momentum. Real final sales to private domestic purchasers, which combine consumer spending and gross private fixed investment, increased at a 3.9% annual rate after rising 1.7% in the first quarter. This measure strips out inventories, exports, imports and government purchases, offering a clearer view of private domestic demand. Consumer spending accelerated, while investment in equipment and intellectual-property products increased. Information-processing equipment, software and research and development contributed, reinforcing the theme that AI and technology investment were supporting demand.
The inflation details were also mixed. The June personal-income-and-outlays report showed headline PCE prices falling 0.1% from May while rising 3.7% over 12 months. Core PCE prices, excluding food and energy, increased 0.1% for the month and 3.3% from a year earlier. The monthly readings suggested cooling, but the year-over-year rates remained elevated. Personal income rose 0.2%, nominal consumer spending increased 0.3%, real spending rose 0.4%, and the personal saving rate was 2.7%.
The quarterly GDP price measures looked hotter because they capture a different period and are annualized. The PCE price index increased at a 5.1% annual rate in the second quarter, while core PCE increased at a 3.4% rate. These numbers should not be directly compared with the June 12-month readings as though they were the same statistic. They answer different questions. The quarterly rates describe the pace of change from one quarter to the next; the annual rates compare June with June.
The post-meeting data in one view
Growth: Real GDP rose at a 1.5% annual rate in the second quarter, but private domestic final demand rose 3.9%.
Inflation: June headline PCE inflation slowed to 3.7% year over year, while core PCE slowed to 3.3%. Both remained above target.
Consumption: Real consumer spending increased 0.4% in June, indicating that households were still supporting activity.
Investment: Equipment, software and research spending helped growth, consistent with the AI-capex cycle.
Policy implication: The data supported neither a simple recession narrative nor a simple overheating narrative. They strengthened the case for conditional policy while increasing the need for clear conditions.
For the Federal Reserve, the combination is awkward: slower headline GDP, stronger private demand, cooling monthly inflation and still-high annual inflation. A policymaker who emphasizes lags and monthly progress can defend a hold. A policymaker who emphasizes target credibility and domestic demand can defend an increase. That is why the three dissents were economically intelligible rather than symbolic.
For the bond market, the report offered little reason to remove the long-run risk premium. Business investment remained robust, price levels were still rising too quickly, and the saving rate left households with limited buffer against another energy shock. At the same time, the report did not guarantee rapid short-term hikes. That combination was consistent with the curve’s message: uncertainty at the front end and pressure at the long end.
Iran, Hormuz and the inflation channel
The Middle East escalation turned a difficult monetary-policy problem into a multidimensional one. U.S. Central Command said that at 10 p.m. Eastern time on July 29 it completed a heavy wave of strikes against dozens of Islamic Revolutionary Guard Corps targets, including command centers, missile and drone facilities, coastal surveillance sites and maritime capabilities. CENTCOM described the action as a response to attempted Iranian missile attacks on U.S. forces and said the missiles had been intercepted. Those are official U.S. military claims and should be identified as such; they do not independently resolve competing accounts of battlefield damage or intent.
Reuters reported that Jordan said it intercepted five missiles from Iran, Saudi Arabia struck Iran-linked targets in Iraq, and the conflict was opening additional fronts. Shipping risk extended beyond the Strait of Hormuz as drone attacks and threats affected routes connected to the Red Sea and Suez Canal. The precise military trajectory remained uncertain, but the economic transmission mechanism was visible: higher insurance costs, delayed voyages, rerouting, tighter tanker availability and a larger risk premium in oil and liquefied natural gas.
Brent crude reached an intraday high of $93.31 on July 30 before falling to about $89.32 by 1:24 p.m. GMT, according to Reuters. West Texas Intermediate reached $85.94 before easing to about $83.32. Prices moved lower as traders weighed possible Oman-Iran talks over the Strait of Hormuz, demonstrating how quickly geopolitical risk can be repriced. A lower afternoon quote did not mean the threat had disappeared. It meant the probability distribution had changed.
The Strait of Hormuz normally carries roughly one-fifth of global oil and liquefied-natural-gas flows. That figure does not imply that one-fifth of supply would vanish in every disruption. Some cargoes could be delayed, rerouted or released from inventories. Producers and governments could respond. But even partial interference can create a large price reaction because short-run energy demand is relatively inelastic and spare logistical capacity is limited.
Oil affects inflation through several channels. The direct channel is visible in gasoline, diesel, jet fuel, heating and utility costs. The indirect channel runs through freight, plastics, chemicals, agriculture and the cost of operating energy-intensive facilities. The expectations channel matters when businesses raise prices preemptively or workers seek higher wages to preserve purchasing power. The financial channel appears when bond investors demand more inflation compensation. Central banks worry most when a temporary commodity shock begins moving through all four channels.
The Federal Reserve cannot produce oil, but it can influence whether an oil shock becomes generalized inflation. That is why credibility matters so much during geopolitical crises. If the public believes the central bank will protect the purchasing power of money, one-time price increases are less likely to become a wage-price process. If that belief weakens, the same barrel of oil creates a larger policy problem.
What is confirmed, what is reported and what remains uncertain
| Issue | Evidence status | Responsible interpretation |
|---|---|---|
| U.S. strikes on July 29 | Confirmed by a public CENTCOM release | The targets and purpose described by CENTCOM are official U.S. claims |
| Jordanian missile interceptions | Reported by Reuters citing Jordanian authorities | Attribute to Jordan rather than presenting independent battlefield verification |
| Hormuz reopening or de-escalation | Possible talks and market speculation | Not a completed agreement; oil prices can reverse quickly |
| Long-bond selloff caused by Fed credibility | Market interpretation supported by curve behavior and analyst commentary | Credibility was one factor, not a uniquely proven cause; oil, supply and growth also mattered |
| September rate increase | A market-implied probability, not a decision | Futures pricing can change with every data release and headline |
This distinction is essential in a fast-moving conflict. Financial markets convert uncertain reports into prices before all facts are known. That does not make the prices irrational; it means they represent probability-weighted expectations rather than final truth. A responsible market analysis should therefore use precise attribution and avoid treating an intraday oil move as proof of either escalation or peace.
Why oil shocks are asymmetric for central banks
An oil-price increase slows growth and raises inflation at the same time. That combination is more difficult for central banks than a demand boom, because the usual policy tool works mainly by reducing demand. Raising rates can limit second-round inflation, but it can also deepen the growth damage. Holding rates can protect activity, but it may allow expectations to rise. The trade-off is asymmetric because the consequences of a credibility mistake can persist longer than the initial energy shock.
The first policy question is duration. A brief spike that reverses within weeks has a different economic effect from six months of elevated crude. The second is breadth. Policymakers watch whether price increases stay concentrated in energy or spread into services and wages. The third is expectations. Market-based inflation compensation, consumer surveys and business pricing plans can reveal whether people expect the shock to persist. The fourth is labor-market balance. In a tight labor market, workers may have more power to seek compensation for higher living costs; in a softer market, the second-round effect may be smaller.
The fifth question is fiscal response. Governments may cut fuel taxes, subsidize bills or release strategic reserves. Those measures can reduce immediate consumer pain, but they may support demand or shift costs to public borrowing. If investors already worry about Treasury supply, an expensive fiscal offset can lower measured inflation temporarily while raising the term premium. Monetary and fiscal policy are therefore linked through the bond market even when the central bank remains institutionally independent.
The sixth question is the dollar. Oil is generally priced in dollars, and a weaker dollar can amplify the U.S. inflation effect at the margin while easing financial pressure elsewhere. The dollar index fell about 0.8% on July 30 in Reuters market data. Currency moves reflect many forces, but the combination of a weaker dollar and higher long yields reinforced the impression that the market was repricing U.S. policy credibility rather than simply anticipating aggressive tightening.
The appropriate central-bank response is consequently conditional. A temporary oil shock with anchored expectations may justify patience. A persistent shock accompanied by rising service inflation, wage growth and long-term inflation compensation may require action. The Federal Reserve’s problem after July was not that it lacked this framework. It was that investors wanted greater clarity about where the thresholds lay.
A global central-bank problem, not only an American one
The Federal Reserve was not the only central bank confronting the collision between an energy shock and uncertain domestic inflation. On July 30, the Bank of England kept Bank Rate at 3.75% by a 6–3 vote. Megan Greene, Catherine Mann and Huw Pill preferred an increase to 4%. The decision closely resembled the Federal Reserve’s in one important respect: a majority chose to wait while a significant minority judged that inflation risk required immediate action.
The Bank of England said U.K. consumer-price inflation was 2.6% and was expected to rise because of energy costs. It also noted limited evidence of second-round effects and a labor market with more slack than before. Those conditions supported patience. Yet the three dissenters underscored how quickly renewed conflict could change the balance. Britain is especially sensitive to imported energy and currency moves, while its mortgage market reprices more frequently than the long fixed-rate U.S. market. A higher Bank Rate therefore reaches household cash flow relatively quickly.
The comparison with the Federal Reserve is useful because it shows that “hold versus hike” was not simply a judgment on one chair. Central banks across advanced economies were trying to separate temporary imported inflation from persistent domestic inflation. They were also trying to avoid increasing rates into a geopolitical slowdown while demonstrating that an inflation target remained binding.
Europe’s growth data added another layer. Eurostat’s preliminary estimate showed second-quarter GDP increasing 0.4% from the first quarter in the euro area and 0.5% in the European Union. Compared with a year earlier, output grew 1.0% and 1.2%, respectively. Spain expanded 0.7% quarter over quarter, while Germany, France and Italy each grew 0.2%. The estimates were preliminary and subject to revision, but they suggested that Europe had not entered a broad contraction before the latest oil shock.
That modest resilience gives European central banks less room to dismiss inflation on growth grounds, yet Europe’s greater exposure to imported energy makes aggressive tightening more dangerous. The result is a policy landscape in which central banks may move at different times while facing the same source of uncertainty. A prolonged rise in oil could push headline inflation higher everywhere, but the correct response would depend on wage formation, fiscal policy, currency effects and the strength of domestic demand in each economy.
For global bond investors, these differences affect relative value. Long U.S. yields can rise because of U.S. credibility or fiscal concerns, while gilts and euro-area debt respond to their own inflation and supply dynamics. Capital can move among markets, influencing currencies and term premiums. The July episode therefore cannot be understood by looking at the Federal Reserve in isolation. The U.S. long bond is part of a global competition for savings at a time when governments, energy systems and technology companies are all demanding capital.
AI capital expenditure moved from a technology story to a macro story
The artificial-intelligence investment cycle was once discussed mainly through semiconductor sales and software demonstrations. By mid-2026 it had become a macroeconomic force. Data centers require advanced chips, networking equipment, cooling systems, backup generation, grid connections, land, construction labor and vast quantities of electricity. The spending supports growth and productivity, but it also competes for resources and financing.
Warsh highlighted that AI-related investment in high-technology equipment and software had been growing at close to a 20% four-quarter rate. The second-quarter GDP report independently showed increases in information-processing equipment, software and research and development. These facts help explain why the Federal Reserve included capital investment and productivity in its statement. The AI boom was no longer a narrow equity-market theme; it was affecting aggregate demand, imports, business investment and the prospective supply capacity of the economy.
The inflation effect is not one-directional. During the buildout, demand for scarce components, electricity, skilled labor and construction can raise prices. Data-center concentration may require expensive transmission upgrades and new generation. Companies can borrow to finance facilities, adding demand in credit markets. Governments may subsidize projects or accelerate infrastructure spending. All of this can increase nominal activity before the productivity benefits are realized.
Over time, successful AI adoption could lower costs, improve logistics, automate routine work, accelerate research and allow companies to produce more with the same labor and capital. That would be disinflationary on the supply side. The difficulty for policymakers is timing. The investment is observable now; the productivity payoff is uncertain, uneven and delayed. A central bank cannot assume that every dollar of AI capex will become productive capacity, but it also should not suppress an investment cycle merely because it is temporarily resource-intensive.
The July earnings reports provided a live test of this distinction. Microsoft showed investors a business model in which infrastructure spending was tied to cloud revenue, contracted backlog and capacity-constrained demand. Meta showed a highly profitable advertising engine investing at extraordinary scale, but with a less direct external revenue channel for its infrastructure. Samsung showed how the hardware supply chain could turn scarcity and memory demand into a dramatic profit recovery. The market rewarded or punished each company according to the perceived visibility of returns, not according to a blanket judgment that AI spending was good or bad.
Microsoft gave investors evidence of monetization
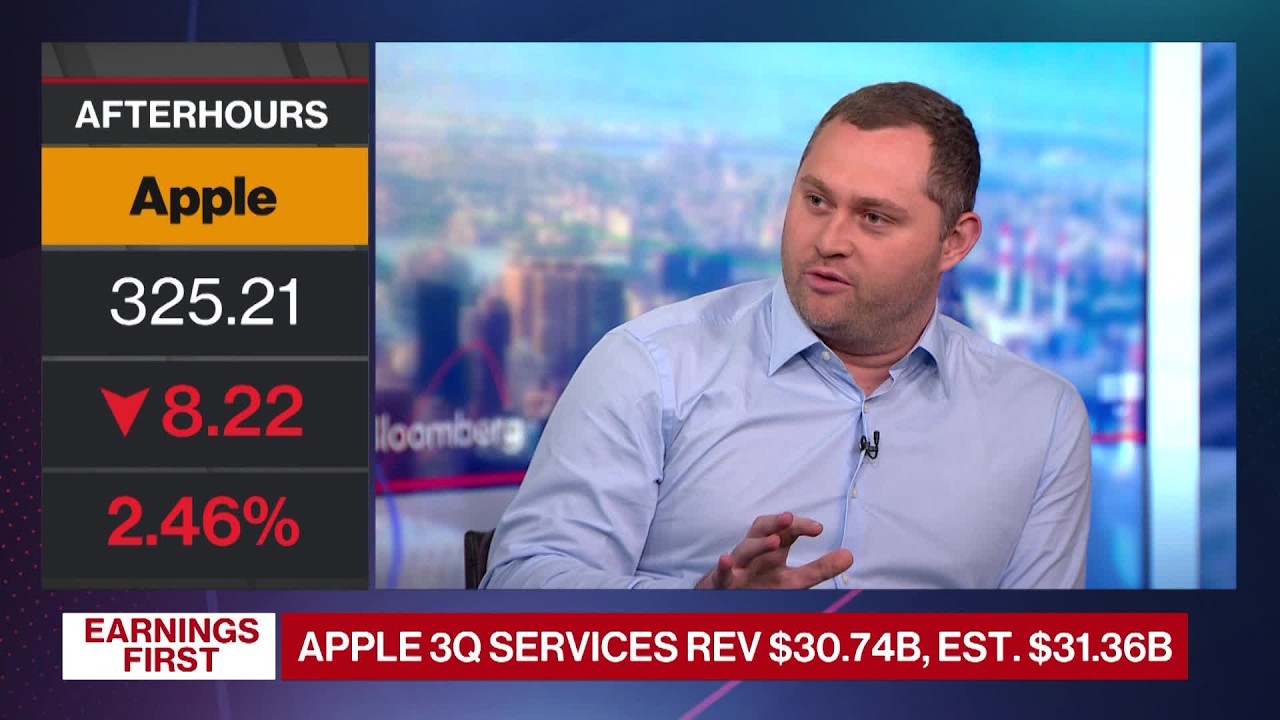
Microsoft’s fiscal 2026 results offered the clearest proof that large AI-related capital investment can support measurable revenue. The company said annual revenue exceeded $331 billion, up 18%, while Microsoft Cloud revenue surpassed $214 billion, up 27%. Azure revenue exceeded $100 billion for the year and grew 41%. In the fourth quarter, Microsoft Cloud revenue reached $59.3 billion, also up 27%, while Azure and other cloud-services revenue increased 43%.
The quality of that growth mattered as much as the percentage. Microsoft said demand continued to exceed available capacity. Commercial remaining performance obligations, a measure of contracted revenue not yet recognized, reached $678 billion, up 84%. That figure included the effect of a large OpenAI-related contract; excluding OpenAI, Microsoft said the increase was 25%. Roughly 30% of commercial RPO was expected to be recognized as revenue during the next 12 months. Investors therefore had a backlog against which to compare future infrastructure spending.
Microsoft also had multiple monetization channels. Azure sells computing and AI services to enterprises and developers. Microsoft 365 Copilot generates per-seat subscription revenue. GitHub Copilot, security tools, data platforms and industry applications can convert AI capabilities into existing commercial relationships. The company said paid commercial Copilot seats exceeded 30 million. This does not prove that every product will deliver attractive margins, but it demonstrates that customers are paying for services linked to the infrastructure.
There were still trade-offs. Microsoft Cloud gross margin was 65%, down from the prior year as the mix shifted and AI infrastructure costs increased. Rapid depreciation, energy costs and the need to build ahead of demand can pressure margins even when revenue is strong. Remaining performance obligations are not cash and do not guarantee flawless execution. A large customer concentration can make backlog less diversified. Capacity constraints can also delay revenue that would otherwise be recognized.
Nevertheless, the earnings reduced one central fear: that capital spending was expanding without a visible commercial engine. Reuters reported that Microsoft’s shares rose about 14% on July 30 after the company exceeded sales and cloud expectations and gave a capital-spending outlook below some Wall Street estimates. The move should not be interpreted as a permanent valuation judgment, but it showed how strongly the market valued evidence that AI investment was translating into demand, contracts and cash-generation potential.
Microsoft’s experience also helps explain why an AI boom can be positive for equities while placing upward pressure on bond yields. The company can generate more revenue and profit because the economy is investing heavily. At the same time, that investment raises demand for capital and real resources. A productive boom can therefore increase both expected corporate cash flows and the equilibrium real interest rate. The equity and bond signals are not necessarily contradictory.
Meta’s quarter exposed the cost and timing problem
Meta’s second-quarter report was not weak in the conventional sense. Revenue increased 28% from a year earlier to $60.801 billion. Family daily active people averaged 3.60 billion, up 3%. Ad impressions rose 14%, while the average price per ad increased 12%. The advertising engine remained powerful, and the company said AI was improving recommendations and advertiser performance.
The concern was the relationship between that growth and the cost base. Total costs and expenses increased 55% to $42.026 billion. Operating income fell 8% to $18.775 billion, and the operating margin narrowed to 31% from 43%. Net income declined 14% to $15.848 billion, while diluted earnings per share fell 13% to $6.18. The quarter included $2.40 billion of legal-proceeding charges and $1.18 billion of severance expenses, so the statutory decline was not solely the result of AI investment. Still, the cost trajectory made the spending debate unavoidable.
Capital expenditures, including principal payments on finance leases, were $31.08 billion for the quarter. Meta narrowed its full-year 2026 capex guidance to $130 billion to $145 billion from a previous range of $125 billion to $145 billion, raising the lower bound. It forecast full-year expenses of $165 billion to $169 billion and third-quarter revenue of $61 billion to $64 billion. Free cash flow was only $784 million despite operating cash flow of $31.86 billion, demonstrating how capital intensity can consume cash even when the underlying business remains profitable.
Meta’s challenge is not that it lacks monetization. Its recommendation systems and advertising tools can use AI to improve engagement and conversion, and those improvements can be economically valuable. The challenge is observability. Microsoft can identify Azure growth, cloud contracts and paid software seats. Meta’s infrastructure supports a broad consumer ecosystem, making it harder for outside investors to isolate how much incremental revenue comes from a particular AI investment.
The company is also building future products, including personal agents and new experiences, whose revenue may arrive later. That can be rational strategy. Large platforms often invest before markets are obvious. But the longer the payback period and the less specific the revenue bridge, the larger the discount investors apply. Meta’s past spending on augmented and virtual reality made shareholders especially sensitive to another open-ended investment cycle.
Reuters reported that Meta’s shares fell more than 9% on July 30. The decline did not mean investors rejected AI or Meta’s core business. It indicated that the burden of proof had risen. Revenue growth alone was not enough to offset a 55% increase in expenses, lower operating profit, a collapse in quarterly free cash flow and a capex range reaching $145 billion.
A balanced interpretation also recognizes the legal and restructuring charges. Removing them mechanically would improve the comparison, but it would not eliminate the strategic question. Legal exposure is part of the company’s economic risk, severance reflects management decisions, and capital expenditure affects cash regardless of whether analysts describe it as temporary. The most useful measure is therefore not a single adjusted earnings number. It is the trajectory of revenue, operating margin, free cash flow and the disclosed milestones that connect infrastructure to future products.
Samsung’s “250-fold” chip-profit headline needs context
Samsung Electronics reported extraordinary second-quarter results in its Device Solutions division, which includes semiconductors. The company said divisional revenue was 127.5 trillion Korean won and operating profit was 89.2 trillion won. In the comparable quarter of 2025, Samsung’s official release showed Device Solutions operating profit of 0.4 trillion won.
Dividing the rounded 2026 figure by the rounded 2025 figure produces an increase of about 223 times. Bloomberg’s program and several headlines described the increase as roughly 250-fold. That may reflect unrounded internal or consensus figures, and the 2025 denominator was so small that rounding materially changes the multiple. The responsible conclusion is not that the headline was false. It is that “250-fold” should be treated as an approximation rather than a precise ratio derived from the rounded public table.
The more important economic point is the base effect. A very small prior-year profit makes a recovery appear enormous in percentage or multiple terms. The 2025 quarter was depressed by weakness in parts of the memory market and competitive pressure in advanced high-bandwidth memory. By 2026, AI-related memory demand, improved product mix and better semiconductor conditions had transformed the earnings base. The multiple describes the speed of recovery but does not by itself show normalized profitability.
Samsung’s consolidated second-quarter revenue was 171.5 trillion won, up 28% from the first quarter, and operating profit was 89.5 trillion won. The closeness of divisional and consolidated operating profit shows how dominant the semiconductor recovery was. It also illustrates the operational leverage in memory. When prices and utilization improve, incremental revenue can produce a disproportionate increase in profit. The opposite is true during downturns.
The initial share reaction was volatile rather than uniformly positive. That is consistent with a market already expecting strong AI-memory results and asking whether Samsung can sustain its gains against SK Hynix and other competitors. Investors must evaluate product qualification, customer concentration, capital spending, memory pricing and the durability of demand. A record quarter can still disappoint if expectations are even higher.
Samsung also demonstrates why the AI buildout has an inflation dimension. Semiconductor fabrication requires highly specialized equipment, materials, electricity and years of planning. High-bandwidth-memory supply cannot be expanded instantly. When cloud companies race to secure capacity, prices and profits can rise before new fabs and packaging lines come online. That scarcity supports suppliers but increases the cost of the infrastructure being built by Microsoft, Meta and their peers.
| Company | Key verified result | What investors rewarded or questioned | Main risk |
|---|---|---|---|
| Microsoft | Azure and cloud-services revenue grew 43%; commercial RPO reached $678 billion | Visible revenue, contracted backlog and multiple paid AI channels | Margin pressure, depreciation, customer concentration and execution |
| Meta | Revenue rose 28%, but expenses rose 55% and free cash flow was $784 million | Strong ads business but a less transparent link between infrastructure and new revenue | Open-ended capex, legal exposure, lower margins and delayed payback |
| Samsung | Device Solutions operating profit reached 89.2 trillion won from a rounded 0.4 trillion won a year earlier | A dramatic semiconductor recovery tied to AI-memory demand | Memory cyclicality, competition and expectations already embedded in the share price |
Why the same AI boom can lift stocks and bond yields
Financial commentary often treats a higher stock market and higher bond yields as opposing signals. In an investment boom, they can coexist. If companies discover profitable projects, expected earnings rise and equities may gain. At the same time, businesses demand more financing, the economy’s expected growth rate improves and investors require a higher real return to allocate scarce capital. Long-term yields can rise even without an increase in expected inflation.
The difficulty in July was separating that benign growth effect from an adverse inflation or credibility effect. Microsoft’s results supported the productive-investment interpretation. Strong cloud demand, backlog and software adoption implied that infrastructure was serving paying customers. The GDP report showed equipment and intellectual-property investment contributing to growth. If those projects increase future output, a portion of the yield rise could reflect a higher equilibrium real rate rather than a policy failure.
But oil, fiscal supply and the curve’s reaction to the Federal Reserve made the benign explanation incomplete. The 30-year yield rose while the two-year yield fell, and the dollar weakened. That pattern was not the clean signature of stronger real growth alone. It suggested that investors were also demanding protection against uncertainty about inflation and policy.
The distinction matters for valuation. A company can grow earnings quickly and still lose value if the discount rate rises faster. Long-duration technology stocks are especially sensitive because a large share of their estimated value comes from cash flows many years in the future. Microsoft’s earnings surprise was strong enough to overcome the rate headwind on July 30. Meta’s was not. Companies without visible AI revenue may find that higher long rates shorten the market’s patience for experimentation.
The macro feedback can become self-reinforcing. Higher yields raise the hurdle rate for data centers and power projects. Projects with uncertain returns may be delayed, reducing demand for chips and construction. Strong projects continue, concentrating market share among firms with the best balance sheets. That can improve capital discipline, but it can also reduce competition. The ultimate productivity payoff may therefore depend not only on the technology but on the financing environment created by the bond market.
What higher long-term yields mean for households
The 30-year Treasury yield is not the rate a household directly pays, but it is part of the financial architecture behind household borrowing. The average U.S. 30-year fixed mortgage rate was already 6.55% in Freddie Mac’s July 16 survey. Mortgage rates reflect expectations for short-term rates, Treasury yields, mortgage-backed-security spreads, prepayment risk and lender conditions. A rise in long Treasury yields therefore creates upward pressure, even though the relationship is not one-for-one.
For prospective homebuyers, the monthly-payment effect is nonlinear. A higher rate reduces the mortgage balance a household can support at a fixed payment. Sellers may respond by cutting prices, but housing supply, local demand and existing owners’ reluctance to give up lower-rate mortgages can slow that adjustment. The result can be lower transaction volume rather than an immediate nationwide price decline.
Existing homeowners with fixed-rate mortgages are insulated from direct repricing, but they can still be affected through home-equity loans, refinancing options and property-market liquidity. Renters may face indirect effects if landlords refinance at higher rates or new apartment construction becomes less economic. Commercial-property stress can affect local tax bases, banks and employment even when a household has no direct exposure.
Consumer credit is more closely linked to shorter rates, but a credibility-driven long-rate increase can still matter. Auto financing, personal loans and securitization costs respond to the broader curve and credit spreads. If lenders become more cautious, approval standards can tighten independently of the Federal Reserve’s target range.
Energy adds another pressure point. A household paying more for gasoline and utilities has less discretionary income. If borrowing costs rise at the same time, the household may cut spending more sharply. This is the stagflationary transmission of the Iran conflict: an external supply shock reduces purchasing power while the bond market tightens financial conditions.
The saving rate of 2.7% in June suggested that the aggregate household buffer was not especially large. Aggregate statistics conceal major differences—some households hold substantial liquid assets while others live paycheck to paycheck—but a low saving rate increases sensitivity to an energy-price shock. Consumer resilience can persist for months, yet the marginal response may change quickly if employment softens or credit becomes less available.
What higher long-term yields mean for businesses
Large technology companies with substantial cash can fund much of their investment internally. Small and midsize businesses cannot. They rely on bank loans, revolving credit, equipment finance and private credit, all of which are influenced by benchmark yields and lender risk appetite. A rise in long rates can therefore widen the gap between companies able to participate in the AI buildout and those forced to delay investment.
For a chief financial officer, the relevant metric is the project’s expected return relative to the weighted average cost of capital. When the risk-free rate rises, the required return generally rises. A data-center project with contracted demand may still clear the hurdle. A speculative expansion, office acquisition or low-margin capacity increase may not. This is how the bond market can slow investment without the Federal Reserve formally changing policy.
Refinancing creates a separate risk. Companies that issued low-cost debt during earlier years may face much higher coupons at maturity. The effect depends on the maturity schedule, whether debt is fixed or floating, and the company’s cash generation. A high yield does not create an immediate crisis for a borrower with no near-term maturities. It becomes more consequential as refinancing dates approach.
Profit margins are squeezed through multiple channels when oil and rates rise together. Freight and materials costs increase, interest expense rises, and customers may become more price-sensitive. Companies with pricing power can pass on costs; companies in competitive markets may absorb them. The result can be a wider dispersion in earnings even if aggregate revenue remains healthy.
Banks may benefit from higher long-term yields if the curve steepens and lending margins improve, but the effect is not automatic. Deposit costs, securities losses, credit quality and loan demand all matter. A rapid yield increase can reduce the market value of existing bonds and fixed-rate loans. Banks that have hedged duration effectively may be positioned better than institutions with large unprotected portfolios. The lessons of prior banking stress make investors attentive to the speed of the move, not merely the final level.
Entrepreneurs and venture-backed companies face another consequence. Higher discount rates reduce the present value of distant cash flows and can lower private-company valuations. Investors may demand shorter paths to profitability, stronger unit economics and less dependence on continuous fundraising. The Microsoft-Meta divergence was therefore relevant beyond public megacaps: it was a market-wide signal that capital expenditure needs a measurable revenue bridge.
The fiscal and Treasury-supply layer
Not every basis point of the long-bond selloff can be attributed to the Federal Reserve or oil. Treasury supply and the federal borrowing outlook also influence the term premium. The U.S. Treasury expected to borrow $189 billion in privately held net marketable debt during the April–June 2026 quarter, $79 billion more than previously announced because of lower net cash flows and other changes, while targeting a $900 billion cash balance at quarter-end.
The Treasury Borrowing Advisory Committee and the department’s refunding process also continued to evaluate whether future coupon and floating-rate-note auction sizes would need to increase. The next quarterly refunding announcement was scheduled for August 5. Investors therefore faced the prospect of more duration supply at the same time that inflation and geopolitical uncertainty were increasing the compensation required to hold it.
Supply does not determine yields mechanically. Strong demand from pensions, insurers, banks, foreign reserve managers and households can absorb large issuance. Regulatory rules and liability structures create natural buyers for long bonds. But when the expected supply rises faster than structural demand, prices may need to fall and yields rise to attract marginal buyers.
The fiscal channel also interacts with monetary credibility. A central bank that tightens into heavy government borrowing raises interest expense, which can increase future deficits unless taxes or spending adjust. Investors may then demand an additional premium for fiscal uncertainty. Conversely, if the central bank appears reluctant to tighten because of debt-service costs, investors may worry about fiscal dominance. There was no evidence that the July decision was dictated by the Treasury, but markets price institutional risks before they become explicit.
It is therefore more accurate to describe the 30-year yield as the result of several overlapping forces: expected short rates, real growth, inflation uncertainty, oil risk, fiscal supply, global demand and policy credibility. The Federal Reserve meeting acted as a catalyst because it altered investors’ confidence in how those forces would be managed. It was not the sole cause.
Why the comparison with 2007 is useful—and dangerous
The 30-year yield’s return to levels last seen in mid-2007 invited historical comparison. The comparison is useful because it shows how unusual a yield above 5.2% had become during the long period of low rates after the global financial crisis. It also reminds borrowers that the post-2008 environment was not a permanent law of finance.
But a matching yield does not imply a matching economy. In 2007, the U.S. housing system was approaching a crisis rooted in weak underwriting, complex securitization, leverage and falling home prices. In 2026, the key concerns included persistent inflation, government borrowing, geopolitical energy risk and an investment boom in AI infrastructure. Bank capital, mortgage structures and regulatory arrangements were also different.
The inflation regime differed. The years before the financial crisis were characterized by relatively anchored inflation expectations and a central bank that would soon cut rates as credit stress intensified. In 2026, the Federal Reserve was still trying to return inflation to target after years of overshoot. A high long yield could therefore represent inflation compensation and fiscal risk rather than an expectation of rapid policy easing.
The Treasury market’s composition had changed as well. Greater federal debt, a larger role for electronic and leveraged trading, shifts in foreign demand and post-crisis regulation all affected market depth and price discovery. These structural differences mean that a 5.24% yield can have a different cause and consequence than a similar number in 2007.
The safest conclusion is narrow: long-term borrowing costs had returned to a range not seen for roughly 19 years. That raises the hurdle for investment and increases duration risk. It does not predict a repeat of the financial crisis. Historical analogies become dangerous when a memorable date replaces analysis of balance sheets, underwriting and current economic structure.
Four scenarios that could shape markets before September
The next Federal Reserve decision was scheduled for September 15–16, leaving several weeks in which inflation data, employment reports, oil prices and official speeches could materially change the outlook. Rather than pretending to forecast one outcome, it is more useful to identify the conditions under which different outcomes become plausible.
Scenario one: Oil retreats and inflation continues to cool
In the most benign scenario, diplomacy improves shipping conditions around Hormuz and the Red Sea, Brent crude falls sustainably, and monthly core inflation remains subdued. Employment growth softens without collapsing, while consumer spending slows toward a more sustainable rate. Long-term inflation expectations remain contained.
Under those conditions, the Federal Reserve could hold again while arguing that the energy shock was temporary and that restrictive policy was working. The two-year yield might fall as the expected hiking path is reduced. Long yields could also decline if the term premium falls, producing a broad bond rally rather than the post-July divergence.
The risk to this scenario is that lower oil alone may not be enough. Services inflation, housing costs and wages can remain sticky after commodity prices fall. The Federal Reserve would need evidence that underlying inflation was moving toward 2%, not merely that gasoline had become cheaper.
Scenario two: Oil remains high and inflation expectations rise
If military escalation disrupts shipping or production for an extended period, energy prices could stay elevated. Businesses might pass through transport and input costs, while consumers report higher inflation expectations. The dollar could weaken further, increasing import-price pressure.
This scenario would strengthen the case for a September increase, especially if labor markets and private demand remained resilient. The Federal Reserve might need to demonstrate that it would prevent a supply shock from becoming generalized inflation. The three July dissenters would appear prescient, and additional members could join them.
Long yields might still rise even if the Fed increased rates. A quarter-point move would help credibility only if accompanied by a coherent explanation and a believable path. If markets judged the increase too small or too late, the curve could remain steep. Conversely, a strong communication package could lower long inflation compensation even as the two-year yield rose.
Scenario three: Growth deteriorates faster than inflation
A third scenario is stagflationary weakness. Higher energy and borrowing costs could reduce consumer spending, housing activity and business investment. Credit conditions might tighten, unemployment could rise, and earnings estimates could fall while inflation remained above target.
This would be the hardest environment for the Federal Reserve. Raising rates could deepen the downturn; holding could damage credibility. The committee might focus on whether inflation expectations were anchored and whether the weakness was sufficient to reduce second-round effects. Fiscal policy would become politically important, but broad stimulus could complicate the inflation outlook.
Asset correlations could become unstable. Stocks and bonds might fall together if inflation dominated, or long Treasuries could rally if recession risk became the larger force. Credit spreads would provide an important signal because they measure the additional compensation demanded for corporate default risk.
Scenario four: AI investment keeps demand strong while inflation stays sticky
In the fourth scenario, oil volatility fades but the domestic economy remains firm. AI infrastructure, equipment spending and software investment continue to support growth. Microsoft-like monetization stories encourage companies to maintain capex, while power and construction bottlenecks keep resource demand elevated. Core inflation declines only slowly.
This environment would make a September increase plausible even without a new energy shock. The policy debate would shift from geopolitics to the neutral rate and the balance between current demand and future productivity. Warsh could argue that stronger supply will eventually help, but the committee might still need a higher policy rate to prevent the buildout from overstimulating the economy during its construction phase.
Long yields could remain high for relatively benign reasons if expected real growth and investment returns improved. Yet equities would become more selective. Companies demonstrating revenue and cash flow from AI could outperform, while businesses offering only distant narratives could struggle under a higher discount rate.
The signal dashboard
- Oil duration: Not merely the daily price, but whether Brent remains elevated for weeks and whether physical shipping normalizes.
- Monthly core inflation: A few subdued readings would support patience; renewed acceleration would strengthen the hiking case.
- Inflation expectations: Watch surveys and market compensation for evidence that the shock is becoming embedded.
- Private domestic demand: Real final sales, consumer spending and business investment reveal more than headline GDP alone.
- Yield-curve composition: A rising two-year yield signals a tighter expected Fed path; a rising 30-year yield with a falling two-year rate is a more concerning credibility or term-premium signal.
- Credit spreads: Widening spreads would show that higher risk-free rates are becoming a corporate-financing problem.
- AI cash conversion: Revenue growth, backlog, margins and free cash flow matter more than capex headlines in isolation.
How investors should interpret the bond-market message
The July move was informative, but it was not an instruction to make a particular trade. A single session can be amplified by positioning, liquidity, options hedging and stop-loss activity. Long-duration bonds are volatile, and intraday yields can reverse. Investors should distinguish between a durable change in the macro regime and a temporary overshoot.
The first analytical step is to identify the source of return. A bond’s total return reflects coupon income and price changes. A high starting yield provides more income than the ultra-low yields of earlier years, but a further increase in market yields produces a capital loss. The longer the duration, the greater the sensitivity. A 30-year bond can therefore offer attractive income while still carrying substantial mark-to-market risk.
The second step is to match duration with liabilities and time horizon. An insurer or pension fund may value long bonds because its obligations extend decades. A household saving for a near-term purchase may not be able to tolerate the same volatility. The fact that yields are historically high relative to the post-crisis period does not determine whether a particular maturity is suitable.
The third step is to avoid treating market-implied probabilities as forecasts with certainty. Reuters reported that federal-funds futures priced approximately a 64% probability of a September increase on July 30. That was a snapshot derived from traded contracts, not a promise. The probability could shift sharply with inflation, employment or geopolitical news.
The fourth step is to recognize that nominal and inflation-protected Treasuries answer different questions. Nominal yields include expected inflation and a premium for inflation uncertainty. Treasury Inflation-Protected Securities provide principal adjustment based on the consumer-price index, though their market prices also move with real yields and liquidity. Comparing nominal and inflation-protected yields can help analyze inflation compensation, but the difference is not a pure forecast because it includes risk and technical factors.
The fifth step is diversification. A credibility shock can cause stocks and long bonds to decline together, weakening the traditional assumption that duration will always hedge equity risk. Cash, shorter-duration securities, inflation-linked assets and real assets may behave differently, but each has its own risks. The correct allocation depends on objectives, taxes, liquidity and tolerance for loss, not on one headline.
Businessfinance.news does not provide individualized investment advice. The practical lesson is analytical: understand whether an asset depends on falling inflation, lower rates, strong growth or stable oil. Portfolios become fragile when many holdings rely on the same hidden assumption.
What company executives should learn from Microsoft and Meta
The earnings divergence offered a corporate-finance lesson that extends beyond technology. Capital markets will fund large investment programs when management can explain the economic bridge from spending to revenue, margin and cash flow. The bridge does not need to produce immediate profit, but it must be measurable.
Microsoft’s disclosures gave investors several milestones: Azure growth, capacity constraints, paid Copilot seats, cloud revenue and remaining performance obligations. Those metrics allowed shareholders to test the thesis over time. If capex rises while Azure growth, backlog or margins weaken, the thesis can be revised. If they remain strong, the spending has evidence behind it.
Meta’s disclosures were also extensive, but the bridge was less direct. AI can improve ad ranking, content recommendations and future agents, yet the incremental economics are distributed across the platform. Management can strengthen the case by disclosing adoption, advertiser productivity, engagement improvements, infrastructure utilization and the relationship between model investment and revenue. The goal is not to reveal competitively sensitive information. It is to give investors enough evidence to distinguish disciplined investment from an open-ended technological race.
Chief financial officers outside technology face the same standard. An industrial automation project should identify labor savings, throughput, quality or downtime improvements. A retailer’s data investment should connect to inventory turns, conversion or customer acquisition. An energy project should disclose capacity, contracted pricing and expected returns. In a high-rate environment, narrative alone becomes expensive.
Executives should also stress-test projects against the financing rate rather than assuming the cost of capital will decline. A project that works only with a 4% long-term benchmark may be fragile when the 30-year Treasury is above 5%. Sensitivity analysis should include higher energy costs, slower demand and delayed completion. This is particularly important for data centers, where grid connections and equipment lead times can create substantial execution risk.
Finally, management should distinguish authorized spending from committed spending and committed spending from cash paid. Investors often react to a capex range without understanding lease financing, construction schedules or cancellation rights. Clear disclosure can reduce the uncertainty premium even when the absolute amount remains large.
What policymakers should learn from the market reaction
The first lesson is that concise communication is not automatically clear communication. A shorter statement can eliminate boilerplate, but it can also remove the conditional logic investors use to understand policy. The answer is not to return to mechanically detailed guidance. It is to state the framework: which data matter, how supply shocks are treated and what would cause the committee to change course.
The second lesson is that the yield curve should be interpreted, not celebrated or resisted. Higher long rates can tighten financial conditions, but their cause matters. If they reflect stronger productivity and real growth, they may be compatible with a healthy economy. If they reflect rising inflation uncertainty or fiscal distrust, they are a warning. Policymakers should avoid implying that any market tightening is a substitute for policy.
The third lesson is that dissent can improve accountability when it is explained. Hammack, Kashkari and Logan were expected to describe their reasoning in subsequent communications. Their arguments could clarify the committee’s internal thresholds and help the public understand why reasonable policymakers reached different conclusions. A 9–3 vote is not evidence of institutional failure. Unexplained disagreement would be more problematic.
The fourth lesson is that the 2% target needs operational clarity. Warsh affirmed the target but indicated that policymakers examine multiple inflation measures even though PCE remains the standard reference. That is sensible because no single index captures every pressure. However, the public needs to know how temporary deviations are judged and over what horizon the committee intends to return inflation to 2%.
The fifth lesson is that supply-side optimism should be evidence-based. AI and capital investment may raise productivity, but policymakers should separate observable current demand from projected future supply. Productivity statistics, unit labor costs, capacity utilization and sector-level output can help test whether the investment is easing constraints. Hope is not a policy framework, but neither is ignoring a genuine productivity acceleration.
What would disprove the credibility-shock interpretation?
The credibility explanation is compelling, but it should remain a testable interpretation rather than a permanent label attached to the July move. Several developments could show that the selloff was driven mainly by temporary positioning, stronger real growth or Treasury supply rather than a durable loss of confidence in the Federal Reserve.
First, long yields could retreat while incoming inflation data remain firm and the expected path of the federal-funds rate changes little. That would suggest that technical factors, crowded trades or an exaggerated initial response played a larger role. Treasury auctions with strong demand would support this view by showing that investors were willing to absorb duration without a persistent premium.
Second, market-based inflation compensation could remain stable while real yields account for most of the long-rate increase. A rise in real yields can reflect stronger expected productivity, a higher neutral rate or heavy investment demand. That would still tighten financial conditions, but it would be less damaging to the Federal Reserve’s reputation than a broad rise in expected inflation.
Third, Warsh and other officials could clarify the reaction function without taking immediate action, and the curve could flatten as investors gain confidence in the conditional policy path. Communication can affect rates when it provides genuinely new information. A credible explanation of what would trigger a hike, how oil will be treated and how multiple inflation measures fit the 2% objective could reduce uncertainty without a theatrical policy move.
Fourth, the economy could deliver a productivity acceleration that validates the supply-side argument. If output per hour strengthens, unit labor-cost growth slows and companies show that AI investment is raising capacity, high investment would become less inflationary than feared. Long real rates might remain elevated because growth prospects improved, but inflation risk could decline.
Fifth, fiscal developments could dominate the curve. Larger auction sizes, weaker foreign demand or concerns about future deficits could keep the 30-year yield high even if confidence in monetary policy improves. In that case, the Federal Reserve would still face tighter conditions, but describing the move solely as a judgment on Warsh would be inaccurate.
The opposite evidence would strengthen the credibility interpretation: persistent long-end underperformance after reassuring inflation data, a rise in inflation compensation, a weaker dollar, disappointing Treasury demand and repeated statements that fail to clarify the policy threshold. Good analysis should update as those facts arrive. The July market reaction was a warning signal, not a final verdict carved into the yield curve.
Dates and releases to watch
August 5, 2026: The U.S. Treasury’s quarterly refunding announcement was expected to provide new information about auction sizes and the government’s financing plan. Any increase in long-duration supply could affect the term premium.
August 14, 2026: Eurostat planned to publish a more complete preliminary estimate of second-quarter euro-area and EU GDP. Revisions and country details would help measure Europe’s resilience before the latest energy shock.
August 26, 2026: The Bureau of Economic Analysis scheduled the second estimate of second-quarter U.S. GDP and corporate profits, along with the next personal-income-and-outlays release. Revisions to growth, profits and inflation could materially change the policy debate.
September 15–16, 2026: The next scheduled Federal Reserve meeting. The decision would be informed by additional inflation and labor-market data as well as the duration of the oil shock.
September 17, 2026: The Bank of England’s next scheduled policy decision, one day after the Federal Reserve meeting. The timing could amplify cross-market moves in sterling, gilts, Treasuries and the dollar.
Between those dates, official speeches matter. Markets will listen for whether July’s dissenters emphasize current inflation, expectations or the need for preemptive action. They will also watch whether Warsh clarifies his threshold for using rates as part of the inflation solution.
Frequently asked questions
Why did the 30-year Treasury yield rise when the Federal Reserve held rates?
Long-term yields reflect more than the current federal-funds rate. They incorporate expected future short-term rates, real growth, inflation, Treasury supply and a term premium for uncertainty. After the July meeting, investors appeared to reduce some expectations for immediate tightening while demanding more compensation for long-run inflation and policy risk. Oil and fiscal supply also contributed, so the move cannot be attributed to one cause with certainty.
What does a 9–3 Federal Reserve vote mean?
It means nine voting members supported holding the target range at 3.5% to 3.75%, while three preferred a quarter-point increase. The dissents were from Beth Hammack, Neel Kashkari and Lorie Logan. A split vote reveals meaningful disagreement but does not automatically predict the next decision. Members can change their views as data and risks evolve.
Did Kevin Warsh abandon the 2% inflation target?
No. Warsh explicitly rejected the idea of a softer target and affirmed 2% as the objective. The controversy concerned the speed and tools used to return inflation to that level, not an official change in the target. His comments about examining multiple price measures created questions about communication, but PCE inflation remained the standard reference.
Was the Federal Reserve’s hold dovish?
It had dovish and hawkish elements. Holding instead of raising rates was less restrictive than the three dissenters preferred, and the two-year yield fell. But the committee described inflation as elevated, Warsh said rates could be part of the solution, and three members voted to hike. The long-end selloff showed that markets did not interpret the outcome as a simple easing signal.
Why is the 30-year yield important for mortgage rates?
Mortgage rates are influenced by longer-term Treasury yields, mortgage-backed-security spreads, prepayment risk and lender conditions. They do not track the 30-year Treasury one-for-one, but a sustained rise in long yields generally creates upward pressure on mortgage borrowing costs. Freddie Mac’s survey had already placed the average 30-year fixed mortgage at 6.55% on July 16.
How can higher oil prices affect core inflation?
Core inflation excludes food and energy directly, but energy affects transportation, production, packaging and services. If businesses pass those costs through, or if workers seek higher wages after a loss of purchasing power, the shock can spread into core categories. Central banks focus on whether this second-round transmission becomes persistent.
Why did Microsoft shares rise while Meta shares fell?
Microsoft showed strong Azure growth, contracted backlog, capacity-constrained demand and paid AI products, giving investors a visible path from infrastructure spending to revenue. Meta also reported strong revenue growth, but expenses rose much faster, free cash flow fell to $784 million and the capex range reached $145 billion. The market therefore demanded clearer evidence of the timing and scale of Meta’s returns.
Did Samsung’s semiconductor profit really increase 250-fold?
The description is approximately correct but not exact when using Samsung’s rounded public figures. Device Solutions operating profit was reported at 89.2 trillion won in the second quarter of 2026 and 0.4 trillion won a year earlier. Those rounded numbers imply roughly 223 times. Unrounded figures can produce a different multiple because the prior-year base was extremely small.
Does a yield above 5.2% mean another 2008 financial crisis is coming?
No. It means long-term Treasury borrowing costs reached a range last seen in 2007. The causes and financial structure are different from the pre-2008 period. A high yield can pressure housing, refinancing and valuations, but it is not by itself a crisis forecast. Credit quality, leverage, liquidity and balance-sheet exposures are more important than the calendar comparison.
Will the Federal Reserve raise rates in September?
The answer was uncertain as of July 30. Futures markets assigned a substantial probability to an increase, but that probability was not a commitment. Inflation, employment, oil, financial conditions and the committee’s interpretation of private demand would determine the decision. The July dissents made September a live meeting, not a guaranteed hike.
Can the bond market tighten policy without the Federal Reserve?
Yes, in the sense that higher Treasury, mortgage and corporate yields tighten financial conditions. But the cause and durability matter. Market tightening can reflect expected Fed action, stronger growth, inflation fear or fiscal supply. The central bank cannot outsource its mandate to the bond market, because a credibility-driven rise may create economic damage without anchoring expectations.
Is AI spending inflationary or disinflationary?
It can be both at different stages. Building data centers and semiconductor capacity raises current demand for power, equipment, labor and financing. Successful deployment can later improve productivity and lower unit costs. Policymakers must assess the timing, scale and evidence of the supply payoff rather than assigning AI one permanent inflation label.
Final assessment: the long bond became the main character
The Federal Reserve’s July decision mattered less because the policy rate stayed unchanged than because the market revealed where confidence was weakest. The two-year yield suggested uncertainty about immediate action. The 30-year yield demanded a larger premium for the distant future. That separation turned an ordinary hold into a credibility debate.
Kevin Warsh had a coherent argument. Policy was already restrictive, long yields had tightened conditions, the oil shock was fluid, and AI investment could expand supply. The post-meeting data showed slower headline growth and cooler monthly inflation. A central bank that moved mechanically could overtighten.
The skeptical argument was equally coherent. Inflation remained well above 2%, private domestic demand was strong, the committee was divided, and the long end reacted as though forceful language had not been matched by a sufficiently clear reaction function. Citing market tightening as a reason to wait risked confusing a symptom of doubt with evidence of success.
The Iran conflict increased the stakes because an oil shock tests whether inflation expectations are truly anchored. The technology earnings season increased them again because the AI boom is simultaneously a source of demand, a potential source of productivity and a massive claim on global capital. Microsoft showed what visible monetization looks like. Meta showed why revenue growth does not automatically settle a capex debate. Samsung showed the extraordinary operating leverage—and statistical distortion—that can appear when a cyclical industry rebounds from a depressed base.
The most important conclusion is not that bonds, oil or technology stocks must move in one direction. It is that the financial system was pricing three transitions at once: from forward guidance to a less predictable Federal Reserve, from geopolitical calm to renewed energy risk, and from AI enthusiasm to a demand for cash-flow proof. Long-term yields became the clearing price connecting all three.
Warsh can repair the credibility gap without committing to a predetermined September increase. He must explain the conditions under which patience ends, distinguish productive real-rate pressure from inflation-risk pressure, and show why a 2% target remains operational rather than rhetorical. The committee’s next move will matter. The framework behind that move will matter more.
Sources
- Federal Reserve: July 29, 2026 FOMC statement
- Federal Reserve: Kevin Warsh press-conference transcript, July 29, 2026
- U.S. Treasury: 2026 daily Treasury par yield curve rates
- Reuters: Microsoft rally and 30-year Treasury yield at a 19-year peak
- Reuters: Immediate market reaction to the Federal Reserve decision
- Bureau of Economic Analysis: Second-quarter 2026 GDP advance estimate
- Bureau of Economic Analysis: June 2026 personal income and outlays
- U.S. Central Command: July 29 strikes on IRGC targets
- Reuters: Widening U.S.-Iran conflict and regional attacks
- Reuters: July 30 oil prices, shipping and Hormuz diplomacy
- Bank of England: July 2026 Monetary Policy Summary and minutes
- Eurostat: Preliminary second-quarter 2026 GDP estimate
- Microsoft Investor Relations: Fiscal 2026 fourth-quarter earnings call
- Reuters: Microsoft cloud growth and AI spending
- Meta: Second-quarter 2026 results and outlook
- Reuters: Meta’s AI spending and free-cash-flow challenge
- Samsung Electronics: Second-quarter 2026 results
- Samsung Electronics: Second-quarter 2025 comparison figures
- Federal Reserve Bank of New York: Treasury term-premium estimates and methodology
- U.S. Treasury: April–June 2026 marketable borrowing estimate
- U.S. Treasury: Quarterly refunding and auction-size discussion
- Freddie Mac: Primary Mortgage Market Survey
Affiliate disclosure: Businessfinance.news may earn compensation from qualifying actions completed through selected links on this website, at no additional cost to the reader. Affiliate relationships do not influence our editorial reporting, analysis, or conclusions.