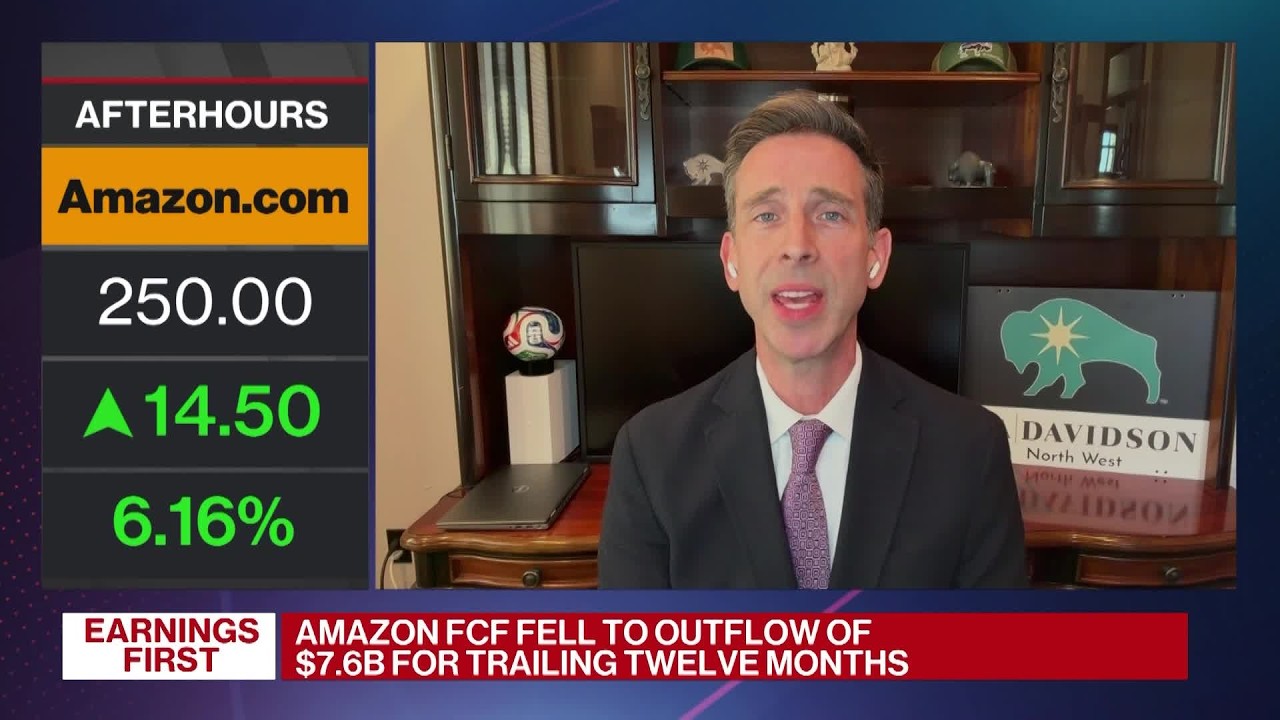
The most important market move after the Federal Reserve’s July 2026 meeting was not the decision itself. The central bank did what most economists expected: it kept the federal-funds target range at 3.50% to 3.75%. The surprise came afterward, when the long end of the U.S. Treasury market delivered a far harsher verdict. The 30-year yield climbed as high as 5.2444%, a level last seen in 2007, while shorter-maturity yields moved in the opposite direction. The result was a sharp steepening of the yield curve and an immediate debate about whether investors had begun charging a larger premium for inflation, fiscal risk, policy uncertainty, or all three.
At almost the same moment, the technology sector produced a different kind of credibility test. Microsoft reported accelerating Azure growth, record cloud scale and strong cash generation despite enormous artificial-intelligence investment. Meta Platforms also reported vigorous revenue growth, but its spending rose much faster, operating margins compressed and quarterly free cash flow nearly disappeared. Investors rewarded Microsoft and punished Meta, creating a revealing split: markets are not rejecting AI capital expenditure in principle, but they are demanding evidence that it is translating into revenue, durable demand and cash returns.
Those two stories—Treasury yields and AI spending—are more closely connected than they first appear. A higher long-term risk-free rate raises the hurdle for every investment, from a data center and a corporate bond to a mortgage and an equity valuation. If the 30-year Treasury yield remains near levels not seen for nearly two decades, the winners will be companies capable of funding growth internally and demonstrating credible returns. The losers will be businesses, households and governments whose plans rely on inexpensive long-duration financing or distant profits that have not yet materialized.
Last updated: July 30, 2026, 11:30 a.m. Eastern Daylight Time. Market prices and yields cited in this article are intraday observations and may have changed after the research cutoff.
Market Fact Box
The July 30 Cross-Asset Snapshot
- The Federal Reserve held the federal-funds target range at 3.50% to 3.75% in a 9–3 vote.
- Beth Hammack, Neel Kashkari and Lorie Logan dissented in favor of a quarter-point increase.
- The 30-year Treasury yield reached 5.2444%, its highest level since 2007, before easing from the peak.
- Microsoft shares were up about 13.9% near 11:17 a.m. EDT after its earnings report; Meta shares were down about 8.3% at roughly the same time.
- June PCE inflation was 3.7% from a year earlier, while core PCE inflation was 3.3%.
Original sources: Federal Reserve policy statement, Reuters global-markets report and Bureau of Economic Analysis inflation report.
The Market Delivered Two Credibility Verdicts at Once
Financial markets often react to the gap between expectations and reality rather than to the headline event itself. That principle helps explain why a widely anticipated Federal Reserve hold produced an unusually violent move in long-term bonds. Investors did not need a surprise rate decision to be surprised. They needed a change in their understanding of the central bank’s reaction function: what conditions would cause officials to tighten, ease or wait.
Before the meeting, Chair Kevin Warsh had cultivated a reputation for taking inflation risks seriously. Market pricing reflected at least some chance that he would either support an immediate increase or send a clear signal that a September move was likely. Instead, the committee held rates, removed much of the forward guidance investors might normally use and delivered a press conference that many participants interpreted as more balanced—and therefore more dovish—than expected. The short end responded by reducing some expectations for near-term tightening. The long end responded by demanding more compensation for uncertainty.
This combination matters. When the two-year yield falls while the 30-year yield rises, the market is not simply saying that all interest rates should be higher. It is distinguishing between the likely path of central-bank policy over the next few meetings and the risks attached to holding nominal government debt for three decades. A lower two-year yield can reflect reduced expectations for immediate rate increases. A higher 30-year yield can simultaneously reflect concern that inflation will prove persistent, that fiscal borrowing will remain heavy, that real economic growth will stay firm, or that the Federal Reserve will tolerate more inflation before acting.
The technology market was making its own distinction. Microsoft and Meta are both spending extraordinary sums on data centers, chips, networking equipment, electricity and talent. Yet their stocks moved in opposite directions because their results answered different questions. Microsoft showed that cloud demand, paid Copilot adoption, backlog and operating leverage were scaling alongside investment. Meta showed excellent advertising demand but a much less settled path from incremental compute spending to incremental cash flow. The issue was not whether AI is strategically important. It was whether management could demonstrate that the next dollar of capital has a measurable economic destination.
These verdicts share a common theme: trust must be earned through observable outcomes. The bond market wanted policy action or clearer conditional guidance, not simply forceful language about a 2% inflation target. Equity investors wanted evidence of monetization, not only statements that future AI agents and infrastructure could become valuable. In both cases, words were discounted when they were not matched by enough current evidence.
Why Stocks Could Rally While the Bond Market Was Alarmed
The simultaneous rise in technology shares and long-term Treasury yields can appear contradictory. Bonds were signaling concern about inflation, fiscal supply or policy uncertainty, while stocks—led by Microsoft—were signaling optimism about earnings. Both reactions can be rational because the two markets price different cash-flow structures and respond to different information.
A Treasury bond promises fixed nominal payments. Stronger nominal growth does not increase those payments. If growth is accompanied by higher inflation or more government borrowing, the bondholder may be worse off. An equity represents a residual claim on a business whose revenue and profit can grow. A company with pricing power or exceptional demand can benefit from the same nominal-growth environment that hurts a fixed-rate bond.
Microsoft’s earnings changed the expected cash-flow numerator in an equity valuation. Investors raised their estimates for Azure demand, Copilot adoption and future cloud revenue. The Treasury selloff changed the discount-rate denominator. On July 30, the positive revision to Microsoft’s expected cash flows was large enough to overwhelm the negative effect of a higher risk-free rate.
That relationship is not stable. If yields continue rising without further earnings upgrades, the valuation headwind becomes more important. A company trading at a high multiple must produce more cash to justify the same price when the alternative safe return increases. The initial Microsoft rally therefore did not make the bond move irrelevant; it showed that company-specific information was temporarily stronger.
Indexes can hide the conflict
A capitalization-weighted stock index can rise because one or two enormous companies rally even when many components decline. Microsoft’s market value was large enough that its move had a substantial effect on the Nasdaq 100 and S&P 500. An index-level gain should not be interpreted as evidence that higher yields were harmless to every company.
Real-estate firms, utilities, small-cap companies and leveraged businesses can respond very differently. Their earnings may be more sensitive to borrowing costs, and they may lack the growth needed to offset a higher discount rate. A narrow rally led by cash-rich technology companies can coexist with deteriorating financing conditions elsewhere.
Nominal growth can support profits and undermine bonds
Companies report revenue and earnings in nominal dollars. Moderate inflation can lift nominal sales, especially when businesses can raise prices faster than costs. Bond coupons remain fixed. This asymmetry helps explain why equities can sometimes tolerate inflation better than long-duration government debt.
The protection is incomplete. Persistent inflation raises wages, input costs and interest expense. It can also provoke tighter monetary policy and weaken demand. The companies most capable of benefiting are those with pricing power, low leverage and high margins. Microsoft fits that profile more closely than the average public company.
The time horizon differs
A quarterly earnings report provides immediate evidence. A 30-year yield reflects risks extending through 2056. The bond market can therefore become more cautious about long-run policy even while equity investors celebrate a current operating surprise. The apparent disagreement may be a difference in horizon rather than a difference in facts.
Over time, the markets must reconnect. Higher long yields affect corporate discount rates, financing costs, housing and government budgets. If those effects slow the economy, earnings expectations will adjust. If productivity and profits grow fast enough, the economy may absorb higher yields without a severe slowdown. The July 30 divergence was the opening of that debate, not its resolution.
Correlations can change across regimes
During periods of low and stable inflation, weak economic data often push both stock prices and bond prices in opposite directions: stocks fall on growth concerns while bonds rise as yields decline. During inflationary periods, both stocks and bonds can fall because higher rates reduce valuations and fixed-income prices simultaneously. On July 30, a powerful company-specific earnings surprise interrupted the macro relationship.
Investors should therefore avoid treating a single day’s correlation as permanent. The relevant question is which force dominates: earnings growth, inflation, real rates, risk appetite or liquidity. Different forces can dominate different hours of the same session.
What the Federal Reserve Actually Decided
The Federal Open Market Committee voted to maintain the target range for the federal-funds rate at 3.50% to 3.75%. The official statement described economic activity as expanding at a solid pace, highlighted strong business investment in technology and capital equipment, and said job gains had been broadly consistent with growth in the labor force. It also acknowledged that inflation remained elevated, partly because of supply shocks that included energy.
The decision was not unanimous. Beth Hammack, Neel Kashkari and Lorie Logan preferred to raise the target range by 25 basis points, or one quarter of a percentage point. Three dissents are significant because they reveal that concern about inflation was not confined to outside commentators or bond traders. A meaningful minority of policymakers believed the available data justified additional restraint immediately.
At the same time, the majority’s choice to wait was defensible on conventional central-banking grounds. Monetary policy affects the economy with uncertain lags. A central bank that changes rates every time one data series moves risks amplifying noise. June data showed slower employment growth and a decline in headline PCE prices from May, even though annual inflation remained too high. Officials also faced conflicting signals: gross domestic product slowed in the second quarter, but private domestic demand was much stronger than the headline growth rate suggested. The committee could plausibly argue that another month of data would clarify whether inflation was reaccelerating or merely reflecting temporary energy and supply pressures.
The problem was therefore not that holding rates was inherently irrational. It was that the market had expected the new chair to define a sharper rule for acting. Warsh’s opening statement emphasized that there was “no soft inflation target” and that the objective remained 2%. He also said the Fed would not waver. Those lines were hawkish. Other remarks, however, emphasized uncertainty, the possibility that higher market yields had already tightened financial conditions, and the need to observe incoming information. Those points were more cautious.
Central-bank communication is especially difficult when officials deliberately reduce forward guidance. The strategy has advantages. It can prevent markets from treating conditional projections as promises and can restore attention to actual data. But less guidance also raises the value of every phrase, pause and qualification. When officials say less, investors may over-interpret the limited information they receive. Warsh’s attempt to make policy less theatrical may therefore have produced the opposite short-term result: a press conference in which each sentence carried more market weight.
The official decision should also be separated from the market’s preferred outcome. Investors are not a democratic veto over monetary policy. A central bank should not raise rates merely because bond traders demand it. Yet the reaction of long-term yields is economically relevant because it changes borrowing costs across the system. If a communication strategy causes mortgage rates, corporate borrowing costs and the government’s interest expense to rise, policymakers must understand that transmission even if they disagree with the market’s interpretation.
Why the 30-Year Yield Rose While the Two-Year Yield Fell
A Treasury yield is often described as a single number, but conceptually it contains several components. Investors consider the expected path of short-term policy rates, expected inflation, the real return they require after inflation, and a term premium for locking money away in a long-duration asset whose price can fluctuate substantially. Supply and demand, hedging flows, regulatory needs and global capital movements also affect the observed yield.
The two-year Treasury is relatively sensitive to the expected federal-funds rate over the next several meetings. The 30-year Treasury is exposed to a much wider set of risks. It must compensate investors for three decades of inflation uncertainty, fiscal issuance, productivity changes, political decisions and shifts in global demand for dollar assets. A central bank can directly control the overnight policy rate; it cannot dictate the 30-year yield.
After the July meeting, the two-year yield moved lower as investors concluded that an immediate follow-up increase was less certain than they had assumed. The 30-year yield moved higher because the meeting did not resolve the longer-term inflation question. This steepening suggested that the market was separating near-term restraint from long-term credibility. The Federal Reserve might not raise soon, but bondholders wanted more compensation in case that patience allowed inflation or fiscal pressures to persist.
One explanation is an inflation-risk premium. Annual core PCE inflation of 3.3% remained well above the Fed’s 2% objective. Headline PCE inflation was 3.7%, reflecting the effect of energy and other supply shocks. A single monthly decline in the price index does not erase a five-year period in which inflation repeatedly exceeded target. If investors believe the central bank will react only after inflation becomes unmistakably worse, they may demand a larger cushion today.
A second explanation is a real-yield or growth premium. The economy’s private demand was more resilient than the 1.5% annualized second-quarter GDP figure suggested. Private domestic final sales increased at a 3.9% rate, indicating healthy underlying demand from consumers and businesses. Strong productivity and capital spending could support higher real growth, which in turn can justify higher real interest rates. In that interpretation, the rise in long yields is not solely a vote of no confidence; it also reflects a stronger economy with more attractive alternatives for capital.
A third explanation is fiscal supply. The Congressional Budget Office projected a federal deficit of roughly $1.9 trillion in fiscal 2026, equal to about 5.8% of GDP. Persistent deficits require substantial Treasury issuance. When supply rises faster than the willingness of investors to absorb it at existing prices, yields must increase. Fiscal risk does not mean the United States is unable to borrow. It means the price required to attract marginal buyers may be higher.
A fourth explanation is term premium. Long-duration bonds are exceptionally sensitive to changes in yield. A modest increase in required yield can produce a large decline in price because so much of the bond’s value comes from payments far in the future. Investors who lived through the inflation and rate volatility of the early 2020s may be less willing to hold that duration without extra compensation. The memory of large mark-to-market losses can change behavior for years.
These explanations can coexist. The market does not publish a single official reason for each move. A 30-year yield above 5.2% may reflect a mixture of sticky inflation, solid real growth, heavy issuance, reduced foreign demand, hedging activity and uncertainty about the new Fed leadership. Treating the entire move as a referendum on one press conference would be too simple. Treating the press conference as irrelevant would also ignore the timing.
Bond-Market Explainer
What a Steeper Yield Curve Can Mean
- Near-term policy: Lower short yields can indicate less confidence in imminent rate increases.
- Long-term inflation: Higher long yields can indicate investors want more protection against persistent price growth.
- Fiscal supply: Heavy government borrowing can require higher yields to attract buyers.
- Real growth: Stronger expected productivity and investment can lift the real rate consistent with economic balance.
- Term premium: Investors may demand more compensation for the price volatility and uncertainty of long-duration bonds.
Original source: Federal Reserve Chair Kevin Warsh’s July 29 opening statement.
Was This a Federal Reserve Credibility Crisis?
The phrase “credibility crisis” is powerful, but it should be used carefully. A central bank loses credibility when the public and markets no longer believe it will achieve its stated objective. One difficult press conference and one sharp bond move do not prove that the Federal Reserve has lost control of inflation expectations. The dollar remained a central global reserve asset, Treasury markets continued to function and inflation expectations had not obviously become unanchored in a way comparable with a true monetary crisis.
What changed was more limited and still important: investors became less certain about how Warsh would translate his stated inflation commitment into action. Credibility has several layers. The first is objective credibility—whether the institution genuinely targets 2% inflation. The second is reaction-function credibility—whether investors understand how the institution will respond when data deviate from that objective. The third is communication credibility—whether words, votes and actions form a coherent message.
Warsh strongly defended objective credibility. His statement left no doubt that the formal target was 2%, not a flexible higher number. The difficulty arose in the other two layers. Three policymakers voted to tighten, inflation was still above target and the chair used forceful language, yet the majority held rates and gave little indication that a September increase was likely. Investors therefore had to infer how much evidence would be required before the Fed acted.
A skeptical reading is that the central bank sounded hawkish but leaned dovish. In that interpretation, officials were willing to acknowledge inflation risks rhetorically while postponing the costly step of raising rates. Bondholders, who are paid fixed nominal dollars, responded by demanding a larger inflation premium. This is the argument behind the idea that “words do not constitute action.”
A more sympathetic reading is that the market entered the meeting with unrealistic expectations. A new chair was never likely to transform a consensus-driven committee into a vehicle for a surprise hike at the first opportunity. The base case among economists was a hold. If traders had priced a significant probability of a dramatic hawkish signal, some reversal was inevitable when that signal did not arrive. Under this interpretation, the market reaction says as much about positioning as it does about policy quality.
Andrew Hollenhorst, Citi’s chief U.S. economist, articulated this more measured view in the Bloomberg discussion. He argued that softer job growth, cooler recent inflation and upcoming measurement changes gave the Fed reasons to wait. He also noted that when a chair says relatively little, investors scrutinize each comment more intensely. The market may have reacted not to a large collection of dovish statements but to a few comments that carried disproportionate weight.
The strongest conclusion is therefore not that Fed credibility disappeared. It is that the cost of ambiguity rose. Warsh’s reduced-forward-guidance approach can work only if the committee’s observable decisions create a reaction function over time. Markets will watch whether the Fed tightens when inflation reaccelerates, remains patient when supply shocks fade, or eases if employment weakens. Credibility will be accumulated through a sequence of decisions, not rescued by one phrase.
The Economic Data Made Both Sides of the Debate Plausible
The Federal Reserve’s dilemma is easier to understand when the latest data are viewed together rather than as isolated headlines. The economy was neither clearly overheating nor clearly slipping into recession. Inflation was neither accelerating uniformly nor returning quickly enough to target. Employment was cooling, but the unemployment rate remained low. That combination creates the conditions for disagreement inside the committee and volatility outside it.
Inflation fell in June—but remained far above target
The Bureau of Economic Analysis reported that the PCE price index declined 0.1% in June from May. That monthly decrease was encouraging, but it was heavily influenced by energy and should not be confused with a broad return to price stability. Compared with June 2025, the headline index was still 3.7% higher. Excluding food and energy, the core PCE index increased 0.1% for the month and 3.3% over the year.
The distinction between monthly and annual readings matters. A favorable one-month number can signal that current pressure is easing, yet the annual rate describes the cumulative change households have experienced over twelve months. The Fed’s objective is a sustained 2% inflation rate, not an occasional monthly decline. Policymakers therefore had reason to welcome the June report without declaring victory.
There was also a methodological complication. Different inflation measures were telling somewhat different stories. Core consumer-price inflation appeared cooler than core PCE inflation, and revisions or measurement changes could reduce the apparent gap later in the year. A central bank should not overreact to a single index if other measures show less pressure. But it must also avoid using measurement uncertainty as an excuse to dismiss an unfavorable signal.
GDP slowed, but underlying private demand stayed strong
Real GDP increased at a 1.5% annualized rate in the second quarter, down from 2.1% in the first quarter. That headline suggested moderation. Yet private domestic final sales—a measure that strips out volatile contributions from inventories, trade and government—grew at a 3.9% rate. The contrast indicated that households and businesses were still spending at a robust pace.
This matters for inflation because demand that grows faster than the economy’s sustainable supply can keep prices and wages under pressure. It also matters for the interpretation of long yields. A 30-year yield above 5% is not necessarily pricing economic disaster. It can reflect an economy capable of generating strong nominal growth and a private sector willing to invest heavily.
The price data within the GDP report were also firm. The gross domestic purchases price index increased at a 5.7% annualized rate during the quarter. The PCE price index rose at a 5.1% annualized quarterly rate, while core PCE prices rose at a 3.4% rate. Quarterly annualized measures can be volatile and should not be placed beside year-over-year figures without explanation, but they reinforced the idea that inflation pressure had not disappeared.
The labor market was cooling rather than collapsing
Nonfarm payroll employment increased by 57,000 in June, and the unemployment rate was 4.2%. Job creation at that pace was much slower than during the post-pandemic expansion and gave the Fed a reason not to tighten reflexively. At the same time, a 4.2% unemployment rate did not indicate a severe labor-market contraction. Officials could reasonably describe the market as balanced or gradually softening.
For monetary policy, the direction matters as much as the level. If payroll growth remains weak and unemployment rises over the next several reports, the employment side of the Fed’s dual mandate will become more prominent. If hiring stabilizes while inflation remains above 3%, the argument for another increase will strengthen. The July decision therefore deferred a judgment rather than settling it.
Household resilience had limits
Personal consumption expenditures increased 0.3% in June and 0.4% after adjusting for prices. That real gain showed that consumers continued to support growth. Yet the personal saving rate was only 2.7%, leaving households with less cushion if employment weakens or borrowing costs rise. Consumption can remain strong for a time even as financial resilience deteriorates beneath the surface.
Higher long-term yields add pressure through mortgage rates, auto financing, credit conditions and asset valuations. The Fed’s policy rate may be unchanged, but the financial environment can tighten without an official move. That is why Warsh’s observation that markets can do some of the Fed’s work was not trivial. The danger is circularity: markets tighten because they expect the Fed to tighten, the Fed waits because markets have tightened, and markets then reverse or reprice when they hear that logic.
Economic Data Fact Box
Why the July Fed Decision Was Genuinely Difficult
- Headline PCE inflation: down 0.1% in June, but up 3.7% from a year earlier.
- Core PCE inflation: up 0.1% in June and 3.3% year over year.
- Real GDP: up at a 1.5% annualized rate in the second quarter.
- Private domestic final sales: up at a 3.9% annualized rate, showing firmer underlying demand.
- June payroll growth: 57,000; unemployment: 4.2%.
Original sources: BEA Personal Income and Outlays, BEA second-quarter GDP estimate and BLS Employment Situation.
Oil and the Iran Conflict Complicated the Inflation Outlook
The Federal Reserve meeting took place against an unusually difficult geopolitical backdrop. Renewed U.S. strikes on Iranian military targets followed attempted attacks on American forces, while the risk to regional shipping and energy infrastructure remained elevated. Brent crude traded above $90 a barrel early on July 30 before easing later as markets weighed the possibility of talks concerning the Strait of Hormuz.
Oil matters to monetary policy through several channels. The most direct is gasoline and household energy costs. Higher fuel prices raise headline inflation and reduce disposable income available for other purchases. The indirect effects can be broader: transportation, aviation, chemicals, plastics, agriculture and manufacturing all use energy as an input. If businesses pass those costs through, a temporary commodity shock can spread into a wider price increase.
Central banks often look through the first-round effect of an oil shock because raising interest rates cannot produce more crude oil. The policy challenge arises when the shock changes wages, pricing behavior or inflation expectations. Workers may seek compensation for higher living costs, and firms may use an energy shock as an opportunity to reset prices. Those second-round effects are more responsive to monetary policy and are more relevant to credibility.
The U.S. economy is less vulnerable to imported-energy shocks than it was in earlier decades because domestic production is much larger. Yet global crude benchmarks still influence refined-product prices, shipping costs and international demand. A prolonged disruption in the Strait of Hormuz would affect far more than U.S. gasoline. It could alter trade balances, weaken energy-importing economies and increase the cost of moving goods worldwide.
The initial July 30 oil rally later reversed partly because markets assigned some probability to negotiation and because physical flows continued. That reversal illustrates why central banks should avoid overreacting to every intraday commodity move. It does not eliminate the risk. The appropriate policy question is not whether Brent is above or below $90 at one moment; it is whether the conflict creates a persistent change in the inflation path.
For the bond market, geopolitical risk can pull yields in opposite directions. A flight to safety normally increases demand for Treasuries and lowers yields. An energy shock can increase expected inflation and push nominal yields higher. Heavy fiscal spending associated with conflict can add another upward force. The fact that long yields rose despite geopolitical uncertainty suggested that inflation and supply concerns were outweighing the traditional safe-haven bid, at least temporarily.
Why a 5%–Plus 30-Year Treasury Yield Matters Beyond Wall Street
The 30-year Treasury yield is not the interest rate most households see on a bank statement, and it is not mechanically identical to a mortgage or corporate borrowing rate. It is nevertheless an important benchmark for long-duration financial decisions. A sustained move above 5% changes the economics of housing, infrastructure, pensions, government finance and equity valuation.
Mortgage rates and housing affordability
U.S. mortgage rates are influenced by the 10-year Treasury, mortgage-backed security spreads, prepayment risk and lender costs rather than by the 30-year Treasury alone. Even so, a selloff across long-dated government bonds generally makes it harder for mortgage rates to decline. Freddie Mac’s latest weekly survey before the July 30 research cutoff showed an average 30-year fixed mortgage rate of 6.58% for the week ending July 23.
At that level, affordability remains constrained even when home prices stop rising. A buyer’s monthly payment is determined by both price and rate. Sellers who locked in much lower mortgages in earlier years also have an incentive not to move, limiting inventory and reducing transaction volume. High long-term yields therefore affect builders, brokers, home-improvement retailers, banks and local tax bases—not only prospective buyers.
Corporate debt and capital budgeting
Companies price bonds at a spread over comparable Treasury yields. If the risk-free benchmark rises, the all-in borrowing rate generally rises unless credit spreads narrow enough to offset it. Investment-grade issuers with strong balance sheets can still borrow, but projects must generate higher expected returns to justify the cost. Lower-rated companies face a greater challenge because both the Treasury benchmark and their credit spread can increase at the same time.
This is especially relevant for capital-intensive sectors such as utilities, telecom, real estate, manufacturing and data centers. The AI buildout requires enormous spending on land, power connections, cooling systems, chips and networks. Companies funding those projects from operating cash flow are less exposed than firms relying heavily on external debt. The bond market’s message therefore feeds directly into the technology sector’s AI-return debate.
Equity valuations
An equity is a claim on future cash flows. Analysts discount those cash flows back to the present using a rate that incorporates the risk-free yield and an equity-risk premium. When long-term Treasury yields rise, distant profits become less valuable in present terms unless earnings expectations increase enough to compensate. This effect is most pronounced for companies whose valuation depends on growth many years into the future.
That does not mean technology stocks must fall whenever yields rise. Microsoft’s July 30 rally demonstrated that an earnings surprise can overwhelm the discount-rate effect. The key is the balance between the numerator and denominator: stronger expected cash flows can offset a higher discount rate. Companies with weak current cash generation and uncertain future monetization have less room for error.
Banks, insurers and pensions
Higher long yields can improve reinvestment income for insurers and pension funds, but the transition can create mark-to-market losses on existing bonds. Banks may benefit from a steeper curve if they can borrow short and lend long at wider margins. Yet they can also face deposit competition, securities losses and credit deterioration among borrowers. The net effect depends on funding structure, asset duration and accounting treatment.
The banking stress of 2023 demonstrated that nominally safe Treasury securities can create severe liquidity problems when institutions hold too much duration and depositors leave. A renewed long-bond selloff does not automatically recreate that episode, but it reinforces the importance of interest-rate risk management.
Federal interest costs
The U.S. Treasury refinances maturing debt continuously. Higher market yields do not immediately reprice the entire debt stock, but they raise the cost of new issuance and gradually increase net interest expense. The CBO projected net federal interest outlays of about $1 trillion in fiscal 2026, rising to roughly $2.1 trillion by 2036 under current law.
This creates a feedback risk. Larger interest costs widen deficits, larger deficits require more borrowing, and more borrowing can place upward pressure on yields. The process is not mechanical because economic growth, tax revenue, inflation and demand for Treasuries also matter. Still, it makes long-term fiscal policy increasingly relevant to monetary conditions.
Why the 2007 Comparison Is Useful—and Potentially Misleading
Saying that the 30-year Treasury yield reached its highest level since 2007 gives readers a historical anchor, but it can also invite the wrong conclusion. The similarity is in the yield level, not in the complete economic environment. A 5.24% long-bond yield can emerge from very different combinations of inflation, real growth, fiscal policy and financial stress.
The Federal Reserve’s historical series shows that the 30-year constant-maturity yield averaged about 5.11% in July 2007. The federal-funds target was 5.25% through the summer. On August 7, 2007, the FOMC kept that target unchanged and said economic growth appeared moderate, although financial markets had become volatile and credit conditions had tightened. By September 18, the committee cut the target by half a percentage point to 4.75% as the housing correction intensified and disruptions in financial markets threatened the broader economy.
That sequence is important because a high long yield in 2007 did not prevent an approaching recession and financial crisis. Long-term rates are not a perfect forecast of healthy growth. They can remain elevated until credit losses, liquidity stress and policy easing become impossible to ignore. A historical comparison should therefore encourage risk awareness, not a mechanical prediction that 2026 will repeat 2008.
The 2007 financial system carried different vulnerabilities
The pre-crisis system was heavily exposed to housing leverage, weak mortgage underwriting, opaque securitization and short-term wholesale funding. Many institutions appeared well capitalized until losses and liquidity demands revealed how concentrated the risks were. The central macroeconomic story was not a technology investment boom; it was a credit boom built around residential property and financial engineering.
In 2026, the visible investment boom is centered more heavily on AI infrastructure, semiconductors, data centers and power. The largest spenders are highly profitable technology companies with large cash balances rather than thinly capitalized mortgage vehicles. That difference reduces some forms of systemic funding risk.
It does not eliminate leverage elsewhere. Commercial real estate, private credit, leveraged corporate borrowers, government debt and interest-rate exposure can transmit stress. Banks and insurers still hold long-duration assets. The lesson from 2007 is not that the same asset must fail again; it is that a stable macro headline can coexist with vulnerabilities that are not yet fully priced.
Inflation was a different constraint
In 2007, the Fed was able to cut aggressively as financial conditions deteriorated because the emerging threat to growth became dominant. In 2026, annual PCE inflation remained 3.7% and core inflation 3.3% at the research cutoff. If financial stress appeared while inflation remained elevated, the Fed’s room to ease would be more constrained.
This is one reason the long end can demand a larger premium. Investors are not only estimating whether the economy will weaken; they are estimating how quickly the Fed could respond without damaging inflation credibility. A central bank facing above-target inflation may tolerate tighter financial conditions longer than one facing stable prices.
Government debt and issuance are more central today
The federal debt burden and projected interest expense are much larger relative to the economy than they were before the global financial crisis. Long-term yields therefore carry a more visible fiscal dimension. Investors must absorb substantial issuance even outside a recession, and refinancing costs feed into future deficits.
This does not mean a debt crisis is inevitable. The United States issues debt in its own currency, has deep capital markets and retains exceptional global financial importance. It means that a 2026 long-bond yield is partly a price for fiscal supply and political uncertainty in a way that may be more pronounced than in 2007.
Technology investment could raise both growth and rates
The AI boom creates another important difference. If investment raises productivity, the economy may support a higher real interest rate without recession. Strong demand for capital can push up the return required to balance saving and investment. In that case, a long yield near 5% may reflect a healthier real-growth outlook than the same yield did on the eve of a credit crisis.
The market must distinguish productive investment from overbuilding. Microsoft’s Azure growth suggests that at least part of the capacity has immediate demand. Meta’s cash-flow compression shows that the timing of returns can remain uncertain even for a company with exceptional scale. The aggregate economy could gain productivity while individual investors discover that too much capital was committed to the wrong assets or at the wrong price.
The correct historical lesson
The useful lesson from 2007 is humility. A familiar yield level does not create a familiar outcome. In 2007, the key variable became credit deterioration. In 2026, the decisive variables may be inflation persistence, fiscal supply, energy shocks and the return on technology investment. The same number can sit at the intersection of a very different set of risks.
Historical comparisons are most valuable when they identify mechanisms rather than dates. The mechanism to watch is whether high rates reveal hidden leverage and force asset sales, whether the Fed can respond without unanchoring inflation, and whether investment generates enough cash to service its financing. Those questions connect the two periods without pretending they are identical.
The Price Risk Hidden Inside a Long-Duration Bond
A 30-year Treasury is often described as risk-free because the U.S. government is expected to make the promised dollar payments. That description refers to credit risk, not price risk or inflation risk. An investor who must sell before maturity can experience a large loss when market yields rise. An investor who holds to maturity can receive every nominal payment and still lose purchasing power if inflation is higher than expected.
Duration is the concept used to estimate a bond’s sensitivity to changes in yield. The longer the maturity and the lower the coupon, the greater the duration generally is. A rough rule is that a bond with a duration near fifteen years might lose approximately 15% of its value if yields rise by one percentage point, before accounting for convexity. The exact result depends on the bond’s coupon, yield and cash-flow structure.
This sensitivity explains why relatively small yield moves can create large mark-to-market changes. A rise from 4.5% to 5.2% may look modest beside an equity move of 10%, but for a long-duration portfolio it can represent a substantial loss. Leveraged investors can face margin calls, and institutions with mismatched liabilities can be forced to sell.
Convexity makes the relationship nonlinear
Bond prices and yields do not move in a straight line. Convexity describes the curvature of the relationship. For a standard Treasury, price gains from a large yield decline are generally somewhat greater than the price losses predicted by a simple linear duration estimate, while losses from a rise are somewhat smaller than the linear estimate. Mortgage-backed securities can behave differently because borrowers refinance when rates fall, shortening the life of the security.
Mortgage convexity can affect Treasury markets. When rates rise, expected mortgage duration extends because fewer borrowers refinance. Investors or dealers may sell Treasuries or receive fixed rates in derivatives to rebalance their hedges, adding to the selloff. These flows can amplify a fundamental move without changing its underlying cause.
Accounting treatment does not remove economic exposure
A bank or insurer may classify some securities so that unrealized losses do not flow immediately through earnings. That accounting can reduce reported volatility, but it does not restore the market value of the asset. If the institution needs liquidity, the loss becomes economically relevant. The distinction between held-to-maturity accounting and actual funding stability is therefore crucial.
Households encounter a related effect through bond funds. An individual Treasury held to maturity has a defined repayment date. A bond fund continually buys and sells securities and does not promise that an investor will receive par on a particular date. Its net asset value can remain below an investor’s purchase price for an extended period when yields rise.
Reinvestment is the positive side of higher yields
Higher yields are not purely harmful. New buyers receive more income, and institutions with long liabilities can reinvest cash at more attractive rates. Over time, higher coupons can offset initial price losses. The effect depends on the investor’s horizon. A retiree needing to sell today experiences the move differently from a pension plan buying assets for obligations decades away.
This dual effect is why “bonds fell” and “bond investors benefit from higher yields” can both be true. Existing bonds lose value when yields rise; new money earns more. The transition redistributes returns across time and among investors.
Real Yields, Inflation Compensation and the Term Premium
To understand whether a 5.24% nominal yield is alarming, investors try to decompose it. One component is expected inflation. Another is the expected real return after inflation. A third is the term premium, which compensates for uncertainty and duration risk. None can be observed perfectly, but Treasury Inflation-Protected Securities, inflation swaps and economic models provide estimates.
Inflation breakevens are useful but incomplete
The breakeven inflation rate is the difference between a nominal Treasury yield and the yield on a comparable inflation-protected security. It is often described as the market’s expected inflation rate. More precisely, it also contains inflation-risk premiums, liquidity differences and technical factors. A stable breakeven with a rising nominal yield can suggest that real yields or the term premium are increasing rather than inflation expectations alone.
This distinction matters for policy. A rise driven by real growth may be less troubling for credibility than a rise driven by unanchored inflation expectations. It can still tighten financial conditions. A rise driven by term premium may reflect fiscal supply or uncertainty that the Fed cannot directly remove.
Real yields affect investment decisions
A higher real yield raises the return available on a government-backed asset after expected inflation. Risky projects must offer more to compete. This is the channel through which the Treasury market disciplines corporate capital allocation. An AI project promising an uncertain 7% return looks attractive when real safe yields are near zero and much less attractive when real yields are materially positive.
Companies can overcome that hurdle through higher productivity, proprietary data, customer lock-in or pricing power. Microsoft’s enterprise distribution supports that case. Projects that depend primarily on a broad future narrative will be discounted more severely.
The term premium is partly a price for not knowing
The term premium can rise even when the average expected path of short-term rates changes little. Investors may simply become less certain about inflation, deficits, political decisions or the Fed’s reaction function. Greater uncertainty increases the range of possible outcomes and makes a long fixed nominal payment stream less attractive.
The July press conference may have increased this uncertainty. Reducing forward guidance was intended to prevent false precision, but it also removed information investors used to narrow their range of rate-path scenarios. The long end responded by charging more for that wider distribution.
This interpretation does not require the market to believe that Warsh will fail. It requires the market to believe that the probability of several very different outcomes has increased. A higher term premium is the price of that uncertainty.
The Fiscal Term Premium Cannot Be Separated from Fed Credibility
Debates about central-bank credibility often focus narrowly on whether the Fed is sufficiently hawkish. That frame overlooks the interaction between monetary policy and fiscal policy. The Fed can influence demand and inflation, but it does not control the volume of Treasury issuance. When deficits remain large during a period of low unemployment and solid private demand, monetary restraint must work against an expansionary fiscal backdrop.
The CBO’s projected $1.9 trillion fiscal 2026 deficit was large relative to the size of the economy and the stage of the business cycle. Deficits are expected during recessions, emergencies and wars. A persistent deficit near 6% of GDP in a growing economy suggests a structural gap between spending and revenue. Investors must decide how much duration they are willing to absorb and at what yield.
Foreign official institutions, domestic banks, pensions, insurers, mutual funds and households all participate in the Treasury market, but their demand is not unlimited at a fixed price. Regulatory changes, reserve management, currency hedging costs and relative yields in other countries can shift that demand. If traditional buyers become less price-insensitive, the Treasury must offer a higher return to clear auctions.
Federal Reserve policy can affect this process. A credible anti-inflation central bank lowers the inflation compensation investors require. But the Fed cannot permanently neutralize fiscal pressure without risking its own mandate. Large-scale purchases of government debt could lower long yields temporarily, yet doing so during above-target inflation would raise questions about fiscal dominance—the concern that monetary policy is being subordinated to government financing needs.
Warsh’s challenge is therefore broader than choosing between a hold and a hike. He must demonstrate that monetary decisions are independent, data-driven and consistent with the inflation target while avoiding the impression that the Fed will rescue every bond-market selloff. His phrase “play the ball, not the referee” captured that principle: policy should respond to economic conditions rather than to market criticism. The difficulty is that market prices are themselves part of those conditions.
A 5.24% 30-year yield may tighten the economy enough to reduce future inflation. It may also reflect a fiscal premium that monetary policy cannot remove without a change in budget policy. Distinguishing those forces will be one of the most important analytical tasks for the second half of 2026.
Microsoft’s Earnings Passed the First AI-Capital Test
Microsoft’s fiscal fourth-quarter results offered the strongest counterargument to the idea that all large technology companies are overspending on artificial intelligence. The company did not merely report a large capital budget. It connected that spending to accelerating cloud revenue, contracted demand, paid product adoption and substantial operating cash flow.
For the quarter ended June 30, Microsoft reported revenue of $90.0 billion, an increase of 18% from a year earlier. Operating income rose 18% to $40.6 billion. GAAP net income increased 31% to $35.8 billion, while non-GAAP net income rose 22% to $35.3 billion. Diluted earnings per share were $4.81 under GAAP and $4.74 on the company’s adjusted basis.
The result included a $3.2 billion gain related to Microsoft’s investment in Anthropic and other discrete items that together benefited earnings per share by $0.27 relative to the company’s prior guidance. That distinction is important. Microsoft’s quarter was strong even without treating the investment gain as evidence of recurring operating performance, but investors should not confuse a valuation-related gain with revenue generated by cloud customers.
Azure accelerated instead of merely holding up
The most important operating figure was Azure and other cloud-services revenue growth of 43% year over year. Microsoft said annual Azure revenue had exceeded $100 billion and increased 41% for the full fiscal year. The Intelligent Cloud segment generated $39.3 billion of quarterly revenue, up 32%, while total Microsoft Cloud revenue reached $59.3 billion, up 27%.
Those growth rates matter because the AI-investment debate is fundamentally about utilization. Data-center assets create economic value when customers use and pay for them. Azure’s acceleration indicated that demand was not merely theoretical. Enterprises were consuming more compute, storage, database and AI services, and Microsoft was converting that use into recognized revenue.
The company also reported commercial remaining performance obligations of $678 billion, up 84%. RPO is not the same as revenue and should not be treated as cash already earned. It represents contracted commitments that are expected to be recognized over time, subject to contract terms and customer behavior. Even with that caveat, the figure provided visibility into future demand and helped investors believe that current infrastructure investment had a customer base waiting for it.
Copilot moved from narrative to paid adoption
Microsoft said Microsoft 365 Copilot had more than 30 million paid seats. Seat counts do not reveal the full economics: pricing tiers, discounts, deployment breadth and active usage all matter. Still, paid adoption is stronger evidence than a raw user-registration figure. It indicates that businesses are allocating actual budgets to AI-enhanced productivity software.
Microsoft’s advantage is distribution. It already supplies operating systems, productivity software, identity tools, databases, developer platforms and cloud infrastructure to a vast enterprise base. AI features can be attached to products customers already buy, reducing the cost and friction of commercialization. A company does not need to persuade each customer to adopt an entirely new vendor relationship; it can expand within an existing one.
This installed base also supports pricing power. An enterprise that standardizes on Microsoft identity, security, productivity and cloud products faces meaningful switching costs. Those costs do not eliminate competition from Amazon Web Services, Google Cloud, open-source models or specialized AI providers, but they make Microsoft’s revenue stream more durable than that of a stand-alone application with no embedded workflow.
The spending was enormous, but cash generation remained credible
Microsoft said quarterly capital expenditures were approximately $41 billion, with about two-thirds directed toward short-lived assets such as CPUs and GPUs. Cash paid for property and equipment was $35.8 billion. Those are extraordinary amounts by historical corporate standards and demonstrate that the AI race is becoming one of the largest private infrastructure programs in the economy.
Yet operating cash flow was $55.4 billion, up 30%, and free cash flow was $19.6 billion after capital expenditures. Free cash flow declined because spending grew so rapidly, but it remained substantial. On revenue of $90 billion, Microsoft still generated a free-cash-flow margin of roughly 22%. That remaining cash capacity gave investors evidence that the company could finance much of its buildout internally while preserving strategic flexibility.
Cloud gross margin was 65%, down from the prior year because of Azure’s growing mix and investment in AI infrastructure. Margin compression is a genuine cost of the strategy. Accelerators depreciate, power is expensive and capacity can be underutilized. The positive interpretation is that Microsoft absorbed that pressure while maintaining a companywide operating margin near 45%.
Operating expenses increased about 10%, materially slower than revenue. Headcount declined 2%. This combination suggested that management was exercising discipline outside the infrastructure budget. Investors were therefore willing to tolerate the capital intensity because the company was not simultaneously allowing every expense category to accelerate.
Why the stock reaction was so large
Microsoft shares were trading around $444.66 at approximately 11:17 a.m. EDT on July 30, up about 13.9% from the prior close after reaching an intraday high near $451.94. Intraday prices can reverse, and the move should not be described as a final closing return. Nevertheless, the magnitude showed how much skepticism had been embedded before the report.
The rally was not simply a reward for beating a quarterly estimate. It represented a re-rating of the probability that Microsoft’s AI investments will produce durable revenue. Azure accelerated, Copilot seats expanded, backlog increased and operating cash flow remained powerful. Investors received multiple forms of corroborating evidence rather than one favorable metric.
There are still risks. RPO can be concentrated in large contracts, cloud capacity can become excessive, model costs can fall faster than pricing, and competition can pressure margins. The Anthropic gain inflated GAAP earnings. Capital spending of this scale must continue producing growth for years to justify itself. Microsoft passed the current test; it did not eliminate the need for future proof.
Microsoft Fact Box
The Evidence Behind Microsoft’s AI-ROI Case
- Quarterly revenue: $90.0 billion, up 18%.
- Azure and other cloud-services revenue growth: 43%.
- Microsoft Cloud revenue: $59.3 billion, up 27%.
- Commercial remaining performance obligations: $678 billion, up 84%.
- Quarterly operating cash flow: $55.4 billion; free cash flow: $19.6 billion.
- Capital expenditures: approximately $41 billion.
- Microsoft 365 Copilot: more than 30 million paid seats.
Original sources: Microsoft fiscal 2026 fourth-quarter release and Microsoft earnings-call materials.
Meta’s Quarter Showed Why Revenue Growth Alone Is Not Enough
Meta Platforms reported a quarter that would have looked exceptional in a less capital-intensive era. Revenue increased 28% to $60.8 billion. Daily active people across its family of apps reached 3.60 billion, up 3%. Advertising impressions rose 14%, and the average price per ad increased 12%. Those figures demonstrated that Facebook, Instagram, WhatsApp and the company’s advertising systems remained commercially powerful.
The market focused on a different set of numbers. Total costs and expenses increased 55% to $42.0 billion. Operating income declined 8% to $18.8 billion, and the operating margin fell to 31% from 43% a year earlier. Net income decreased 14% to $15.8 billion, while diluted earnings per share fell 13% to $6.18.
Part of the expense increase was unusual. The quarter included approximately $2.4 billion of legal charges and $1.18 billion of severance expense. Those items should not be treated as recurring measures of the core advertising business. Even after acknowledging them, however, Meta’s underlying spending trajectory was steep. Research and development, infrastructure depreciation, employee compensation and AI capacity were all expanding.
Free cash flow nearly vanished despite strong operating cash flow
Meta generated $31.9 billion of operating cash flow, which showed that the core business remained highly cash generative before investment. Capital expenditures, including principal payments on finance leases, reached $31.1 billion. The result was free cash flow of only $784 million, down from $8.55 billion a year earlier.
This contrast explains much of the negative reaction. Operating cash flow describes the cash produced by the business before capital investment. Free cash flow subtracts the cash required for property, equipment and related infrastructure. A company can report strong revenue and operating cash flow while leaving little cash after an aggressive buildout. That is not automatically bad if the investment produces superior future returns, but the burden of proof increases.
Meta raised the lower end of its full-year capital-expenditure outlook to $130 billion to $145 billion, from a previous range of $125 billion to $145 billion and an initial annual forecast of $115 billion to $135 billion. The repeated upward revisions told investors that infrastructure needs were growing faster than management had expected at the start of the year.
Meta also projected third-quarter revenue of $61 billion to $64 billion and full-year expenses of $165 billion to $169 billion. The revenue outlook still implied growth, but the expense trajectory made it harder for investors to determine when incremental AI investment would restore rather than compress margins.
The advertising engine was healthy
A balanced analysis should not describe Meta as a company with no AI return. Its recommendation systems and ad tools already use machine learning to improve content ranking, targeting, creative production and conversion. Revenue growth of 28% and simultaneous increases in ad impressions and price indicate that advertisers were receiving enough value to spend more.
AI may be contributing to that performance even when the financial statements do not isolate an “AI revenue” line. Better recommendations can increase engagement, better ad matching can improve return on ad spend, and automated creative tools can make advertising accessible to smaller businesses. Meta’s current AI monetization is therefore embedded inside the advertising model rather than sold primarily as a separate cloud service.
The market’s concern was not that AI contributed nothing. It was that the new spending extended beyond the visible benefits of the existing ad system. Management discussed personal AI agents, future platforms and the possibility of making excess compute available to outside users. Those opportunities may become significant, but their revenue models, margins and timelines were less defined than Azure consumption or Microsoft 365 subscriptions.
Compute capacity is valuable, but value depends on use
Meta’s strategy reflects a reasonable fear: in a world where leading AI products are constrained by compute, underinvesting could be more dangerous than overinvesting. A shortage of capacity could limit model training, product launches and the company’s ability to compete for talent. Purchasing infrastructure early can also secure scarce chips, power and data-center locations.
Yet compute is not a commodity that guarantees a return merely because it is scarce today. Hardware ages, models become more efficient, chip architectures change and energy costs persist. Capacity built for one technical assumption may not be optimal under another. If Meta rents unused capacity to third parties, it enters a market dominated by experienced cloud providers with established enterprise sales, support and billing systems.
Mark Zuckerberg’s long-term record complicates the evaluation. Meta successfully shifted from desktop to mobile and built one of the most profitable advertising systems in history. It also spent tens of billions of dollars on Reality Labs, which reported another quarterly operating loss of $4.6 billion and has accumulated more than $80 billion of operating losses over time. Investors therefore have evidence of both exceptional execution and a willingness to fund uncertain platforms for many years.
Why the stock fell
Meta shares were trading near $536.77 around 11:17 a.m. EDT on July 30, down about 8.3% from the prior close. The decline followed an extended-hours selloff after the report. Again, the price was intraday rather than a closing result.
The negative reaction reflected a mismatch between current evidence and future spending. Revenue growth was strong, but costs grew much faster. The operating margin contracted, free cash flow fell to less than $1 billion and the capital budget moved higher. Investors were asked to accept a larger near-term sacrifice while receiving limited precision about the timing and magnitude of future AI revenue streams.
Meta may ultimately prove that this investment was necessary and highly profitable. The quarter did not disprove that thesis. It showed that markets now require milestones. Those could include improving free cash flow, clearer agent revenue, measurable business subscriptions, successful external compute sales, lower inference costs or evidence that AI-driven engagement is sustaining ad growth at attractive margins.
Meta Fact Box
Strong Advertising, Much Heavier Investment
- Quarterly revenue: $60.8 billion, up 28%.
- Total costs and expenses: $42.0 billion, up 55%.
- Operating margin: 31%, down from 43% a year earlier.
- Operating cash flow: $31.9 billion; free cash flow: $784 million.
- Capital expenditures including finance-lease principal: $31.1 billion.
- Full-year capital-expenditure outlook: $130 billion to $145 billion.
- Reality Labs operating loss: $4.6 billion for the quarter.
Original source: Meta Platforms second-quarter 2026 results.
Microsoft Versus Meta: The Market’s Emerging AI-ROI Scorecard
The opposite stock reactions did not establish that Microsoft has solved AI economics or that Meta has failed. They did reveal the criteria investors are beginning to apply. During the first phase of the generative-AI boom, strategic ambition and access to scarce chips were often enough to support valuations. The next phase is more demanding. Investors want to see how capacity becomes revenue, how revenue becomes cash and whether the resulting return exceeds the cost of capital.
| Measure | Microsoft | Meta Platforms | Why It Matters |
|---|---|---|---|
| Quarterly revenue growth | 18% | 28% | Meta grew faster, showing that the negative reaction was not caused by weak demand alone. |
| Visible AI monetization | Azure consumption, Copilot paid seats, cloud contracts | Ad-ranking gains, engagement, future agents and possible compute sales | Direct product revenue is easier to value than benefits embedded across a platform. |
| Quarterly free cash flow | $19.6 billion | $784 million | Cash remaining after investment determines flexibility and resilience. |
| Operating margin | Approximately 45% | 31% | Margins show how much current profitability is being absorbed by the buildout. |
| Demand visibility | $678 billion commercial RPO | Large global user base and advertising demand, but less quantified new-platform revenue | Contracted commitments reduce uncertainty, though RPO is not recognized revenue. |
| Main investor concern | Whether growth can continue to justify enormous capex | When rising compute spending will produce identifiable incremental cash returns | Both companies still face execution risk; the evidence differs in degree, not kind. |
Table sources: Microsoft and Meta investor disclosures. Figures refer to different fiscal reporting frameworks and should be compared as strategic indicators rather than as perfectly identical accounting measures.
1. Is demand observable?
Microsoft could point to Azure growth, paid Copilot seats and contractual backlog. Meta could point to user scale, advertising growth and improved recommendation systems. Both had demand evidence, but Microsoft’s new AI-related demand was easier to isolate. The more specific the customer, product and payment mechanism, the easier it is for investors to estimate a return.
2. Is the investment generating incremental revenue?
Revenue growth by itself is insufficient because a company might have grown even without the newest spending. The relevant question is incremental economics: how much additional revenue and gross profit can be attributed to the added capacity? Microsoft’s Azure acceleration provided a persuasive correlation, though not a perfect causal calculation. Meta’s ad growth also likely reflected AI improvements, but the connection between the newest infrastructure and the newest revenue was less explicit.
3. Are margins resilient?
AI infrastructure is expensive. Gross margins can fall as depreciation, power and networking costs enter the income statement. Investors can accept lower margins if revenue is accelerating and the company has a credible path to scale. Microsoft’s cloud gross margin declined, but companywide operating profitability remained exceptional. Meta’s operating margin fell by twelve percentage points, making the current sacrifice much more visible.
4. Is there cash left after investment?
Free cash flow is not the only measure of value, but it is a useful discipline. It shows whether a company’s operations can fund investment while leaving resources for dividends, repurchases, acquisitions, debt reduction or resilience during a downturn. Microsoft retained nearly $20 billion of quarterly free cash flow. Meta retained less than $1 billion. The gap made the market’s preference understandable even though the businesses differ.
5. How flexible is the strategy?
Microsoft can monetize AI through infrastructure, software subscriptions, security, databases, developer tools and industry applications. Meta’s primary current cash engine remains advertising, while future agents, subscriptions, devices and compute services are less mature. Strategic flexibility reduces the risk that one product category must carry the entire investment.
6. What is the cost of capital?
This criterion connects the earnings story to the Treasury selloff. When the risk-free rate rises, the required return on a multi-year data-center project rises. A project that looked attractive with a 4% long bond may look less attractive above 5%, especially if revenue is uncertain and assets depreciate quickly. Companies with clear near-term cash flows can still create value; speculative capacity becomes harder to justify.
The Rest of the Earnings Tape Confirmed a Market of Selectivity
Microsoft and Meta dominated the morning, but other results reinforced the same lesson. Investors were not rewarding every earnings beat or every exposure to AI. They were evaluating guidance, capital intensity, end-market demand and whether favorable conditions were already reflected in the share price.
Samsung: record conditions can still produce a falling stock
Samsung Electronics reported extraordinary semiconductor performance amid tight memory supply and strong demand for high-bandwidth memory. Yet its shares fell in Korean trading. A falling stock after strong results does not mean the results were poor. It can mean expectations were even higher, investors feared that aggressive capital spending would eventually increase supply, or traders believed the favorable memory cycle was near a peak.
Memory is a cyclical industry with powerful operating leverage. When prices rise and factories run near capacity, profit can expand much faster than revenue. When new capacity arrives or demand slows, the same fixed-cost structure can reverse that improvement. Investors therefore look beyond the current quarter to future bit supply, contract pricing and customer inventory.
Qualcomm: diversification helped, handset weakness still mattered
Qualcomm reported fiscal third-quarter revenue of approximately $9.95 billion and non-GAAP earnings per share of $2.21. Automotive and internet-of-things revenue increased strongly, supporting the company’s effort to diversify beyond smartphones. The outlook nevertheless pointed to continued handset pressure, and the next-quarter adjusted earnings range was below the consensus figure reported before the release.
The market response showed that an AI or edge-computing narrative cannot fully offset weakness in a large legacy segment. Diversification must become large enough to change the consolidated earnings profile. Until then, handset demand, customer concentration and licensing trends remain central.
Fortinet: profitable infrastructure exposure earned a premium
Fortinet reported quarterly revenue of approximately $2.05 billion, up 26%, billings of $2.37 billion, up 33%, and free cash flow of about $966 million. The company raised its full-year revenue-growth outlook. Cybersecurity spending is not immune to economic cycles, but it is increasingly treated as essential infrastructure. Strong billings and cash generation gave investors evidence that demand was translating into financial returns.
Starbucks: execution improvements mattered more than the macro label
Starbucks reported an improvement in comparable sales and raised full-year guidance. New menu items and loyalty initiatives contributed to the recovery. The company’s results illustrated that even in an environment of high borrowing costs and uneven consumer confidence, operational changes can alter company-specific performance.
The broader lesson was dispersion. A macro headline such as “higher yields hurt stocks” is directionally useful but incomplete. Microsoft rose sharply despite higher yields because earnings expectations changed more. Meta fell despite strong revenue because the spending outlook overwhelmed the top-line result. Fortinet gained on cash-backed growth. Samsung fell despite extraordinary profit. Markets were distinguishing quality and durability rather than applying one simple factor.
Higher Long-Term Yields Will Reshape the AI Infrastructure Race
The AI buildout is frequently compared with earlier general-purpose technologies such as electrification, railroads, telecom networks and the internet. Those comparisons are useful because they show that transformative infrastructure can create enormous social value while producing uneven investor returns. Too much capital can chase a real technological opportunity. The technology can succeed even when some projects fail financially.
A higher long-term Treasury yield increases the risk of that divergence. The cost of capital affects every layer of the AI stack: semiconductor fabrication, data-center construction, power generation, transmission lines, cooling equipment, fiber networks and software development. Large technology companies can fund much of their investment from cash, but suppliers, utilities, developers and smaller customers often rely on debt.
Power may become the binding constraint
Data centers require not only chips but reliable electricity. New generation and grid connections can take years. Utilities must finance plants, substations and transmission upgrades, often through a combination of debt and regulated customer rates. When long-term borrowing costs rise, the required revenue from those assets rises as well. That can increase the delivered cost of compute.
Technology companies may respond by signing long-duration power-purchase agreements, investing directly in generation or locating facilities near available capacity. Those commitments transfer or concentrate risk rather than eliminating it. A company that secures power for twenty years must remain confident that its data-center demand will justify the contract.
Hardware depreciates faster than traditional infrastructure
A railroad or transmission line may operate for decades. AI accelerators can become economically outdated within a few product cycles. Microsoft’s disclosure that roughly two-thirds of quarterly capital expenditures involved short-lived assets highlighted this difference. Rapid depreciation means revenue must arrive quickly enough to recover the investment before more efficient hardware reduces the asset’s competitiveness.
This feature makes utilization critical. An expensive accelerator operating near capacity for paid workloads can generate an attractive return. The same accelerator sitting idle can destroy value rapidly. Cloud providers therefore need demand forecasting, scheduling software and pricing systems as much as they need hardware.
Falling model costs cut both ways
Improved model efficiency can lower inference costs and expand the number of economically viable applications. That is positive for adoption. It can also reduce the scarcity value of existing capacity or compress the price customers are willing to pay for a unit of compute. Providers must capture enough of the efficiency gain through volume, new services or margins.
Microsoft’s diversified model gives it several ways to benefit from lower costs. Cheaper inference can improve margins on Copilot, stimulate Azure usage or enable features inside existing subscriptions. Meta can also benefit because lower costs make AI recommendations and agents cheaper to operate across billions of users. The question is whether savings outpace the growth of usage and continued frontier-model investment.
Balance-sheet strength becomes a strategic advantage
When capital is expensive, companies with strong operating cash flow can invest while competitors retrench. Microsoft and Meta both have substantial cash resources and profitable core businesses. Their ability to continue spending is not in immediate doubt. The higher-rate environment instead changes the opportunity cost and raises the standard for returns.
Smaller AI companies face a sharper constraint. They may depend on venture funding, cloud credits, strategic investors or debt secured by equipment. If long yields remain high and public markets become more selective, the gap between well-funded platforms and start-ups can widen. Consolidation, partnerships and capacity-sharing agreements may become more common.
The paradox is that higher yields could strengthen the largest incumbents even while compressing their valuation multiples. They possess the cash, distribution and customer relationships needed to survive an expensive buildout. The economic gains from AI could become concentrated if smaller firms cannot finance the infrastructure required to compete.
What the Bond Move Means for Corporate Strategy
A jump in long-term Treasury yields is not only a portfolio event. It changes the assumptions used by chief financial officers, boards and operating executives. Projects approved under one cost-of-capital environment can look very different when the benchmark rate rises by a full percentage point. The correct response is not necessarily to cancel investment. It is to distinguish projects with near-term, measurable economics from projects whose value depends on optimistic assumptions far into the future.
Recalculate the hurdle rate instead of relying on last year’s model
Many capital budgets use a weighted average cost of capital that is updated infrequently. That can create a false sense of precision. When the risk-free rate rises, debt costs, equity discount rates and lease economics can all change. A project that barely cleared its hurdle under a lower-rate assumption may no longer create value.
The calculation should also reflect project-specific risk. A data-center expansion supported by contracted customer demand is different from one built in anticipation of undefined future applications. A factory modernization that reduces energy use immediately is different from a speculative capacity increase. Applying one corporate hurdle rate to every project can conceal these distinctions.
Match financing duration with asset life
Companies can reduce refinancing risk by aligning debt maturity with the period over which an asset produces cash. Long-lived infrastructure may justify long-term financing even at a higher rate because short-term debt creates the risk that funding becomes unavailable at the wrong moment. Short-lived technology assets require more caution. Borrowing for twenty or thirty years to finance hardware that may be economically obsolete within several years can create a mismatch.
Microsoft’s disclosure that much of its capital spending involved short-lived CPUs and GPUs is relevant here. The company has enough operating cash flow to avoid depending entirely on long-term borrowing. A smaller business attempting a similar buildout with debt would face a very different risk profile.
Stress-test revenue, utilization and residual value
The most dangerous capital model assumes high utilization, stable pricing and meaningful resale value at the same time. In an emerging technology market, all three assumptions can fail together. Demand may arrive later than expected, competitors may cut prices and new chips may reduce the value of older equipment.
A credible stress test should ask what happens if utilization is lower, revenue per unit falls and depreciation accelerates. It should include power costs, maintenance, customer concentration and the possibility that contracts are renegotiated. The purpose is not to prove that a project is unattractive. It is to identify how much downside the balance sheet can absorb.
Preserve flexibility when uncertainty is high
Modular construction, staged commitments, cloud partnerships and shorter procurement cycles can preserve options. These approaches may cost more per unit than an immediate large-scale build, but flexibility has value when demand and technology are changing quickly. A company that commits every dollar at once may achieve the lowest apparent unit cost while accepting the highest strategic risk.
Meta’s decision to secure massive compute capacity reflects the opposite concern: that waiting could leave the company unable to compete. The trade-off is genuine. Underinvestment can be fatal in a platform transition; overinvestment can destroy returns. The appropriate balance depends on the company’s cash generation, distribution advantage and ability to repurpose assets.
Communicate milestones, not only ambition
The market reactions to Microsoft and Meta demonstrated the value of measurable milestones. Investors can evaluate Azure growth, paid Copilot seats, remaining obligations and free cash flow. They have more difficulty valuing a statement that future personal agents could become a major platform.
Management teams do not need to disclose competitively sensitive details, but they should explain what progress looks like. Useful milestones can include customer adoption, utilization, unit cost, gross margin, contract duration, revenue per user, retention and cash conversion. When the capital budget rises, the reporting framework should become more specific rather than less.
Do not confuse available liquidity with an acceptable return
Large technology companies can afford projects that smaller firms cannot. Affordability does not prove value creation. A company can remain solvent while earning a poor return on capital. Boards therefore need to distinguish strategic necessity from financial success.
Some investments are defensive. A platform may need to spend simply to prevent customer loss or technological irrelevance. The return is then measured partly through avoided decline rather than new revenue. That logic can be valid, but it should be stated honestly. Labeling every defensive expenditure as a new growth opportunity makes later accountability difficult.
Prepare for financing dispersion
A higher Treasury benchmark will not affect every borrower equally. Cash-rich investment-grade companies may continue to finance at attractive spreads. Smaller firms, commercial real-estate owners and leveraged issuers can experience a much larger increase in all-in costs. Banks may tighten standards as collateral values and debt-service coverage weaken.
This dispersion can create strategic opportunities for strong balance sheets. Companies may acquire assets from constrained competitors, negotiate better supplier terms or gain market share. It can also create concentration risk if only the largest firms can afford critical infrastructure. Policymakers and regulators may eventually examine whether access to compute, energy and capital is becoming too narrow.
What “Bond Vigilantes” Can—and Cannot—Do
The term “bond vigilantes” describes investors who sell government debt when they believe fiscal or monetary policy is too inflationary, forcing yields higher and increasing the cost of borrowing. The phrase can make the bond market sound like a coordinated political actor. In reality, the market consists of institutions and individuals with different mandates, time horizons and reasons for trading.
A pension fund may reduce duration because its liabilities changed. A hedge fund may unwind a leveraged curve position. A foreign reserve manager may adjust currency exposure. A bank may hedge mortgage convexity. An asset manager may decide that inflation compensation is inadequate. The resulting price can carry information even when no participant intends to send a policy message.
Bond investors also have limits. They cannot set the federal-funds rate, pass a budget or determine future inflation. A selloff can overshoot because of positioning and liquidity. If economic data weaken, buyers may return quickly. Calling every rise in yield a successful act of discipline over government exaggerates the market’s precision.
Still, higher yields impose real constraints. They increase debt-service costs, reduce the present value of assets and tighten financial conditions. Governments can ignore the message rhetorically, but they cannot eliminate the arithmetic. The most useful interpretation of the July move is therefore not that vigilantes defeated the Fed. It is that the market raised the price of uncertainty.
The Global Bond Market Was Hearing the Same Warning
The U.S. move did not occur in isolation. European long-term yields also rose, and the Bank of England faced its own debate about whether inflation risks required tighter policy. The BOE ultimately held rates, with an additional policymaker favoring an increase. Japanese markets were preparing for a Bank of Japan decision while the yen remained under pressure.
Global synchronization matters because government-bond markets compete for the same pool of capital. If German, British or Japanese yields rise, U.S. Treasuries may need to offer more attractive returns to remain competitive after currency-hedging costs. Conversely, a flight from risk abroad can increase Treasury demand. Relative policy paths, not only domestic data, influence the long end.
Inflation shocks can also travel across borders. Oil is globally priced, shipping disruptions affect imported goods and AI infrastructure competes for internationally traded chips, power equipment and engineering capacity. A U.S. company building a data center may be exposed to transformer shortages or construction costs that originate outside the United States.
The global comparison also complicates the credibility narrative. The Federal Reserve was not the only central bank trying to distinguish a temporary supply shock from persistent inflation. The BOE faced wage and service-price concerns. The BOJ faced the consequences of a weaker currency and changing domestic inflation. A common rise in long yields can reflect a global repricing of inflation and fiscal risk, not only a judgment on one chair.
Four Plausible Paths for the Rest of 2026
Forecasting one exact path would create false precision. The more useful approach is to identify scenarios and the evidence that would make each one more or less likely. The July market move will be validated or reversed by subsequent inflation, employment, fiscal and earnings data.
Scenario 1: Inflation cools and the long-bond selloff proves excessive
In the first scenario, June’s favorable monthly inflation reading becomes the start of a sustained trend. Energy prices stabilize, supply disruptions ease and core inflation moves closer to 2%. Employment softens gradually without collapsing. Under those conditions, the Fed can remain on hold and eventually consider cuts without sacrificing credibility.
Long-term yields could decline as the inflation premium falls. Mortgage rates would have room to ease, equity discount rates would become less restrictive and the dollar might weaken. Microsoft’s result would then look like evidence that AI investment can support productivity without generating a lasting inflationary boom.
The risk to this scenario is that strong private demand and investment keep service inflation elevated. A few soft monthly reports are not enough. The Fed would need a sequence of data showing progress across multiple measures.
Scenario 2: Energy and demand keep inflation above 3%
In the second scenario, oil remains expensive, private demand continues to grow near 4% and core inflation stays above 3%. The labor market remains firm enough that the Fed has little reason to prioritize employment. The three July dissenters gain support, and a later rate increase becomes more likely.
Short-term yields would probably rise toward the long end, reducing some of the curve steepening. Long yields could remain high or rise further if investors conclude that the Fed is still behind the curve. Rate-sensitive sectors would face greater pressure, and companies with speculative investment programs would be asked to show faster returns.
This scenario would test Warsh’s stated commitment. Acting after inflation remained persistent could restore reaction-function credibility, but a delayed move might require more tightening than an earlier one.
Scenario 3: Growth weakens before inflation is defeated
The third scenario is stagflationary. Employment deteriorates, consumption slows and credit losses rise, but energy and supply shocks keep inflation above target. The Fed would face the hardest version of its dual mandate: easing could worsen inflation expectations, while tightening could deepen the slowdown.
The yield curve could behave unpredictably. Short yields might fall on expectations of eventual cuts, while long yields remain elevated because of inflation and fiscal premiums. That would extend the steepening seen after the July meeting. Risk assets could struggle because neither growth nor discount rates would offer support.
For technology companies, a slowdown would separate contractual enterprise demand from discretionary experimentation. Microsoft’s backlog and diversified installed base could provide resilience, while advertising-dependent businesses would be exposed to marketing budgets. Meta’s scale would remain an advantage, but the combination of cyclical ad pressure and fixed infrastructure commitments would draw scrutiny.
Scenario 4: AI investment lifts productivity enough to change the rate regime
The fourth scenario is structurally optimistic but not automatically bullish for bonds. AI, automation and capital investment could raise productivity, allowing the economy to grow faster without the same inflation pressure. Corporate profits and real wages could improve. The neutral real interest rate might also rise because investment opportunities become more productive.
In that world, long-term Treasury yields could remain higher than investors became accustomed to during the 2010s even as inflation returns to target. A 5% nominal long yield would not necessarily signal policy failure if it reflected stronger real returns and sustainable growth. Equities could perform well if earnings growth outpaced the valuation drag.
Microsoft’s results support the possibility that AI is becoming a real enterprise investment cycle rather than a purely speculative theme. Meta’s results show the cost: enormous resources may be spent before the productivity gains become visible. The economy could benefit while individual companies earn very different returns.
What Investors, Business Leaders and Households Should Watch Next
The July 30 market reaction created a useful list of indicators. None should be viewed alone. The interaction among them will determine whether the long-bond move was a temporary positioning shock or the beginning of a more durable regime.
1. The next inflation reports
Monthly core PCE and CPI readings will show whether June’s moderation persists. Composition matters. A decline driven only by energy is less reassuring than broad slowing in housing, services and goods. Revisions also matter because small changes can alter the annualized trend.
2. Payrolls, unemployment and wage growth
The Fed can tolerate more patience if employment weakens. A rising unemployment rate with soft payroll growth would strengthen the case for holding or cutting. Stable unemployment and renewed wage pressure would strengthen the case for a hike.
3. Treasury auctions and term-premium measures
Strong auction demand would suggest investors are willing to absorb supply near current yields. Weak bid-to-cover ratios, larger dealer takedowns or repeated yield concessions would reinforce fiscal-supply concerns. Estimates of the term premium can help separate expected policy rates from compensation for duration risk, though those estimates are model-dependent.
4. Inflation expectations
Market breakeven rates, inflation swaps and household surveys can reveal whether the public expects higher inflation to persist. A credibility problem becomes more serious when expectations move, not merely when nominal yields rise because of real growth.
5. Mortgage and corporate borrowing rates
The economic effect depends on transmission. If Treasury yields rise but credit spreads tighten, strong companies may experience only a moderate increase in borrowing costs. Households and smaller firms can face a larger burden because their rates include additional risk and intermediation costs.
6. Microsoft’s utilization, margins and Copilot economics
Investors should watch whether Azure growth remains above 40%, whether cloud gross margin stabilizes and whether paid Copilot seats translate into material revenue. RPO growth is useful, but conversion into recognized revenue and cash is the ultimate test.
7. Meta’s free cash flow and new revenue milestones
Meta needs to demonstrate that higher capex is producing benefits beyond general strategic optionality. Evidence could include improving free cash flow, quantified agent revenue, business subscriptions, lower inference cost per interaction or profitable third-party compute sales.
8. Oil and the Strait of Hormuz
A temporary spike that reverses has different implications from a sustained disruption. Shipping volumes, insurance costs, inventories and diplomatic developments will matter more than a single intraday price.
9. Federal borrowing projections
Changes in deficits, issuance composition and interest expense will affect the long end. Fiscal policy is not a daily trading catalyst in the same way as an inflation release, but it can shape the baseline yield investors require over years.
10. The composition of debt and capital spending
Headline borrowing totals do not tell the entire story. For the Treasury, the mix of bills, notes and bonds influences duration supply and rollover risk. Greater reliance on short-term bills can reduce immediate long-bond issuance but leaves the government refinancing more frequently. Greater issuance of long bonds locks in funding but asks investors to absorb more duration. Quarterly refunding announcements can therefore move yields even when the projected annual deficit is unchanged.
Corporate capital spending also needs to be decomposed. A dollar spent on land or a durable power connection has a different economic life from a dollar spent on an accelerator that may be replaced within several years. Investors should compare depreciation, lease commitments and cash payments rather than relying on one capex headline. Microsoft’s distinction between total capital expenditure and cash paid for property and equipment is one example of why definitions matter.
For Meta, finance-lease principal was included in the disclosed capital figure, making the measure broader than a simple cash-purchase number. Cross-company comparisons should therefore focus on direction, cash conversion and asset life instead of pretending every reported capex figure is perfectly identical.
The composition question connects fiscal and corporate credibility. Borrowing or spending can be productive when it finances assets that generate future capacity and income. It becomes more difficult to defend when the maturity of the financing, the life of the asset and the timing of the return are badly mismatched.
Frequently Asked Questions
Why did the 30-year Treasury yield reach a 19-year high?
The yield rose after investors reassessed long-term inflation, fiscal and policy risks following the Fed’s decision to hold rates. Strong underlying private demand, above-target inflation, heavy Treasury issuance and uncertainty about the Fed’s reaction function likely contributed. Reuters reported an intraday peak of 5.2444% on July 30, the highest since 2007.
Did the Federal Reserve raise interest rates in July 2026?
No. The FOMC kept the federal-funds target range at 3.50% to 3.75%. The vote was 9–3, with Beth Hammack, Neel Kashkari and Lorie Logan preferring a quarter-point increase.
Why can long-term yields rise when the Fed does not raise rates?
The Fed directly controls a short-term policy rate. Long-term yields reflect expected future policy rates, expected inflation, real growth, Treasury supply and a term premium for duration risk. Investors can therefore demand a higher 30-year yield even when the current overnight rate is unchanged.
What does a steeper yield curve mean?
A steeper curve means the gap between long- and short-term yields has widened. After the July meeting, shorter yields fell while the 30-year yield rose. That pattern can signal reduced expectations for near-term tightening but greater concern about long-term inflation, fiscal supply or policy uncertainty.
Is a higher 30-year Treasury yield good or bad for banks?
It can be both. A steeper curve may improve lending margins, but rising yields reduce the market value of existing fixed-rate securities and can raise funding costs. The result depends on a bank’s deposits, asset duration, hedging and credit quality.
Why did Microsoft stock rise after earnings?
Microsoft reported 43% growth in Azure and other cloud services, more than 30 million paid Microsoft 365 Copilot seats, large contracted obligations and $19.6 billion of quarterly free cash flow despite heavy capital spending. Those figures gave investors evidence that AI infrastructure was producing current demand and cash returns.
Why did Meta stock fall even though revenue grew 28%?
Meta’s costs rose 55%, its operating margin fell to 31% from 43%, and free cash flow dropped to $784 million as capital spending surged. Revenue growth remained strong, but investors wanted clearer evidence about when new AI capacity would generate incremental cash flow.
Does Meta already make money from AI?
AI likely contributes to Meta’s advertising performance through recommendations, targeting and creative tools. The uncertainty concerns the return on the newest and largest spending program, including personal agents, future platforms and possible external compute services. Those revenue streams are less separately quantified.
Does a high Treasury yield mean technology stocks must fall?
No. Higher yields increase the discount rate applied to future cash flows, which is a valuation headwind. Stronger earnings expectations can offset that headwind. Microsoft’s sharp rally on July 30 showed that improved expected cash flows can dominate the effect of higher rates.
What was the latest U.S. inflation rate in the article’s research window?
The June PCE price index was 3.7% higher than a year earlier, and core PCE inflation was 3.3%. The headline index declined 0.1% from May, while the core index increased 0.1%.
Could the Fed cut rates later in 2026?
It could if inflation slows sustainably and the labor market weakens. A cut is not guaranteed. Persistent inflation, high oil prices or renewed wage pressure could keep rates unchanged or lead to another increase. The Fed did not promise a specific future decision.
What is the biggest risk to the AI investment boom?
The central financial risk is that companies build capacity faster than customers generate profitable demand. Rapid hardware depreciation, expensive power, model-efficiency gains and a higher cost of capital can reduce returns. The technology may still transform the economy even if some investments earn disappointing returns.
Final Assessment
The July 2026 market reaction mattered because it exposed two versions of the same credibility problem. The Federal Reserve stated that its 2% inflation target remained firm, but investors wanted a clearer connection between that commitment and the timing of policy action. Meta stated that enormous AI investment would create future opportunities, but investors wanted a clearer connection between that spending and incremental cash flow. In both markets, the burden shifted from promise to proof.
The strongest evidence supporting the Fed’s decision was the cooling labor market, the favorable monthly inflation reading and the uncertainty created by conflicting inflation measures. The strongest concern was that annual core PCE inflation remained at 3.3%, private domestic demand grew at a 3.9% annualized pace and three policymakers believed immediate tightening was necessary. Holding rates was defensible; failing to clarify the reaction function was costly.
The strongest evidence supporting Microsoft’s AI strategy was not one headline number. It was the combination of 43% Azure growth, more than 30 million paid Copilot seats, $678 billion of commercial obligations and nearly $20 billion of quarterly free cash flow after massive investment. The strongest concern is that capital spending is becoming structurally enormous and cloud margins are absorbing the cost.
The strongest evidence supporting Meta was its still-formidable advertising engine: 28% revenue growth, rising impressions, higher ad prices and a user base of 3.6 billion daily people. The strongest concern was the scale and speed of spending relative to observable new revenue, as shown by the collapse in free cash flow and the increase in the capital budget.
What changed on July 30 was the market’s tolerance for ambiguity. A 30-year Treasury yield above 5.2% raised the required return across the economy, while the Microsoft–Meta split showed which companies can currently meet that higher hurdle. The next phase will depend on whether inflation keeps cooling, whether fiscal supply continues to lift the term premium, and whether AI capital expenditure produces cash returns before the assets depreciate or financing becomes more expensive.
The most important indicators are now concrete: monthly inflation, unemployment, Treasury-auction demand, long-term inflation expectations, mortgage transmission, Azure utilization, Microsoft cloud margins and Meta free cash flow. Those measures will determine whether the July move was an overreaction—or an early warning that both central bankers and corporate executives are entering an era in which credibility must be demonstrated quarter by quarter.
Sources
- Federal Reserve: FOMC Statement, July 29, 2026
- Federal Reserve: Chair Kevin Warsh’s Opening Statement
- Reuters: Federal Reserve Decision and Market Reaction
- Reuters: Global Markets on July 30, 2026
- Bureau of Economic Analysis: Personal Income and Outlays, June 2026
- Bureau of Economic Analysis: Second-Quarter 2026 GDP Advance Estimate
- Bureau of Labor Statistics: Employment Situation
- Federal Reserve Bank of St. Louis: 30-Year Treasury Constant-Maturity Yield
- Federal Reserve: FOMC Statement, August 7, 2007
- Federal Reserve: FOMC Statement, September 18, 2007
- Congressional Budget Office: The Budget and Economic Outlook, 2026 to 2036
- Freddie Mac: Primary Mortgage Market Survey
- Microsoft: Fiscal 2026 Fourth-Quarter Results
- Microsoft: Fiscal 2026 Fourth-Quarter Earnings Call
- Meta Platforms: Second-Quarter 2026 Results
- Reuters: Meta Capital Spending and AI Buildout
- Qualcomm: Fiscal 2026 Third-Quarter Results
- Fortinet: Second-Quarter 2026 Financial Results
- Starbucks: Fiscal 2026 Third-Quarter Results
- Samsung Electronics: Second-Quarter 2026 Results
- U.S. Central Command: July 29 Strikes on IRGC Targets
- Reuters: Oil Prices and Middle East Shipping Risk
- U.S. Energy Information Administration: Short-Term Energy Outlook
Affiliate disclosure: Businessfinance.news may earn compensation from qualifying actions completed through selected links on this website, at no additional cost to the reader. Affiliate relationships do not influence our editorial reporting, analysis, or conclusions.