Wall Street begins the first full trading week of August with a strikingly different mix of signals from the one investors faced only days ago. Oil prices have fallen sharply on renewed hopes of diplomacy between the United States and Iran. Treasury yields have eased from recent peaks. Amazon and Microsoft have delivered results that strengthen the case that artificial-intelligence infrastructure spending is generating real revenue. At the same time, Apple’s post-earnings decline, a violent reversal in semiconductor shares and extraordinarily demanding valuations in several AI-linked stocks show that the market is no longer rewarding every company connected to the theme in the same way.
The clearest answer to the week’s dominant question is that an AI leadership rotation is plausible, but it is not yet confirmed. Investors appear more willing to reward the largest cloud platforms when they can connect capital expenditure to faster cloud growth, expanding backlogs and visible customer demand. They are simultaneously becoming less tolerant of hardware stocks whose prices assume uninterrupted growth, abundant financing and a smooth path from data-center construction to durable profits. Lower oil and bond yields can support that rotation by reducing inflation and valuation pressure, but both moves remain vulnerable to reversal.
This stock market outlook therefore rests on three tests rather than one bold prediction. First, the geopolitical risk premium embedded in crude oil must continue to recede. Second, incoming labor-market data must be soft enough to reduce pressure for a Federal Reserve rate increase without being so weak that it signals a serious deterioration in economic demand. Third, earnings from Palantir, Advanced Micro Devices, Sandisk, Western Digital, Uber and other major companies must show that the AI and technology cycle is broadening into revenue, cash flow and customer adoption rather than merely shifting expectations from one expensive stock to another.
Last updated: August 3, 2026, 4:45 a.m. Eastern Time. Market prices and geopolitical conditions were changing rapidly at the research cutoff.
Key Takeaways
- Market tone improved before Monday’s open: U.S. equity futures rose as Brent and West Texas Intermediate crude fell on hopes that diplomacy could reduce the risk of further disruption involving Iran and the Strait of Hormuz.
- AI leadership may be shifting: Amazon and Microsoft are being rewarded for stronger cloud growth and clearer monetization, while semiconductor shares have suffered from crowding, leverage, valuation concerns and profit-taking.
- Microsoft’s accounting change is narrower than some bullish interpretations suggest: extending estimated useful lives for data centers and office buildings from 15 to 25 years changes depreciation timing and lease classification, but Microsoft said the expected benefit to fiscal 2027 operating income would be minimal.
- Apple’s quarter was strong, but valuation mattered: revenue and earnings rose sharply, yet the shares fell after results as investors reassessed a premium multiple, tariff-related benefits and the durability of growth.
- Rates remain the constraint: the Federal Reserve kept its target range at 3.50% to 3.75% on July 29, and elevated long-term Treasury yields continue to pressure richly valued growth stocks.
- This week’s data are unusually important: June job openings are due Tuesday, while the July employment report is scheduled for Friday. Investors are looking for a “middle” outcome that cools inflation risk without pointing to recession.
- Technical price levels are scenarios, not facts about value: the livestream that prompted this analysis discussed tactical levels in SPY, Palantir, Amazon, Arm, AMD, Micron and Apple. Those levels can help explain trader positioning, but they should not be confused with verified forecasts or individualized investment advice.
Market Snapshot
What changed before the August 3 U.S. open
- S&P 500 futures were indicated about 0.6% higher and Nasdaq futures about 0.8% higher in early trading.
- Brent crude was down more than 4% near $84 a barrel, while WTI traded near $80 after a steeper earlier decline.
- Amazon was indicated sharply higher after earnings; Apple was indicated sharply lower; Microsoft was higher.
- The Federal Reserve’s target range remained 3.50% to 3.75% after its July 29 decision.
Original sources: Reuters’ August 3 global markets report and the Federal Reserve’s July 29 statement.
The Week in One Sentence
The market is attempting to trade lower oil, slightly lower yields and stronger hyperscaler earnings as a relief package for growth stocks, while still carrying the risk that Iran headlines, labor data or expensive AI valuations could reverse that relief in a matter of hours.
That is a more useful framing than a simple bullish-or-bearish call. The market enters the week with several forces moving in opposite directions. Oil’s decline reduces one source of inflation pressure, but crude remains far above levels seen before the latest Middle East escalation. Long-term Treasury yields have pulled back, but they remain high enough to challenge companies whose valuations depend on profits many years into the future. Cloud demand looks strong, but the amount of capital required to build AI infrastructure is unprecedented. Semiconductor demand is still expanding, but the stocks have demonstrated how quickly leveraged positioning can overwhelm an otherwise constructive fundamental story.
Each of those tensions can be true at the same time. Markets often rotate before the economic narrative becomes clean. A cloud-platform stock can rise because investors see better evidence of monetization even while a chip supplier falls because its valuation, positioning and financing assumptions have become too aggressive. A broad index can rally because oil drops even though individual energy shares decline. A weaker employment report can support rate-sensitive technology stocks if it reduces expected tightening, but the same report can hurt cyclicals if it signals that demand is deteriorating.
The practical task for investors is therefore not to identify a single headline that will “decide” the week. It is to understand which variables are linked, which are independent and which market moves would represent confirmation rather than noise.
Why the Market Opened August With a Different Tone
During July, investors repeatedly confronted the same uncomfortable combination: rising oil prices, rising long-term bond yields, heavy AI capital spending and stock valuations that left little room for disappointment. The result was a market that could celebrate strong revenue in one company, punish similar-looking results in another and reverse direction as soon as a geopolitical headline changed inflation expectations.
Monday’s early setup offered temporary relief on each of the first two pressures. Reuters reported that Brent crude fell more than 4% to roughly $83.88 a barrel as renewed U.S.-Iran talks raised hopes that the conflict could de-escalate and that shipping through the Strait of Hormuz could normalize. U.S. stock futures rose, while long-dated Treasury yields eased from the extreme levels reached in the previous week.
The immediate market logic is straightforward. A lower expected path for oil reduces the risk that gasoline, transportation and production costs will reinforce inflation. Lower inflation risk reduces pressure on the Federal Reserve to tighten policy. Lower expected policy rates and long-term yields increase the present value of future corporate earnings. That mechanism is especially powerful for technology and growth companies whose valuations are based on large profits expected years from now.
But the word “expected” matters throughout that chain. A one-day decline in crude does not guarantee lower inflation. Diplomatic statements do not guarantee a durable agreement. The Strait of Hormuz remains a critical route for global energy trade, and a renewed attack, shipping disruption or breakdown in negotiations could restore the risk premium quickly. Investors are not evaluating only the current spot price of oil; they are evaluating the probability distribution around future supply.
The same caution applies to stock-index futures. A positive indication before the open shows where marginal buyers and sellers were positioned at that moment. It does not prove that the session will close higher, much less that a durable uptrend has begun. Monday’s move is best understood as an attempt to reverse part of the geopolitical and rate shock that dominated late July.
Oil, Iran and the Inflation Channel
Oil is the most visible bridge between geopolitics and monetary policy. When crude rises because of a genuine supply interruption, the effect reaches far beyond energy producers. Airlines, transportation companies, chemical manufacturers and consumers face higher costs. Businesses may attempt to pass those costs through to customers. Households may reduce discretionary spending because more income is being used for fuel and utilities. Inflation expectations can rise even before official price indexes fully reflect the shock.
The reverse process can be supportive, but it is rarely symmetrical. A sharp drop in oil futures can improve market sentiment immediately, yet the economic benefit takes time to reach retail fuel prices, contracts and corporate margins. Companies may also be reluctant to lower prices quickly after absorbing a volatile cost increase. That means the stock market can react faster than the measured inflation data.
The current decline also contains two different components. One is geopolitical: a lower perceived probability of further U.S. and Israeli strikes on Iranian energy infrastructure and a greater perceived probability of negotiations. The other is supply policy: OPEC+ has continued to discuss and implement production adjustments. According to The Wall Street Journal’s market report, the group agreed to a modest increase in September output as it completed the rollback of earlier voluntary cuts.
Those forces do not necessarily point in the same direction over a longer period. A diplomatic breakthrough could remove part of the war premium. Higher OPEC+ supply could add downward pressure. Yet demand conditions, inventories, spare capacity and compliance with quotas will determine whether lower prices persist. A market move driven by headlines can overshoot if physical flows do not improve as quickly as traders expect.
For equities, the sector effects are uneven. Lower oil is generally helpful for transportation, consumer and rate-sensitive shares. It can be negative for producers whose expected cash flow is tied directly to crude prices. Banks and industrial companies may respond more to the effect on nominal growth and interest rates than to oil itself. Technology shares often benefit through the bond-yield channel rather than through direct energy costs, although data-center power consumption increasingly makes energy availability a strategic issue for the AI industry.
The important distinction is between an oil decline caused by improved supply conditions and one caused by collapsing demand. The first can be broadly supportive: lower inflation with resilient growth. The second can be a warning: lower oil because factories, freight networks and consumers are weakening. Current evidence points more toward geopolitical relief than demand destruction, but this week’s economic data will test that interpretation.
Rising Treasury Yields Remain the Core Valuation Constraint
Even after the early-Monday retreat, Treasury yields remain central to the stock market outlook. The Federal Reserve’s short-term policy rate influences financing conditions, but the 10-year and 30-year yields determine the discount rate used across mortgages, corporate bonds, infrastructure projects and equity valuation models. When long yields rise rapidly, companies with distant expected profits usually face the greatest pressure.
The mathematical reason is simple. A dollar of profit expected next year is worth more today than a dollar expected ten years from now. As the discount rate rises, the present value of the distant dollar falls more sharply. This does not mean that every high-growth stock must decline whenever yields rise; sufficiently strong earnings revisions can offset the effect. But the threshold for positive surprises becomes higher.
That tension is visible in the AI trade. A company can report 30% or 40% revenue growth and still fall if investors had priced in even faster growth, lower financing costs or a more immediate return on capital. Conversely, a company can rise on a modest earnings beat if its results reduce uncertainty about the sustainability of demand.
The Federal Open Market Committee kept the federal-funds target range at 3.50% to 3.75% on July 29 in a 9-to-3 vote. The unusually divided decision matters because it shows that policy debate is no longer centered only on when rates might fall. Some officials are sufficiently concerned about inflation or financial conditions to favor tighter policy.
Markets therefore need more than one favorable oil session. They need evidence that inflation pressure is receding, that wage growth is not reaccelerating, that the labor market is cooling gradually and that the economy can absorb current borrowing costs. If those conditions emerge, long yields could stabilize or decline and give growth valuations more room. If they do not, even excellent corporate results may struggle to overcome the discount-rate headwind.
The AI Trade Is Rotating, Not Disappearing
The most consequential claim in the livestream was that market leadership may rotate away from AI hardware and back toward hyperscalers: Microsoft, Amazon, Alphabet and Meta. That thesis is more credible than a blanket assertion that the AI trade is either alive or dead because it recognizes that the value chain contains businesses with different economics.
Hardware suppliers benefit when cloud platforms and enterprises build data centers. Revenue can accelerate rapidly when customers compete for scarce processors, memory and networking equipment. The strongest suppliers may enjoy pricing power and large order backlogs. Yet their demand is partly derived from the spending decisions of a relatively concentrated group of buyers. If investors question whether those buyers will continue spending at the same rate, hardware valuations can compress before reported revenue slows.
Hyperscalers face the opposite problem. They write the enormous checks. That reduces free cash flow in the near term and raises concerns about return on invested capital. But they also own the customer relationships, cloud platforms, software distribution, proprietary data and application layers through which AI services can be sold. If cloud growth accelerates and contracted revenue expands, the market may conclude that capital spending is not merely defensive but productive.
That creates a potential sequence. First, investors reward chipmakers because orders rise. Second, they become worried that hyperscalers are overspending. Third, evidence of cloud monetization improves. Fourth, capital flows rotate toward platforms whose revenue captures a broader portion of the AI stack. Hardware shares do not need to enter a fundamental decline for that rotation to occur; they only need to underperform after a period of extreme leadership.
The phrase “rotation” is also preferable to “replacement.” Amazon, Microsoft, Alphabet and Meta remain major customers of semiconductor, memory and networking suppliers. Stronger hyperscaler economics can eventually support more hardware demand. The trade can move from hardware to platforms and later back again as valuation, capacity and earnings expectations change. The market is reallocating the same AI theme across different profit pools.
What Amazon and Microsoft Changed in the Debate
Amazon and Microsoft gave investors two forms of evidence that had been missing from the AI capital-expenditure debate. Amazon showed faster cloud growth and operating leverage. Microsoft showed continued cloud demand, a huge contracted-revenue base and an accounting update that clarified how management expects to use long-lived infrastructure. The details are not identical, and they should not be combined into a single proof that every AI investment will earn an attractive return. But they make it harder to argue that the spending has produced no visible commercial response.
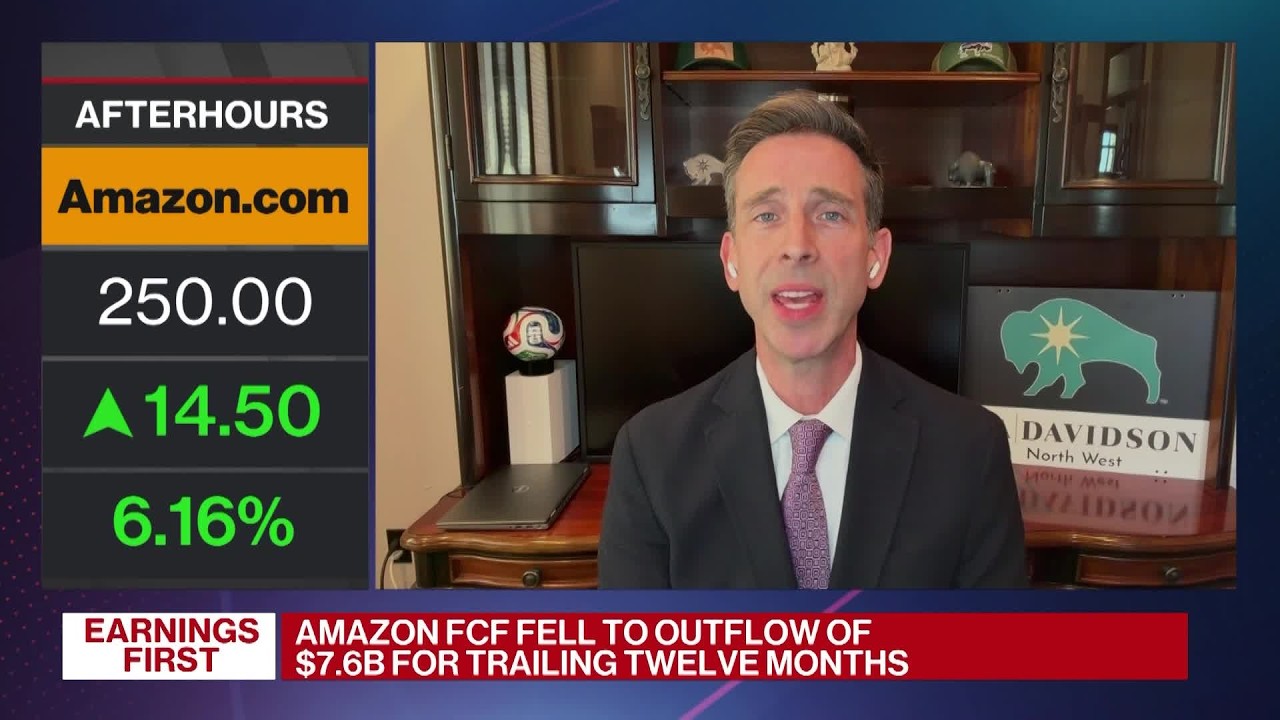
Amazon reported second-quarter net sales of $200.6 billion, up 20% from the prior-year period, while operating income rose to $27.5 billion. Amazon Web Services revenue increased 37% to $42.2 billion. That growth rate matters because AWS is the company’s highest-margin large segment and a central supplier of computing capacity for AI workloads.
The result suggested that demand was not merely shifting between providers. Enterprises and developers were consuming more cloud infrastructure at a pace strong enough to accelerate a business already operating at enormous scale. Investors rewarded that evidence, and Amazon shares were indicated roughly 15% higher in premarket trading on August 3.
Microsoft’s quarter offered a related signal. In its fiscal 2026 fourth-quarter release, Microsoft reported revenue of $90.0 billion, up 18%, and Microsoft Cloud revenue of $59.3 billion, up 27%. Azure and other cloud services revenue increased 43%. Those figures indicate that demand for cloud and AI capacity remained strong despite concerns about the cost of building it.
Yet both companies also illustrate why the debate is not resolved. Amazon’s trailing free cash flow deteriorated as infrastructure spending increased. Microsoft expects another very large year of investment. Revenue growth can validate demand without proving that every dollar of capital expenditure will earn a superior return. The crucial metrics will be utilization, pricing, incremental margins, contract duration, depreciation, energy cost and the speed at which capacity becomes productive.
Microsoft’s 15-to-25-Year Accounting Change: What It Actually Means
The most misunderstood detail in the livestream concerned Microsoft’s decision to extend the estimated useful lives of data centers and office buildings from 15 years to 25 years. The bullish interpretation presented in the video was that a longer life directly transforms the return on AI capital expenditure and materially lifts earnings. The accounting reality is more limited and more nuanced.
During Microsoft’s fiscal 2026 fourth-quarter call, Chief Financial Officer Amy Hood said that, effective at the start of fiscal 2027, the company would extend the estimated useful lives of data centers and office buildings to 25 years, reflecting operating history and expected use. She also said the change was expected to have a minimal benefit to fiscal 2027 operating income. The larger effect involved the classification of future data-center leases and the way reported capital expenditure would be presented. The company emphasized that the underlying investment plan had not changed. Those statements appear in Microsoft’s official earnings-call transcript.
That distinction matters. An accounting estimate does not change the cash already spent to build a facility. It does not reduce the electricity required to operate it. It does not guarantee that processors, networking equipment or cooling systems will remain economically competitive for 25 years. It changes the period over which certain qualifying assets are depreciated and can change whether particular lease arrangements are classified as finance leases or operating leases.
Accounting Fact Box
What Microsoft said—and did not say
- The estimated useful life of data centers and office buildings will increase from 15 years to 25 years beginning in fiscal 2027.
- Microsoft said the expected benefit to fiscal 2027 operating income would be minimal.
- The change affects depreciation timing and the classification of future data-center leases.
- Microsoft said its underlying infrastructure-investment expectations were unchanged even though the reported capital-expenditure figure changed.
- The change does not itself prove that all AI hardware within a data center will remain economically useful for 25 years.
Original source: Microsoft fiscal 2026 fourth-quarter earnings call.
How depreciation works in a simplified example
Suppose a company owns a building with a depreciable cost of $15 billion and no residual value. Under straight-line depreciation over 15 years, the annual depreciation expense would be $1 billion. Over 25 years, the annual expense would be $600 million. All else equal, the longer life would reduce annual expense by $400 million and increase reported operating income by the same pre-tax amount.
That example explains the direction of the accounting effect, but it does not establish Microsoft’s actual benefit. Microsoft owns a mix of land, buildings, servers, network equipment, leasehold improvements and other assets with different useful lives. The company’s guidance explicitly said the near-term operating-income benefit would be minimal. Investors should therefore resist applying a simple 15-to-25-year calculation to the entire AI spending program.
Depreciation is also noncash in the period when it is recognized, but the underlying capital expenditure is very real. Free cash flow reflects the cash outlay when assets are purchased or built. A slower depreciation schedule can raise reported accounting profit without improving current cash flow. Over the full economic life of the asset, total depreciation still equals the depreciable cost unless estimates change again or the asset is impaired or disposed of.
Why lease classification matters
Lease accounting can affect how infrastructure investment appears in reported capital expenditure. A finance lease is treated more like the purchase of an asset financed over time. An operating lease is treated differently in financial statements and cash-flow presentation. Extending an expected asset life can change tests used to determine whether a lease covers a major portion of that life.
Microsoft indicated that this classification effect was the main reason its reported capital-expenditure expectation changed from roughly $190 billion to approximately $175 billion, while the underlying investment plan remained the same. In other words, the lower reported number did not mean that Microsoft had canceled $15 billion of planned infrastructure. It meant that part of the spending would be classified differently.
This is precisely why investors must separate physical investment, accounting presentation and economic return. A lower capital-expenditure headline can look bullish if read in isolation. A longer useful life can look like a large earnings benefit if applied mechanically. Management’s own explanation shows that neither conclusion is sufficient.
What the change may still signal
Although the accounting effect has been overstated in some commentary, the change can carry information about management’s operating expectations. Microsoft would not ordinarily extend a useful-life estimate without evidence that the underlying buildings and facilities can remain in service longer. Data-center shells, land, electrical connections, power contracts and cooling infrastructure may have long economic lives even if servers and accelerators are replaced many times.
That can support a more constructive view of the infrastructure layer. A data center is not a single computer. It is a complex site whose most durable components can support multiple generations of hardware. If Microsoft can reuse the buildings, power and network infrastructure through repeated equipment upgrades, the economic life of the facility can exceed the life of the chips installed today.
Still, the change is not evidence that obsolescence risk has disappeared. AI workloads are evolving quickly. Power density, cooling technology, networking architecture and chip packaging may require costly retrofits. Facilities in constrained locations may become more valuable because of power access, while others may prove less efficient than newer designs. The correct conclusion is that Microsoft expects longer use of certain assets, not that every AI investment now has a guaranteed 25-year payoff.
Amazon’s AWS Result Strengthens the Hyperscaler Thesis
Amazon’s earnings provide the strongest near-term evidence for the rotation toward hyperscalers because they combine faster cloud growth with a direct line from infrastructure investment to customer demand. AWS is not merely a collection of data centers. It is a service platform that sells computing, storage, databases, analytics, security and AI tools to customers that generally prefer to rent capacity rather than build it themselves.
The 37% increase in AWS revenue to $42.2 billion implies an annualized run rate of almost $169 billion. At that scale, acceleration is difficult. It requires growth from existing customers, new workloads, additional capacity and pricing that holds up despite intense competition from Microsoft Azure, Google Cloud and specialized providers. The result therefore supports the argument that the AI buildout is creating commercial demand rather than only speculative capacity.
Amazon also reported total operating income of $27.5 billion, up from the prior-year period. The company’s retail and advertising operations matter to that figure, but AWS remains the central profit engine. Faster cloud growth can improve the economics of the entire company because incremental cloud revenue tends to carry higher margins than first-party retail sales.
The market’s enthusiastic response nevertheless creates a new test. A 15% premarket jump can rapidly incorporate a large amount of future optimism. After such a move, the question is no longer whether the quarter was good; it is whether future results can justify the higher valuation. Investors will focus on capacity availability, backlog conversion, AI service adoption, depreciation, electricity and network costs, and the relationship between capital expenditure and free cash flow.
Amazon’s trailing free cash flow had turned negative as capital investment accelerated. That does not automatically indicate a weak business. A company can generate strong operating cash flow and still report negative free cash flow when it deliberately invests at extraordinary scale. But it means shareholders are accepting lower current cash generation in exchange for expected future returns. The burden of proof therefore shifts to utilization and margins.
This distinction is central to the hyperscaler rotation. Investors are not suddenly indifferent to capital spending. They are becoming more selective about the evidence supporting it. Amazon’s cloud acceleration gave the market a reason to believe that at least part of the spending is meeting current demand. Future quarters must show that the demand remains profitable and that customers do not simply move workloads among providers in response to temporary capacity or pricing incentives.
Why Amazon’s result matters beyond Amazon
AWS is a major buyer of processors, memory, networking equipment and power infrastructure. Stronger AWS growth can therefore support the revenue outlook for suppliers even if their stocks temporarily underperform. It also raises the competitive pressure on Microsoft and Google to keep building capacity. That is why a platform-led rally does not necessarily imply a collapse in semiconductor fundamentals.
The result also tells investors something about enterprise behavior. Companies appear willing to commit more workloads to the cloud despite elevated interest rates and uncertain macroeconomic conditions. Some of that spending may replace older information-technology budgets rather than represent entirely new demand. Even so, cloud providers gain when customers consolidate workloads, modernize applications or add AI services to existing contracts.
The key risk is that the industry could mistake capacity scarcity for permanent pricing power. When infrastructure is constrained, customers may accept higher prices or sign longer contracts. As supply expands, competition can intensify and utilization may normalize. The hyperscalers’ scale, software ecosystems and customer relationships provide defenses, but they do not eliminate the possibility of lower returns on the marginal data center.
Apple: Strong Quarter, Valuation Reset
Apple’s post-earnings decline is a useful reminder that market reactions are relative to expectations and valuation, not simply to whether revenue increased. Apple reported fiscal third-quarter revenue of $109.4 billion, up 16%, and diluted earnings per share of $2.02, up 29%. The company said iPhone, Mac and Services each set June-quarter records.
Those are objectively strong results. They do not resemble a conventional earnings disappointment. Yet Apple shares were indicated about 7% lower before the August 3 open, near $309, after having carried a valuation of roughly 35 times trailing earnings in the early market data. The decline suggests that investors were evaluating the quality and repeatability of the quarter, not merely the headline growth rates.
Apple disclosed that gross margin benefited by roughly two percentage points from tariff refunds, while earnings per share included an estimated $0.11 benefit. Excluding temporary or unusual benefits, the underlying quarter was still strong, but the comparison becomes less spectacular. Investors also weighed the mix of iPhone demand, Services growth, product cycles and the company’s approach to AI spending.
For much of the recent market cycle, Apple’s relatively restrained infrastructure spending made it a defensive choice within mega-cap technology. When investors feared that Microsoft, Amazon, Alphabet and Meta were committing too much capital to uncertain AI returns, Apple’s enormous cash generation and lighter capital intensity appeared attractive. That relative advantage can reverse when cloud peers begin to show stronger monetization. The same characteristic that once looked prudent can begin to look like slower participation in a major technology transition.
This does not mean Apple lacks an AI strategy. The company controls a vast installed base, a valuable operating-system ecosystem, custom silicon and direct distribution to consumers. It can integrate AI features into devices and services without matching the hyperscalers dollar for dollar in public cloud infrastructure. The open question is whether that model can produce enough incremental revenue and retention to justify a premium valuation while competitors build broader AI platforms.
Earnings Fact Box
Apple fiscal third-quarter 2026
- Total revenue: $109.4 billion, up 16% year over year.
- Diluted earnings per share: $2.02, up 29%.
- iPhone revenue: $54.3 billion.
- Services revenue: $30.7 billion.
- Gross margin: 50.1%, including an estimated benefit from tariff refunds.
Original sources: Apple’s earnings release and Apple’s consolidated financial statements.
Why a good quarter can produce a falling stock
There are at least five reasons a stock can fall after strong reported results. Expectations may have been higher than the published consensus. The quality of earnings may depend partly on temporary benefits. Guidance may imply slower growth. The valuation may leave no margin of safety. Or investors may rotate toward companies with a more attractive combination of growth and price.
Apple appears exposed to several of those mechanisms. Its brand, balance sheet and installed base justify a premium to many hardware companies, but a premium is not unlimited. At a high multiple, even a modest change in the expected growth rate can cause a large change in fair-value estimates. That sensitivity increases when Treasury yields are elevated because the opportunity cost of holding a richly valued stock rises.
The result also undercuts the idea that avoiding capital expenditure is automatically superior. Low capital intensity can support free cash flow, but it can also reflect fewer opportunities to reinvest at attractive rates. High capital intensity can destroy value if returns are poor, but it can create substantial value if infrastructure supports durable growth. The market is trying to distinguish productive spending from defensive underinvestment, and the answer will differ by company.
Semiconductors: Deleveraging Versus Fundamentals
The livestream argued that the semiconductor selloff was primarily a deleveraging event rather than a fundamental break in the AI cycle. There is meaningful evidence for that interpretation, but the word “primarily” should be used carefully. Crowded positioning and forced liquidation can amplify declines. They do not explain why investors became willing to sell at the first sign of weakness.
AI-linked semiconductor shares had become one of the most concentrated trades in global markets. Strong earnings, capacity shortages and repeated upward revisions attracted long-only funds, hedge funds, retail traders and leveraged exchange-traded products. When many investors own similar positions for similar reasons, the market can appear stable until the marginal buyer disappears. A modest decline then triggers risk limits, option hedging, margin calls and systematic selling.
South Korea offered a particularly clear example because its market contains globally important memory and semiconductor companies and because leveraged retail participation had become substantial. Reuters reported a sharp KOSPI reversal, stress in leveraged single-stock products and forced selling as positions were unwound. Separate reporting described hedge-fund deleveraging and the liquidation of heavily leveraged accounts. Those dynamics can push prices below levels justified by near-term earnings alone.
Yet the selloff also reflected genuine fundamental questions. Investors are debating the durability of AI infrastructure budgets, the pace at which new supply will reduce scarcity, competition from Chinese technology companies, the risk of export controls, customer concentration and the possibility that hyperscalers will design more custom silicon. A leveraged position becomes vulnerable because the underlying asset is expensive or uncertain, not merely because leverage exists.
The most balanced conclusion is that fundamentals and positioning reinforced each other. Concerns about returns on AI spending weakened conviction. Weakening conviction initiated profit-taking. Profit-taking exposed leverage. Forced selling deepened the decline. The resulting price move may then create opportunities for long-term investors if earnings remain intact, but it can also signal that valuation assumptions were too aggressive.
Why memory stocks are especially volatile
Micron, Sandisk and other memory-related companies sit at the intersection of a structural AI demand story and one of the most cyclical industries in technology. AI servers require large amounts of high-bandwidth memory and storage, creating genuine demand. But memory markets have historically moved through shortages and gluts because manufacturers make large, slow-moving capacity decisions.
When demand exceeds supply, prices can rise rapidly and margins expand. Producers respond by increasing investment. Customers may double-order to secure supply. Eventually new capacity arrives, inventories normalize and pricing weakens. The cycle can turn before reported earnings peak because stocks discount future conditions.
That history explains why a strong current earnings trajectory does not eliminate downside risk. A memory company can look inexpensive on peak earnings precisely because investors expect those earnings to normalize. Conversely, it can look expensive near a cyclical trough when profits are temporarily depressed. Simple price-to-earnings comparisons are therefore less informative without an assessment of where the industry sits in the cycle.
AI demand may make this cycle structurally stronger than past personal-computer or smartphone cycles, but it does not abolish supply economics. High-bandwidth memory is technically demanding, and advanced packaging constraints can limit supply. Those barriers support pricing. At the same time, extraordinary profits create powerful incentives to add capacity and improve yields.
AMD and the burden of expectations
Advanced Micro Devices enters its August 4 report with a strong fundamental record and a demanding valuation. In its first-quarter 2026 results, AMD reported revenue of $10.3 billion and non-GAAP earnings per share of $1.37. The company has benefited from data-center demand, AI accelerators and continued competition in central processors.
The challenge is that investors are not asking merely whether AMD can grow. They are asking how quickly its AI accelerator revenue can scale, whether software adoption is improving, how gross margins will develop and whether the company can win enough share to justify a valuation that, in early August market data, was far above the broader market’s.
AMD’s position is strategically attractive because customers want alternatives to a single dominant supplier. Hyperscalers also have incentives to diversify supply and negotiate better economics. But alternatives must deliver software compatibility, performance, availability and a credible product roadmap. Hardware specifications alone do not create an ecosystem.
The earnings reaction will therefore depend on forward evidence: customer deployments, shipment timing, margins, supply and management’s outlook. A strong historical quarter can be overshadowed by any sign that expectations for the next generation of products have moved ahead of execution.
Crowding, Leverage and Forced Liquidation in South Korea
The South Korean market matters to U.S. investors because it provides a live demonstration of how global AI positioning can transmit shocks across borders. Korea is home to critical memory-chip producers, sophisticated retail investors and a market structure in which leveraged products can magnify both gains and losses.
When semiconductor shares rose, leveraged accounts and single-stock exchange-traded products expanded the buying power behind the move. The mechanism works smoothly as long as prices rise or remain stable. When prices fall, collateral values decline. Brokers demand more cash or reduce positions. Funds targeting a fixed level of volatility or leverage must sell. Option dealers adjust hedges. Each response can create additional downward pressure.
Reuters reporting in July described hundreds of thousands of leveraged Korean accounts facing margin calls and liquidations. It also documented hedge-fund losses and rapid reductions in exposure during the AI selloff. Those facts support the livestream’s contention that the move was not simply a calm reassessment of long-term earnings.
However, deleveraging does not establish a floor. Forced selling can make an asset cheaper, but the market still needs willing buyers. Those buyers must decide whether the new price compensates for earnings risk, policy risk and the possibility that more leverage remains hidden. A first rebound can be short covering rather than durable accumulation.
The international dimension also complicates the leadership-rotation thesis. U.S. hyperscalers rely on Asian supply chains. A severe equity or credit shock in a major manufacturing country can eventually affect financing, capital spending and production. What begins as a valuation correction can become an economic event if it persists.
The Earnings Calendar: What Each Company Must Prove
This week’s earnings are not important merely because several popular stocks are reporting. They cover distinct parts of the economy and can test whether the market’s improved tone is broad or narrowly concentrated in mega-cap cloud companies.
Palantir: Can growth justify the valuation?
Palantir is scheduled to report second-quarter results after the market closes on August 3, according to the company’s investor-relations announcement. The central issue is not whether demand for AI software exists. It is whether Palantir can convert that demand into durable growth at a scale and margin that justify one of the market’s richest valuations.
Investors will examine U.S. commercial growth, government contracts, remaining deal value, customer expansion, operating margin and stock-based compensation. Palantir’s appeal rests on the claim that its software can move AI from experimentation into operational decisions. That is a valuable position if deployments become embedded in customer workflows. It is less valuable if pilot programs fail to expand or if customers can reproduce similar capabilities with cloud-platform tools.
The stock’s sensitivity to earnings is amplified by its multiple. When a company is valued for exceptional performance, meeting ordinary expectations may not be enough. Management must either raise the expected path of revenue and cash flow or reduce uncertainty around it. A sharp move in either direction would therefore say as much about prior expectations as about the quarter itself.
AMD: Competition, supply and software
AMD is due to report after the close on August 4. Investors will be looking for evidence that data-center and AI accelerator growth remains strong after the semiconductor selloff. Guidance will probably matter more than the reported quarter because the stock reflects expectations for future products and customer deployments.
Three questions are especially important. Is supply sufficient to meet demand? Is AMD’s software ecosystem reducing friction for customers? And can the company expand without sacrificing gross margin? Positive answers would support the view that the recent decline was largely position-driven. A cautious outlook would strengthen the argument that the market had begun to discount a real slowdown.
Sandisk and Western Digital: the memory cycle
Sandisk is scheduled to report on August 5, with details available through its investor-relations site. Western Digital is also expected to report that day, according to its investor calendar. Together, the reports can clarify pricing, inventory and demand across flash memory and storage.
Investors will want to know whether AI-related storage demand is broadening, whether enterprise customers are building inventory and whether supply discipline remains intact. Because memory earnings can change quickly, management commentary on pricing and capital expenditure can have a larger effect than the latest quarter’s profit.
Uber: a test of consumer and business activity
Uber will report on August 5. Its results provide a different signal from the AI-heavy companies. Trips, gross bookings, delivery activity, advertising and driver supply can reveal whether consumer and business mobility remain resilient under high borrowing costs.
Uber also represents the market’s broader preference for profitable technology growth. Investors will examine free cash flow and margin progression, not merely bookings. Strong results would support the idea that economic demand remains healthy even as the labor market cools. Weakness could complicate the “soft landing” narrative.
Disney, Eli Lilly, CVS and the breadth of earnings
Results from Disney, Eli Lilly, CVS Health and other large companies will test sectors beyond technology. Disney can provide evidence on streaming economics, advertising, theme-park demand and consumer discretionary spending. Eli Lilly can update investors on pharmaceutical demand, manufacturing capacity and the economics of major metabolic treatments. CVS can illuminate healthcare utilization, insurance costs and pharmacy trends.
A healthy market does not require every company to beat expectations, but it benefits when earnings strength broadens. If only a few cloud platforms rise while consumer, healthcare and industrial companies weaken, index gains may conceal a narrowing foundation. Breadth, revisions and cash-flow quality will therefore matter as much as the headline index level.
Jobs Data and the Federal Reserve’s Reaction Function
The economic calendar may ultimately matter more than any single earnings report because it will influence the path of interest rates across the entire market. The Federal Reserve has already shown that inflation risks remain serious enough to keep policy debate unusually hawkish. Investors now need labor data that reduce inflation pressure without signaling an abrupt contraction.
The first major release is the Job Openings and Labor Turnover Survey for June, scheduled for Tuesday, August 4, at 10:00 a.m. Eastern Time. The Bureau of Labor Statistics’ JOLTS page confirms the release time. Job openings measure positions employers are actively trying to fill. Hires indicate whether vacancies are turning into employment. Quits can provide insight into worker confidence because employees are generally more willing to leave voluntarily when they expect other opportunities.
The May report showed approximately 7.6 million openings. The level remained substantial, but the composition and direction matter more than a single number. A gradual decline in openings with stable hiring and limited layoffs would support the soft-landing case. A sharp fall in openings combined with weaker hiring could signal that employers are pulling back faster than the headline unemployment rate suggests.
Friday’s July employment report is the week’s largest macroeconomic event. The BLS release calendar schedules it for August 7 at 8:30 a.m. Eastern Time. Investors will assess payroll growth, the unemployment rate, average hourly earnings, labor-force participation, hours worked and revisions to prior months.
Revisions deserve special attention. Initial payroll estimates are based on incomplete survey responses and are updated as more data arrive. A seemingly healthy current number can be undermined by large downward revisions. Conversely, a modest headline increase may look better if prior months are revised higher. The market often reacts to the full package rather than the first number displayed on a screen.
Why investors want a “middle” employment report
A very strong employment report could reinforce expectations that the Federal Reserve will increase rates or keep policy restrictive for longer. That would place upward pressure on Treasury yields and create a valuation headwind for growth stocks. Strong wage growth would be particularly important because services inflation is closely connected to labor costs.
A very weak report would create a different problem. It could reduce expected rate increases, but it might also suggest that corporate demand, consumer income and credit quality are deteriorating. Markets sometimes celebrate weak data when the primary concern is inflation, but they can quickly reverse if weakness begins to look recessionary.
The ideal outcome for the current market narrative is moderate payroll growth, stable participation, slower wage pressure and no alarming rise in layoffs. That combination would support the idea that inflation can cool without a major contraction. It would also give the Federal Reserve more flexibility.
Oil changes how the same employment number may be interpreted. If crude continues to fall, a weaker report could be viewed as disinflationary and supportive for bonds. If oil rebounds sharply because negotiations fail, the market could face an unfavorable combination of weaker growth and higher inflation. That is why the jobs report cannot be analyzed in isolation.
Other economic releases
Factory orders, the ISM services index, the trade balance and weekly jobless claims provide additional evidence. Factory orders can reveal the direction of manufacturing and business investment. ISM services is particularly important because services represent the largest part of the U.S. economy and because service prices and employment have significant implications for inflation.
The trade balance affects estimates of gross domestic product and can reflect changes in domestic demand, currency values and global supply chains. Weekly claims offer a more timely signal of layoffs than the monthly employment report, although they can be noisy and affected by seasonal factors.
No single release will provide a complete answer. The market will compare them. A decline in openings, a stable services index and moderate claims would tell a different story from falling openings, contracting services and rapidly rising claims. The direction of revisions and subcomponents can be more informative than whether a headline beats a consensus estimate by a small amount.
Short-Squeeze Thesis: Possible, but Easy to Overstate
The livestream also argued that elevated short interest could accelerate a market rally if the narrative around oil and AI capital spending improves. The mechanism is valid. Investors who sell stocks short must eventually buy shares to close their positions. If prices rise sharply, risk limits and margin requirements can force that buying to occur quickly, adding fuel to the advance.
However, broad-market short-interest statistics require careful interpretation. Reported short interest may include hedges against long portfolios, market-making activity, arbitrage and positions that are not straightforward bearish bets. A fund may be long a basket of technology stocks and short an index future to reduce market exposure. Closing the short does not necessarily represent a new bullish view.
Aggregate figures also depend on the denominator and instrument. Short interest as a percentage of float in individual stocks is different from net futures positioning, options dealer exposure or exchange-traded-fund short interest. Combining those measures can exaggerate the amount of directional bearishness waiting to be squeezed.
A short squeeze is most likely when three conditions coincide: a crowded short position, a catalyst that changes expected fundamentals and limited available supply of shares. Broad indexes have enormous liquidity, so squeezing them is more difficult than squeezing an individual company with a small float. Index rallies can still be amplified by hedging and systematic flows, but the process is less dramatic than in a classic single-stock squeeze.
The current setup contains possible catalysts: lower oil, easing yields and strong cloud earnings. It also contains natural resistance: high valuations, geopolitical uncertainty and an active Federal Reserve debate. Short covering could help the market move through nearby technical levels, but sustained gains require long-term buyers willing to hold after the forced buying ends.
The Livestream Watchlist Under a Journalistic Lens
The original livestream presented specific entry levels, stop losses and targets for several securities. Those details are useful as a record of retail-trader positioning and as examples of how technical traders convert a macro thesis into a plan. They are not verified predictions, and they should not be treated as personalized instructions.
Technical levels are conditional. They can matter because many market participants watch the same prior highs, lows, moving averages and gaps. When enough orders cluster around a level, it may influence short-term price behavior. Yet a level has no independent economic force. A new earnings disclosure, geopolitical event or data surprise can overwhelm it immediately.
At approximately 4:43 a.m. Eastern Time on August 3, premarket indications placed SPY near $747, QQQ near $688, Amazon near $272, Apple near $309, Microsoft near $465, AMD near $476, Palantir near $123, Arm near $240 and Micron near $823. These were not official closing prices and could change substantially before regular trading.
SPY: the index scenario
The livestream identified the mid-$750s as a potential upside area for SPY if oil continued to decline, U.S.-Iran talks held and earnings supported risk appetite. It also highlighted the mid-$740s as an important support region. From a technical perspective, that is a coherent scenario because prior gaps and local highs often attract attention.
From a fundamental perspective, the path depends on the variables already discussed. A move above resistance accompanied by improving market breadth, lower yields and positive earnings revisions would provide stronger confirmation than a move driven only by overnight futures. A break below support during rising oil and yields would weaken the relief narrative.
Neither outcome would determine the market’s long-term value. SPY reflects hundreds of companies, and its level is heavily influenced by the largest constituents. Investors should distinguish index momentum from the health of the median stock.
Palantir: earnings-event risk dominates the chart
The livestream discussed support around $123 and a possible move toward the upper $120s before earnings, with the intention of avoiding exposure through the report. That distinction is sensible as a description of event risk: a short-term technical trade and an earnings investment are different decisions.
Once Palantir reports, prior technical levels may lose relevance if guidance materially changes expectations. A revenue-growth surprise, contract announcement or margin shift can create a gap that bypasses nearby orders. The stock’s high valuation magnifies that risk because small changes in long-term assumptions can produce large price moves.
For fundamental readers, the more durable questions are customer growth, expansion within existing accounts, government and commercial mix, cash generation and stock-based compensation. The chart may reveal where traders are positioned; the financial statements reveal whether the business is delivering.
Amazon: post-earnings momentum versus gap risk
The livestream viewed the area around the low $270s as potential support after Amazon’s earnings surge and discussed the possibility of a move toward the upper $270s or a new high. The bullish case is supported by AWS acceleration and operating-income growth.
The risk is that a large gap creates a wide difference between the current price and the prior trading range. Early buyers may take profits. Investors who owned the stock before earnings may rebalance. Options hedging can amplify intraday movement. A strong quarter can produce follow-through, but it can also produce an initial overshoot followed by consolidation.
The most informative signal would be whether the stock holds a substantial portion of its earnings gain while analyst estimates and institutional ownership adjust. A one-session spike is less important than the market’s willingness to maintain a higher valuation after the details are absorbed.
Arm: strategic value, valuation and volatility
The livestream discussed a bearish tactical view in the $240 area and a possible longer-term interest zone closer to $200 or below. The reasoning appeared to be that Arm had become overextended and was vulnerable to the broader semiconductor unwind.
Arm occupies a valuable position because its instruction-set architecture and intellectual property are used across mobile, embedded and increasingly data-center markets. Its asset-light licensing model differs from a manufacturer that must build fabrication plants. That can support high margins and strategic importance.
Valuation remains the counterweight. A high multiple assumes rapid royalty growth, expanding market share and sustained pricing power. It also exposes the stock to any slowdown in semiconductor sentiment. Technical traders may focus on gaps and support; long-term analysis should focus on royalty economics, contract terms, end-market growth and competition from open architectures.
AMD: earnings make the short-term setup binary
The livestream proposed a tactical bearish scenario from the upper $470s or low $480s toward the mid-$450s before the earnings report. Whether that scenario works depends heavily on market positioning and the timing of the trade. Once AMD reports, guidance and product commentary can overwhelm the chart.
AMD’s fundamental opportunity is substantial, but the stock price embeds high expectations. That combination can create asymmetric reactions: a modest miss can hurt more than a modest beat helps. Investors should also be cautious when interpreting trailing price-to-earnings ratios for a company undergoing rapid product-mix change because forward earnings may differ dramatically from historical earnings.
Micron: cyclical earnings and extreme price movement
The livestream expected a rebound followed by renewed weakness in Micron, with attention on a possible fade from the mid-$800s toward the mid-$700s. The stock’s approximately 6% premarket decline on August 3 illustrated the volatility surrounding memory shares.
Micron can benefit from high-bandwidth-memory demand, but its earnings remain tied to supply discipline and pricing. A low-looking multiple can be misleading near a cyclical peak. Investors should compare current profitability with through-cycle margins, capital expenditure, inventories and customer concentration.
Technical levels may help identify where buyers previously entered, but the larger question is whether memory pricing expectations are rising or falling. That can change quickly as capacity, yields and customer orders evolve.
Apple: valuation support versus fundamental support
The livestream identified a bearish scenario if Apple traded below roughly $310, with the upper $290s as a possible destination. The premarket indication near $309 placed the shares close to that threshold, but the level itself does not establish that the stock is overvalued or destined to fall.
Apple has powerful fundamental supports: recurring Services revenue, customer loyalty, a large installed base, buybacks and exceptional cash generation. It also faces valuation risk, product-cycle risk, regulatory scrutiny and questions about its AI strategy. A technical break can attract momentum sellers, but long-term demand will be determined by earnings and cash flow.
The most relevant post-earnings question is whether analysts reduce future estimates or merely reduce the valuation multiple applied to those estimates. A multiple reset can occur even when the business outlook remains positive.
Scenario Matrix
Three plausible paths for the week
| Scenario | What would support it | Likely market implications | What would disprove it |
|---|---|---|---|
| Constructive rotation | Iran talks continue, oil remains near or below $80, yields ease, cloud and software earnings hold up, labor data cool gradually. | Hyperscalers and selected software shares lead; semiconductors stabilize; market breadth improves; short covering adds momentum. | Oil rebounds, yields rise or major earnings guidance disappoints. |
| Mixed consolidation | Diplomacy remains uncertain, data are close to expectations and earnings differ sharply by company. | Indexes trade sideways; large gaps reverse; leadership rotates daily; stock selection matters more than broad direction. | A decisive geopolitical, inflation or earnings shock breaks the range. |
| Risk-off reversal | Negotiations fail, oil rises, labor data revive hike expectations or AI guidance weakens. | Long yields climb; richly valued technology underperforms; energy may outperform the index; leveraged positions unwind again. | Crude and yields retreat quickly while earnings revisions remain positive. |
These are editorial scenarios, not forecasts or recommendations. Their purpose is to identify evidence that would confirm or weaken competing interpretations.
How Investors Can Read the Week Without Trading Every Headline
A week filled with geopolitical reports, economic releases and earnings can encourage constant reaction. That approach often confuses activity with analysis. A more disciplined process is to identify a small number of variables, decide what evidence would change the thesis and avoid treating every price move as new information.
First, separate levels from trends. Oil falling 6% in one session is a level change. A sustained decline supported by improved shipping conditions, inventories and diplomacy is a trend. Treasury yields declining for several hours is a level change. A sequence of lower inflation readings and softer labor data that changes the expected policy path is a trend.
Second, distinguish reported results from forward implications. Amazon’s AWS growth is a confirmed result. Whether that growth will continue at the same rate is a forecast. Microsoft’s useful-life change is confirmed. Whether it improves the economic return on AI infrastructure is an analytical judgment.
Third, compare stock reactions with estimate revisions. A stock can rise because short sellers cover even if analysts reduce long-term forecasts. It can fall because the valuation compresses even if estimates rise. The combination of price and estimates reveals more than price alone.
Fourth, watch breadth. A rally led by four mega-cap stocks can lift the S&P 500 while many companies fall. Broader participation from industrials, financials, healthcare and consumer shares would indicate greater confidence in the economy. Narrow leadership may still generate index gains, but it is more vulnerable to disappointment in the largest constituents.
Fifth, respect event risk. Holding a position through earnings, an employment report or a geopolitical deadline is different from trading ordinary daily volatility. Prices can gap beyond any intended exit level. Options can lose value through volatility changes even when the underlying stock moves in the expected direction. Leverage magnifies both errors and timing risk.
What Retail Traders Should Verify Before Trusting AI Trading Tools
A substantial portion of the livestream promoted a commercial trading platform and made claims about member profitability, an AI trade-plan generator, exchange data and historical accuracy. Those statements were promotional claims made by the provider. They were not accompanied in the broadcast by an independent audit, a complete methodology, a representative performance record or sufficient information to verify outcomes.
That does not prove the tools are ineffective. It means viewers should apply the same diligence they would use with any financial product. Terms such as “AI,” “institutional data,” “confidence score” and “accuracy” can sound precise while concealing important assumptions.
Ask how accuracy is defined
A claim that a trade-plan tool is more than 70% accurate is impossible to evaluate without a definition. Does accuracy mean the first profit target was reached before the stop loss? Does it include transaction costs and slippage? Are expired or incomplete plans counted? Can users choose among multiple targets after the fact? Is the percentage based on every generated plan or a selected subset?
The time horizon also matters. A scalp, day trade, swing trade and long-term position have different risk profiles. Combining them into one accuracy statistic can be misleading. A system can have a high win rate and still lose money if losses are much larger than gains. Expected value, drawdown, risk-adjusted return and consistency are more informative than win rate alone.
Ask whether results are hypothetical or executed
Backtests and generated plans are not the same as audited customer results. A backtest may assume execution at a price that was briefly available but difficult to obtain. It may exclude fees, market impact, borrowing costs and taxes. It may be optimized using the same data on which performance is reported.
Executed results are more persuasive, but they also require context. The performance of a few successful users does not describe the median user. Testimonials are selected by nature. A complete assessment would include the distribution of gains and losses, account sizes, leverage, withdrawals, time periods and the percentage of users who stopped trading.
Understand what market-data feeds can and cannot show
Exchange order-book data can provide valuable information about displayed bids, offers and market depth. Some products provide greater detail than standard retail feeds. However, descriptions of “Level III” access vary, and the ability to identify every institutional order, every hidden order or the true motivation behind an order should not be assumed without technical documentation.
Iceberg and hidden liquidity can sometimes be inferred or identified through exchange-specific order attributes and repeated execution patterns. But no data feed provides perfect knowledge of all market participants’ intentions. Large institutions use multiple brokers, venues, algorithms, derivatives and off-exchange systems. An order that appears institutional may be a hedge, an arbitrage leg or a liquidity-provision strategy rather than a directional investment.
Investors should request the exact exchange product name, entitlement terms, latency, venue coverage and documentation explaining how the platform classifies orders. They should also determine whether statements about regulation refer to the data vendor, the broker, the platform or the individual providing trading education. Those are distinct relationships.
Check conflicts and incentives
A free livestream can provide useful education while also functioning as customer acquisition. The speaker may benefit when viewers purchase a membership, data subscription or coaching service. That incentive does not invalidate the market analysis, but it should be disclosed and considered.
The safest approach is to separate the analytical claim from the sales claim. “Oil is falling and yields are easing” can be checked against market data. “This tool gives retail traders a massive advantage” requires independent evidence. “Members reported profits in chat” is a description of selected comments, not a statistically representative result.
Viewers should also read refund, renewal and cancellation terms; understand whether market data cost extra; verify regulatory registrations where applicable; and never assume that access to a tool removes the possibility of loss. A system that helps structure decisions can still produce losing trades, particularly when markets gap or historical relationships change.
Market Breadth Will Reveal Whether the Rotation Is Healthy
One of the easiest ways to misread an index rally is to assume that a rising S&P 500 means most companies are improving. The index is weighted by market capitalization, so a small number of enormous technology companies can lift the headline level even while a majority of constituents are flat or declining. That structure makes market breadth an essential test of the week’s constructive scenario.
Breadth can be measured in several ways: the number of advancing stocks compared with declining stocks, the percentage of companies above key moving averages, the performance of an equal-weighted index and participation across sectors. None is perfect, but together they show whether investors are buying a broad economic recovery or concentrating in a handful of perceived winners.
A healthy AI leadership rotation would not necessarily require semiconductor shares to surge immediately. It would require selling pressure in hardware to become more orderly while cloud platforms, software companies and nontechnology sectors attract durable demand. Financials could benefit if economic activity remains resilient without a sharp inversion in credit conditions. Industrials could benefit from infrastructure and power investment. Consumer companies could improve if lower fuel costs support household spending. Healthcare can provide defensive growth if cyclical uncertainty remains high.
By contrast, an index rally led almost entirely by Amazon, Microsoft and a few other mega-cap names would be more fragile. Those companies can support the benchmarks for a long time, but concentration increases the market’s sensitivity to any one earnings report, regulatory action or change in capital-spending expectations. The stronger the concentration, the more an apparently diversified index behaves like a small portfolio of technology franchises.
Breadth also helps distinguish short covering from long-term accumulation. A sudden rally in heavily shorted stocks can produce impressive percentage gains without broad institutional sponsorship. If advancing volume remains narrow and defensive sectors do not participate, the move may represent position reduction rather than a new economic view. If participation expands over several sessions while credit spreads remain contained, the evidence for a durable move becomes stronger.
Investors should therefore compare the capitalization-weighted S&P 500 with equal-weighted measures and smaller-company indexes. The Russell 2000 is particularly sensitive to domestic financing conditions because many smaller companies rely more heavily on bank credit and have less access to low-cost bond markets. If lower yields support only the largest cash-rich companies while smaller firms continue to weaken, the market may be celebrating valuation relief rather than a broad improvement in growth.
Sector performance can also clarify the meaning of lower oil. A decline in energy shares alongside gains in transports, consumer discretionary companies and rate-sensitive groups would be consistent with an improved inflation outlook. A simultaneous decline in energy, industrials and small caps could instead suggest concern about demand. Context matters more than the oil price alone.
Capital Expenditure, Free Cash Flow and the Return-on-AI Test
The debate over AI capital expenditure is often reduced to two misleading positions. One side treats every dollar of spending as evidence of confidence and future growth. The other treats every dollar as proof that hyperscalers are destroying cash. The correct analysis depends on the timing and magnitude of the cash flows that the investment produces.
Capital expenditure creates an asset rather than an immediate operating expense. Cash leaves the company when the asset is purchased or constructed. Accounting profit recognizes the cost gradually through depreciation. That difference means a company can report rising earnings while free cash flow falls, or report heavy depreciation after the most intense construction period has passed.
For AI infrastructure, the return calculation should include more than direct revenue from renting processors. A hyperscaler may use the same investment to protect existing cloud customers, improve internal productivity, support search and advertising products, sell database and security services, and create new software tools. Some returns are defensive: without the investment, customers might leave for a competitor. Defensive returns are economically important even if they are difficult to isolate in a segment report.
The cost side is equally broad. Data centers require land, buildings, electrical interconnections, backup generation, cooling, networking, servers, accelerators and ongoing maintenance. Power contracts can extend for years. Hardware may need replacement well before the building itself. Software and personnel are required to make capacity usable. A facility that is technically operational can still produce a poor return if utilization is low or customer prices fall.
Three metrics can help investors judge progress. The first is incremental revenue relative to incremental capital. If cloud revenue accelerates after a period of investment, the relationship becomes more credible. The second is incremental operating margin. Revenue growth is less valuable if depreciation and operating costs consume most of it. The third is free-cash-flow recovery. A temporary decline may be acceptable during construction, but a permanently negative profile would challenge the economic case.
Contracted backlog provides another clue, though it must be interpreted carefully. A large remaining-performance obligation shows that customers have signed commitments. It does not reveal the exact timing, margin or cancellation risk of every contract. Backlog quality depends on customer credit, pricing, required future investment and the extent to which commitments are tied to capacity that is not yet available.
Management guidance should also be compared with physical constraints. Power availability, permitting, transformers, advanced chips and network equipment can delay revenue even when demand is present. A delayed project may still earn an attractive return, but the delay reduces present value and can increase cost. Conversely, scarcity can protect pricing and make existing capacity more valuable.
The most persuasive outcome would be a sequence in which capital spending rises, cloud growth accelerates, margins remain stable, backlog converts and free cash flow begins to recover. That would demonstrate that infrastructure is becoming productive. The least persuasive outcome would be continued spending accompanied by slower revenue, lower utilization and repeated extensions of the expected payoff period.
Microsoft’s useful-life change belongs within that framework. It may reflect genuine operating experience with long-lived buildings and infrastructure. It can reduce annual depreciation and alter lease classification. But it cannot substitute for evidence of cash returns. Amazon’s AWS acceleration is more direct evidence of commercial demand, while its pressured free cash flow shows that the investment phase remains costly. Both facts are necessary for a complete assessment.
Historical Perspective: Why AI Booms Produce Uneven Winners
Major investment cycles rarely distribute value evenly across the companies that participate in them. Railroads, telecommunications networks, the commercial internet, smartphones and cloud computing all required enormous capital investment. Each cycle created durable businesses, but it also produced overbuilding, price competition and companies whose revenues grew without generating acceptable returns for shareholders.
The lesson is not that infrastructure booms are irrational. Modern economic systems often require periods of investment that look excessive in real time. The lesson is that technological importance and investment attractiveness are different questions. A product can change the economy while a company supplying it earns weak returns because competition is intense, capital costs are high or the stock was purchased at an unrealistic price.
AI infrastructure may follow a similar pattern. Demand for computing, memory, networking, energy and data-center capacity can remain structurally strong while returns vary across suppliers. Companies controlling scarce technology may earn extraordinary margins for a period. Customers may respond by developing alternatives, negotiating harder or integrating vertically. New capacity may reduce scarcity. Software and application companies may capture more of the final value than the businesses that built the physical infrastructure.
That history supports the rotation thesis without guaranteeing which group wins next. Hyperscalers have distribution, data and customer relationships, but they also face the largest capital bills. Semiconductor companies have technical scarcity and strong demand, but they face cyclicality and customer concentration. Software companies can scale with less physical capital, but they may depend on the platforms beneath them and compete with rapidly improving general-purpose models.
The market’s task is to estimate the division of profits across the stack. The answer will change as technology matures. In the early phase, hardware scarcity can dominate. In the next phase, cloud utilization and software adoption may matter more. Later, applications, productivity gains and industry-specific integration may capture the greatest value. A leadership rotation is therefore not a rejection of AI; it can be evidence that the market is moving to a new stage of the same investment cycle.
Valuation Is the Common Thread
Oil, yields, earnings and positioning appear to be separate topics, but valuation connects them. A valuation is an estimate of future cash flows adjusted for time, uncertainty and the return available elsewhere. Oil influences inflation and margins. Yields influence the discount rate. Earnings influence expected cash flow. Positioning influences how quickly the market can move from one valuation to another.
This framework explains why the same news can have different effects on different stocks. Lower yields help a company whose value depends heavily on distant growth. They matter less to a mature company trading on near-term cash flow. Higher oil can hurt an airline directly, support an energy producer and pressure a software stock indirectly through interest rates.
It also explains the apparent inconsistency between Amazon and Apple. Amazon’s result changed expectations for cloud growth and future cash generation enough to justify a higher valuation in the market’s view. Apple’s result was strong, but not strong enough to support the prior multiple once temporary benefits and relative growth were considered. The market was not applying two unrelated standards; it was updating different cash-flow and risk assumptions.
Valuation is not a precise scientific answer. Small changes in growth, margins or discount rates can produce large changes in estimated value. That uncertainty is greatest for companies in rapidly changing industries. It is therefore dangerous to treat any single multiple as proof that a stock is cheap or expensive.
Comparisons must also use consistent measures. A trailing price-to-earnings ratio based on generally accepted accounting principles is not directly comparable with a forward ratio based on adjusted analyst estimates. Free-cash-flow yields can be distorted by temporary capital spending. Enterprise-value multiples depend on debt and cash. Cyclical companies can look cheapest near the top of the cycle.
The useful question is not “Which stock has the lowest multiple?” It is “What assumptions must be true for the current price to deliver an acceptable return, and how much evidence supports those assumptions?” This week’s earnings and data will change those answers.
What Would Confirm a Durable Hyperscaler Rotation?
A few strong trading sessions would not be enough. A durable shift toward Microsoft, Amazon, Alphabet and Meta would require evidence across revenue, estimates, capital efficiency and relative price performance.
- Cloud growth would remain strong or accelerate: Azure, AWS and Google Cloud would need to show sustained workload growth rather than a one-quarter capacity release.
- Backlogs would convert into revenue: large remaining-performance obligations are valuable only if customers deploy services and contracts retain acceptable economics.
- Margins would withstand infrastructure cost: depreciation, energy, networking and labor expenses must not absorb all incremental revenue.
- Free cash flow would stabilize: investors can tolerate a period of heavy spending, but they will eventually expect operating cash flow to outrun capital requirements.
- Applications would broaden: customer demand should extend beyond model training into inference, software agents, data analytics and industry workflows.
- Relative performance would persist: hyperscalers would need to outperform semiconductor indexes over months, not merely rebound for several days after earnings.
The opposite evidence would weaken the thesis. Slower cloud growth, falling backlog conversion, rising depreciation, weak utilization or price competition would suggest that infrastructure is being added faster than profitable demand. A renewed semiconductor rally accompanied by stronger earnings revisions could show that the recent hardware weakness was temporary rather than a lasting leadership change.
What Could Go Wrong With the Bullish Case?
The constructive scenario depends on several fragile assumptions. The first is geopolitical. A diplomatic process can fail without warning. Renewed attacks on energy infrastructure or shipping could reverse oil’s decline and quickly restore inflation concerns.
The second is monetary. The Federal Reserve has not committed to easing. A strong employment report, rising wages or persistent service inflation could strengthen the case for a rate increase. Long-term yields may also rise for reasons beyond near-term policy, including fiscal deficits, term premium and investor demand for compensation against inflation risk.
The third is earnings concentration. Amazon and Microsoft can support the indexes because of their size, but the market still needs evidence from other companies. If Palantir, AMD or memory producers issue cautious guidance, investors may conclude that the AI cycle is becoming less broad even if cloud platforms remain healthy.
The fourth is valuation. A company can execute well and still generate poor stock returns if its initial valuation is too high. The strongest businesses often attract the highest expectations. The difference between a good business and a good investment can be the price paid.
The fifth is leverage. The semiconductor selloff demonstrated that crowded positions can move farther and faster than fundamentals alone imply. Similar crowding can develop in the hyperscalers after a sharp rotation. A trade does not become safe merely because the underlying companies are profitable and large.
The sixth is accounting interpretation. Longer asset lives reduce annual depreciation, but they may also delay recognition of economic obsolescence if assumptions prove too optimistic. Investors should monitor impairments, asset disposals, utilization and future changes in estimates. Reported profit can improve before cash economics do.
What Would Make the Bearish Case Too Pessimistic?
Bearish investors also face risks. AI demand may be stronger and more durable than skeptical models assume. Cloud platforms may possess pricing power because customers value speed, security and integrated services more than the lowest unit cost. Data-center capacity may remain constrained for years because power, permitting and grid connections are difficult to secure.
Semiconductor supply may not expand quickly enough to create a conventional glut. Advanced manufacturing, high-bandwidth memory and packaging require specialized equipment and expertise. Even if individual chip designs become obsolete, the total volume of computing required for inference could rise faster than efficiency improves.
Corporate productivity gains may also emerge gradually. Businesses often need time to redesign workflows around a new technology. Early spending can look unproductive before organizational changes allow revenue or cost benefits to appear. If AI adoption follows the pattern of earlier enterprise technologies, monetization may broaden after infrastructure has already been built.
Finally, high short interest and cautious positioning can reduce the supply of incremental sellers. If geopolitical risk recedes and earnings estimates rise, investors who waited for a deeper correction may be forced to buy at higher prices. That does not validate every valuation, but it can extend a rally longer than fundamental skeptics expect.
Frequently Asked Questions
What is the main stock market outlook for the week of August 3, 2026?
The market has a constructive opening setup because oil and Treasury yields have eased while Amazon and Microsoft strengthened confidence in cloud demand. The outlook remains conditional on U.S.-Iran diplomacy, labor data, Federal Reserve expectations and earnings from major AI, technology, healthcare and consumer companies.
Why are investors discussing an AI leadership rotation?
Semiconductor stocks led much of the AI rally but became crowded and highly valued. Recent cloud results suggest that hyperscalers may be converting infrastructure spending into faster revenue growth. Investors are therefore considering whether Microsoft, Amazon, Alphabet and Meta can outperform hardware suppliers for a period.
Does Microsoft’s 25-year data-center life mean its AI investments are more profitable?
Not by itself. The change extends the estimated useful life of data centers and office buildings, affecting depreciation timing and lease classification. Microsoft said the expected fiscal 2027 operating-income benefit would be minimal and that its underlying investment plans had not changed. Economic profitability still depends on utilization, pricing, operating costs and future cash flow.
Why did Amazon stock rise after earnings?
Amazon reported 20% revenue growth and a 37% increase in AWS sales to $42.2 billion. The acceleration in cloud growth provided evidence that demand for AI and computing infrastructure remained strong. Investors also responded to higher operating income, although heavy capital spending remains an important risk.
Why did Apple stock fall despite strong earnings?
Apple reported record June-quarter revenue and higher earnings, but the shares had carried a premium valuation. Investors also considered tariff-refund benefits, the quality of growth, Services trends and Apple’s relative position in AI investment. A strong quarter can still produce a falling stock when expectations are even stronger.
Was the semiconductor selloff caused only by leverage?
No. Leverage, crowded positioning, margin calls and forced liquidations amplified the decline, particularly in South Korea. Fundamental concerns also mattered, including valuation, AI capital returns, competition, custom chips, export policy and the possibility that supply could eventually catch up with demand.
When are Palantir and AMD reporting earnings?
Palantir is scheduled to report after the U.S. market closes on Monday, August 3, 2026. AMD is scheduled to report after the close on Tuesday, August 4. Investors will focus heavily on guidance because both stocks reflect high expectations for future AI growth.
What economic data matter most this week?
The June JOLTS report is scheduled for Tuesday, August 4, at 10:00 a.m. Eastern Time. The July employment report is scheduled for Friday, August 7, at 8:30 a.m. Eastern Time. ISM services, factory orders, the trade balance and weekly jobless claims will add context.
Why can weak jobs data be good or bad for stocks?
Moderately weaker data can reduce inflation and rate-hike expectations, helping bonds and growth-stock valuations. Very weak data can signal recession, weaker corporate demand and credit stress. Investors therefore prefer evidence of gradual cooling rather than a sudden labor-market break.
Can high short interest push the S&P 500 higher?
Short covering can amplify a rally when a catalyst changes expectations, but broad-market short-interest figures include hedges and arbitrage positions. A durable advance requires more than forced buying; it needs improving earnings, acceptable valuations and long-term demand from investors.
Are the livestream’s SPY, Amazon, AMD and Apple price levels reliable forecasts?
No technical level is a reliable forecast. Levels can help explain where traders may place orders, but earnings, economic data and geopolitical events can cause prices to gap through them. The levels discussed in the broadcast should be understood as conditional trading scenarios, not verified future prices or recommendations.
How should investors evaluate an AI trading platform’s accuracy claim?
They should ask for a precise definition of accuracy, the complete sample, time period, transaction-cost assumptions, drawdowns, risk per trade and whether results are hypothetical or independently audited. Testimonials and selected winning trades do not establish representative user performance.
Final Assessment
The strongest verified evidence entering the week is that cloud demand remains powerful. Amazon’s AWS acceleration and Microsoft’s Azure growth show that enterprises continue to consume infrastructure at a rapid pace. That supports the argument that the AI investment cycle is producing revenue and that market leadership can broaden from semiconductor suppliers toward the platforms selling computing and software services.
The strongest credible concern is that revenue growth has not yet resolved the return-on-capital question. Amazon’s free cash flow has been pressured by investment. Microsoft’s useful-life change affects accounting and lease presentation more than near-term operating profit. Semiconductor valuations and leveraged positioning remain unstable. Apple’s decline shows that even excellent companies can fall when price and expectations become too demanding.
What changed over the weekend was the market’s probability assessment. A lower perceived risk of immediate strikes on Iranian energy infrastructure reduced oil prices and eased some pressure on yields. That gave investors room to focus on earnings rather than only on inflation and geopolitics. It did not remove those risks.
The next confirmation will come from the interaction of data and corporate guidance. A gradual cooling in job openings and payrolls, continued lower oil and resilient earnings would strengthen the constructive rotation. A breakdown in diplomacy, renewed yield increases or cautious AI guidance would expose how much optimism has already returned to prices.
The most defensible stock market outlook is therefore neither a promise of a new rally nor a prediction of an imminent collapse. It is a conditional transition. The market is testing whether AI spending can move from a hardware scarcity story to a broader monetization story while the economy absorbs high rates and geopolitical uncertainty. The companies that demonstrate revenue, margins, cash conversion and disciplined investment are likely to receive the benefit of that transition. Those relying mainly on crowded positioning or distant promises will face a less forgiving market.
Sources
- Reuters: Oil slumps on hopes of Iran deal as global markets react
- The Wall Street Journal: U.S. stock futures rise and oil falls on Iran diplomacy
- Federal Reserve: July 29, 2026 FOMC statement
- U.S. Bureau of Labor Statistics: Job Openings and Labor Turnover Survey
- U.S. Bureau of Labor Statistics: 2026 release calendar
- Microsoft: Fiscal 2026 fourth-quarter results
- Microsoft: Fiscal 2026 fourth-quarter earnings-call transcript
- Amazon: Second-quarter 2026 results
- Apple: Fiscal third-quarter 2026 results
- Apple: Fiscal third-quarter 2026 consolidated financial statements
- AMD: First-quarter 2026 financial results
- AMD: Second-quarter 2026 earnings date announcement
- Palantir: Second-quarter 2026 earnings date announcement
- Sandisk investor relations
- Western Digital investor relations
- Uber: Second-quarter 2026 results conference-call announcement
- Reuters: Investor positioning after South Korea’s market volatility
- Reuters: Hedge-fund deleveraging during the AI stock rout
- Reuters: South Korea semiconductor rout and SK Hynix reaction
Affiliate disclosure: Businessfinance.news may earn compensation from qualifying actions completed through selected links on this website, at no additional cost to the reader. Affiliate relationships do not influence our editorial reporting, analysis, or conclusions.