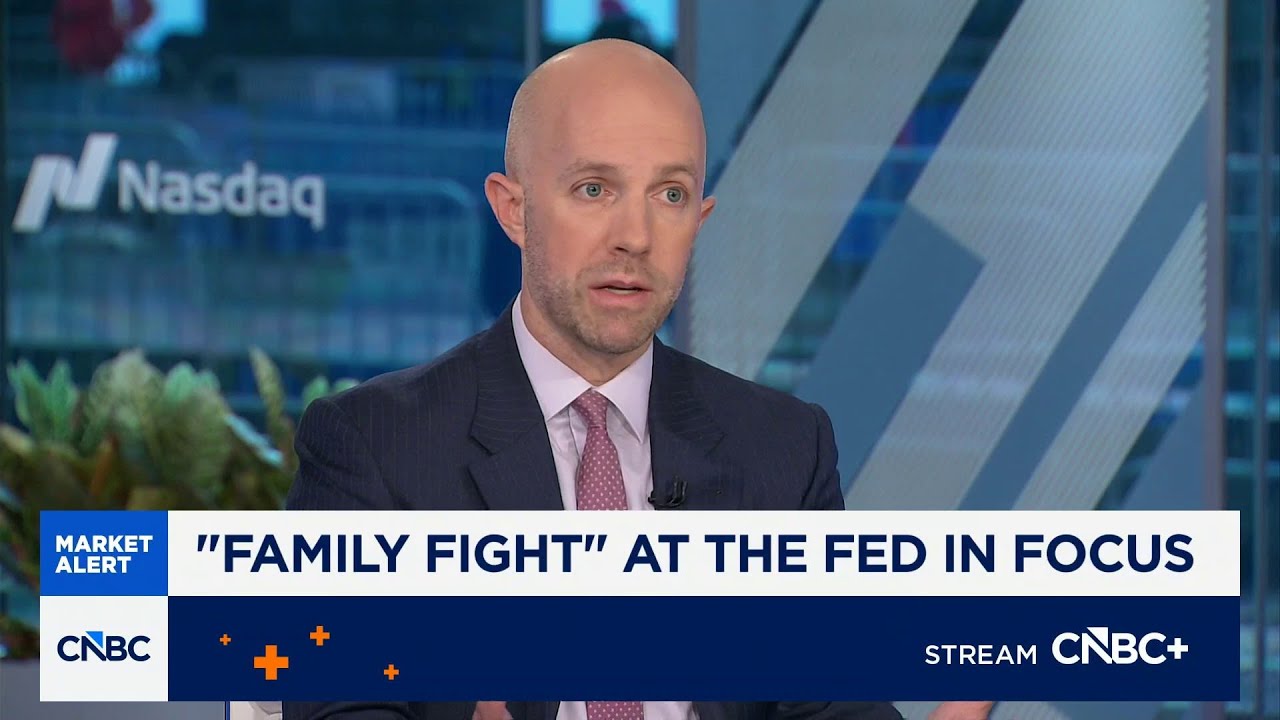
Ed Yardeni’s year-end S&P 500 forecast of 8,250 moved from audacious to plausible in a single record-setting session. The index closed at 7,736.52 on August 4, 2026, after rising 1.79%, leaving Yardeni’s target approximately 6.6% above the latest closing level. That is no longer a forecast that requires an extraordinary melt-up. It requires a continuation of unusually strong corporate earnings, enough confidence to keep the market’s valuation near 20 times forward profits, and no decisive break in the economic or geopolitical conditions supporting risk assets.
The bullish argument is straightforward. Analysts’ forward earnings estimates for the S&P 500 have climbed to records. Second-quarter results have exceeded already elevated expectations. Revenue growth is broad, technology profits are expanding rapidly, financials and industrials are contributing more, and the U.S. economy continues to generate enough private demand to support corporate sales. Yardeni describes this as “fabulous earnings momentum,” or FEMO: a market in which rising profit expectations do much of the work that would otherwise have to come from expanding valuation multiples.
The complication is that the cleanest headline numbers are not quite as clean as they look. FactSet’s blended estimate showed second-quarter S&P 500 earnings growth of 47.4% as of July 31, but that figure was enlarged by enormous unrealized investment gains reported by Alphabet and Amazon. Excluding both companies, the growth rate would have been 28.8%—still exceptional, but materially lower. At the same time, the index’s forward price-to-earnings ratio remains elevated compared with longer history, Treasury yields are high, inflation is above the Federal Reserve’s target, and the market remains concentrated in a small group of giant companies.
The right question, therefore, is not whether Yardeni can multiply an earnings estimate by a valuation multiple and arrive at 8,250. The arithmetic is easy. The harder question is whether the earnings are durable, whether the estimate is measured consistently, and whether investors will continue paying roughly 20 times those profits if inflation, interest rates, oil prices, artificial-intelligence spending, or economic growth move in the wrong direction.
Last updated: August 5, 2026, 3:45 a.m. EDT. Market prices refer to the August 4 regular-session close unless otherwise stated.
Key Takeaways
- The target is now close: The S&P 500 closed at 7,736.52 on August 4, placing Yardeni’s 8,250 year-end target about 6.6% higher.
- The thesis is earnings-led: Yardeni expects forward S&P 500 earnings to approach or exceed $400 per index share, with a valuation near 20 times earnings.
- The headline earnings boom needs adjustment: FactSet estimated second-quarter earnings growth at 47.4%, but 28.8% after excluding Alphabet and Amazon, whose GAAP results included unusually large investment gains.
- Operating momentum is still strong: Even after the adjustment, revenue growth, cloud demand, semiconductor profits, energy earnings, banking results, and industrial power demand point to a broad corporate expansion.
- Valuation is the main constraint: A 20-times forward multiple is defensible only if earnings estimates hold, recession risk remains low, and long-term interest rates do not rise enough to pressure equity valuations.
- The next tests arrive quickly: U.S. productivity data, the July employment report, the July CPI report, continuing earnings releases, and the September Federal Reserve meeting will challenge the market’s assumptions.
Fact Box
The 8,250 Target in One Calculation
- S&P 500 close on August 4, 2026: 7,736.52.
- Distance to 8,250: 513.48 index points, or approximately 6.6%.
- One route to the target: $412.50 in forward earnings multiplied by a 20.0 forward P/E.
- Another route: $400 in forward earnings multiplied by a 20.625 forward P/E.
Original sources: S&P Dow Jones Indices market data and Yardeni Research’s target framework.
Why the S&P 500’s August 4 Record Changed the Debate
Before August 4, the S&P 500 had spent much of the summer near 7,500, with a calm headline index concealing sharp rotations underneath. Semiconductor shares, software companies, highly valued artificial-intelligence beneficiaries, and leveraged momentum positions had all experienced turbulence. The index’s relative stability encouraged two incompatible narratives. Bulls saw consolidation during a powerful earnings cycle. Skeptics saw a market unable to advance despite increasingly optimistic profit forecasts.
The August 4 session resolved that stalemate, at least temporarily. The S&P 500 gained 136.02 points to 7,736.52, its first record close since early June. The Dow Jones Industrial Average also closed at a record, while the Nasdaq Composite rose 2.59%. Technology led the advance, but the rally was not confined to one group. The session combined several favorable impulses: strong corporate earnings, renewed demand for artificial-intelligence shares, lower oil prices, retreating Treasury yields, and optimism that negotiations could reduce the threat to shipping through the Strait of Hormuz.
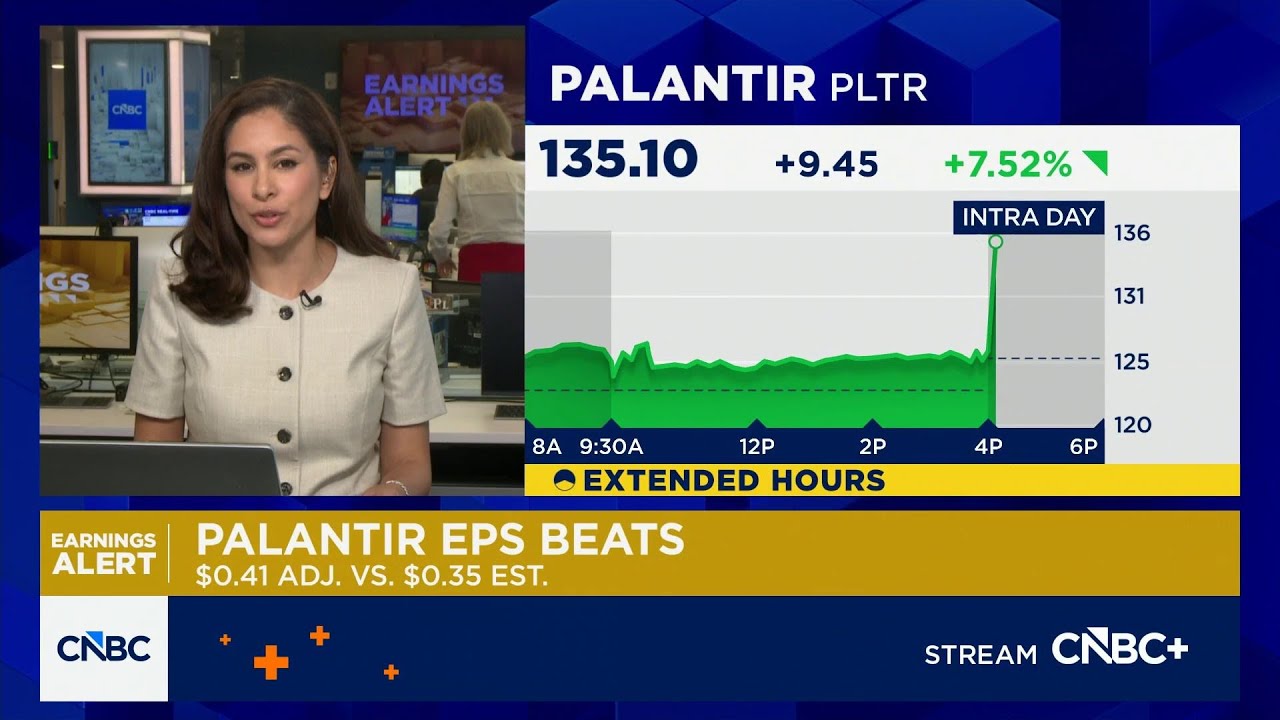
Two companies captured the breadth of the story. Palantir represented the high-growth software and AI side of the market. Caterpillar represented the physical infrastructure side. Palantir reported second-quarter revenue of $1.94 billion, up 93% from a year earlier, and raised its full-year outlook. Caterpillar reported quarterly sales and revenue of $20.5 billion, up 24%, with higher volume, improved pricing, stronger margins, and a growing backlog across its major segments. The combination mattered because it linked digital demand with power generation, construction, energy systems, and industrial equipment.
That linkage is central to Yardeni’s argument. The AI boom is no longer visible only in the valuations of chip designers or cloud platforms. It is influencing electrical equipment, natural-gas turbines, cooling systems, construction, copper demand, data-center real estate, software deployment, and financing. A broader capital-spending cycle can support more sectors than a narrow consumer internet boom. It can also create more durable revenue streams if the infrastructure is utilized productively.
Yet a record close does not prove that the target will be reached. A one-day rally can reflect short covering, position rebuilding, falling oil prices, or relief after a technical selloff. The important change is more modest: 8,250 no longer requires both heroic earnings growth and a dramatic re-rating. It can be reached if earnings estimates continue rising and the market merely holds a valuation close to where it has recently traded.
That shift makes earnings quality more important, not less. When a target is far above the market, investors can debate broad themes. When it is only 6.6% away, small changes in the earnings denominator or valuation multiple decide whether the target looks conservative, fair, or aggressive.
What Yardeni Is Actually Forecasting
Yardeni’s forecast is often summarized as a directional call that stocks will rise. His underlying framework is more specific. It starts with forward earnings: a time-weighted blend of analysts’ estimates for the current year and the following year. As the calendar advances, the next year receives a larger weight. By late December, the forward figure is close to the consensus estimate for the coming calendar year.
This approach matters because the market is forward-looking. Investors do not normally value the S&P 500 solely on profits earned in the previous 12 months. They attempt to price the earnings stream expected over the next year and beyond. If analysts raise those forecasts faster than the index rises, the forward P/E can fall even while stock prices increase. That is the mechanism behind Yardeni’s claim that recent valuation pressure has been relieved by rising earnings rather than by a major decline in prices.
In a July 12 note, Yardeni Research described two paths to 8,250. One was forward earnings of $412.50 multiplied by 20. The other was $400 multiplied by 20.6. By early August, Yardeni’s team said the consensus estimate for 2027 earnings had reached $407.72, a record that did not depend on the unusual mark-to-market gains affecting some second-quarter results. In the televised discussion, Yardeni rounded the idea: forward earnings above $400, multiplied by a multiple around 20, produces a level near 8,000, and somewhat better earnings or a somewhat higher multiple produces 8,250.
This is not the same as predicting that actual 2027 GAAP earnings will be exactly $400 or $412.50. Forward earnings are a rolling consensus estimate. They change as companies report, issue guidance, make acquisitions, repurchase shares, change accounting assumptions, and respond to economic conditions. Index membership also changes. The estimate is useful because it aggregates expectations, but it is not a contractual cash flow.
The distinction between “forward earnings at year-end” and “actual earnings during 2027” is especially important. At the end of 2026, the forward number will largely reflect the market’s expectations for 2027. Those expectations may later prove too high or too low. The S&P 500 can reach 8,250 before the underlying profits are earned because markets discount the future. It can also fall afterward if the earnings fail to materialize.
Yardeni’s forecast therefore embeds two forecasts. The first is that analysts will continue raising or at least maintaining profit expectations. The second is that investors will pay around 20 times those expectations. The first is a corporate and economic forecast. The second is a market-pricing forecast affected by interest rates, risk appetite, inflation, volatility, and the alternatives available in bonds.
The Valuation Math Behind S&P 500 at 8,250
Simple scenario analysis shows why small changes matter so much. At an index level of 8,250, a forward earnings estimate of $400 implies a P/E of 20.625. If forward earnings reach $412.50, the implied multiple falls to 20.0. If earnings stall at $385, the required multiple rises to approximately 21.4. If investors refuse to pay more than 18 times forward earnings, the market would need forward earnings of roughly $458 to reach the same target—an implausibly large jump over a short period.
| Forward Earnings per S&P 500 Share | Forward P/E | Implied Index Level | Interpretation |
|---|---|---|---|
| $375 | 17.5 | 6,562.5 | Earnings disappointment plus valuation compression |
| $385 | 19.0 | 7,315 | Moderate earnings with a lower multiple |
| $400 | 19.34 | 7,736 | Approximately the August 4 closing valuation |
| $400 | 20.0 | 8,000 | Yardeni’s rounded earnings framework |
| $400 | 20.625 | 8,250 | Target reached through a modest re-rating |
| $412.50 | 20.0 | 8,250 | Target reached through higher forward earnings |
Calculations are illustrative, not forecasts. Index levels equal forward earnings multiplied by the assumed forward P/E.
The table exposes the asymmetry in the debate. Bulls do not need an extreme multiple if the earnings estimate reaches Yardeni’s preferred range. Bears do not need a recession to challenge the target; a reduction in the multiple from 20 to 18 can offset a substantial amount of earnings growth. At $400 in forward earnings, each full turn of the P/E equals 400 index points. A move from 20 times to 18 times subtracts 800 points even if the profit forecast is unchanged.
This is why bond yields matter. Equities do not trade in isolation. When the 10-year Treasury yield is close to 4.6% or 4.7%, investors can earn a meaningful nominal return from government securities without accepting corporate earnings risk. A high equity multiple can still be justified by superior growth, strong margins, and durable competitive advantages, but the hurdle is higher than it would be with a 2% Treasury yield.
The same arithmetic also explains why Yardeni emphasizes earnings revisions. If the denominator rises, the market can advance without becoming more expensive. If the denominator stops rising, every additional index point comes from multiple expansion. That is a more fragile form of rally because it depends increasingly on sentiment rather than realized operating progress.
The Earnings Yield and Bond-Yield Constraint
A P/E ratio can be inverted into an earnings yield. At 20 times forward earnings, the earnings yield is 5%. This is not a promised cash return, because corporate earnings can be retained, reinvested, or decline. It is nevertheless a useful way to compare the valuation of equities with the yield available from bonds.
When the 10-year Treasury yield is close to the equity earnings yield, the immediate valuation advantage of stocks appears narrow. Equities can still be attractive because earnings may grow, dividends can increase, and companies can repurchase shares. Treasury coupons do not grow. Stocks also carry much greater uncertainty, however, and investors normally demand compensation for that risk.
The comparison is not as simple as subtracting the Treasury yield from the earnings yield. The two measures have different maturities, tax characteristics, inflation sensitivities, and cash-flow patterns. The forward earnings estimate can change quickly, while a Treasury’s contractual payments are known if it is held to maturity and the U.S. government meets its obligations. Even so, the gap provides a useful stress test for the multiple.
If forward earnings rise while bond yields remain stable, the earnings yield can improve without a stock-market decline. That is the benign route in Yardeni’s forecast. At an unchanged index level, an increase in forward EPS reduces the P/E and increases the earnings yield. Investors receive better prospective earnings support without requiring lower prices.
If the 10-year yield rises while forward earnings stall, the opposite occurs. Bonds become more competitive, the discount rate applied to future corporate profits increases, and investors may demand a lower P/E. Growth companies are particularly sensitive because a larger share of their expected value lies in distant cash flows.
This constraint does not impose a fixed ceiling. The S&P 500 has traded at high multiples during periods of strong productivity, low volatility, and exceptional profitability. The current index also contains companies with global platforms, recurring revenue, and large net cash positions. Those characteristics can support a lower perceived risk premium than the average company historically deserved.
But the bond comparison explains why earnings must do the heavy lifting. With cash and government bonds offering meaningful yields, an equity rally based mainly on multiple expansion would be harder to sustain. An advance supported by rising forward earnings is more defensible because it improves the relative valuation even as prices rise.
What “Fabulous Earnings Momentum” Means
FEMO is not simply a high year-over-year growth rate. It is the combination of rising actual earnings, positive surprises, upward revisions, record forward estimates, broad sector participation, and profit margins strong enough to convert revenue growth into faster earnings growth. Each element answers a different question.
Actual earnings show what companies produced. Surprise rates show how results compared with analyst estimates immediately before reporting. Revision trends show whether expectations for future quarters are moving up or down. Forward earnings aggregate the changing outlook. Sector breadth shows whether the expansion depends on a few companies. Margins show whether revenue growth is being converted into profit rather than absorbed by wages, materials, depreciation, interest expense, or competitive pricing.
As of July 31, FactSet reported that 61% of S&P 500 companies had released second-quarter results. Eighty-six percent had beaten the mean EPS estimate and 77% had beaten revenue estimates. The blended earnings growth rate was 47.4%, up from an estimate of 23.2% at the end of June. Nine sectors had experienced improved earnings growth rates because of positive surprises or upward revisions. FactSet’s forward 12-month P/E was 19.6, down from 20.4 at the end of the second quarter because forward EPS estimates had risen while the index price had declined slightly through that cutoff.
Those figures meet most of the criteria for earnings momentum. The beat rate is high. Revisions are positive. Revenue is growing. The multiple has not had to expand to accommodate higher estimates. Future-quarter expectations are also strong: analysts were calling for 27.4% earnings growth in the third quarter and 25.2% in the fourth, with 29.1% for calendar 2026.
But the word “momentum” can conceal base effects. A company recovering from a weak comparison can report spectacular growth without producing an equally spectacular long-term trend. Energy earnings can surge because oil prices are far above the prior-year level. A bank can report a large gain from a transaction. A technology company can recognize a non-operating valuation gain. The aggregate number does not distinguish recurring operating profit from temporary or market-driven items unless the analyst adjusts it.
For that reason, the most persuasive version of Yardeni’s case is not the 47.4% headline. It is the combination of 28.8% growth excluding Alphabet and Amazon, 14.1% revenue growth, positive earnings growth in ten of eleven sectors, and rising estimates for later quarters. Those figures indicate that the boom is not purely an accounting artifact, even though accounting effects make the headline look stronger than the underlying operating picture.
A Better Test of Whether the Earnings Momentum Is Durable
Index earnings can rise for reasons that have very different implications for future returns. A dollar of recurring operating profit from a cloud subscription is not economically identical to a dollar created by revaluing an equity investment. A dollar produced by higher unit volume is different from a dollar produced by a temporary tax benefit. A dollar of EPS growth caused by fewer shares outstanding is different from a dollar produced by higher companywide net income. All count in reported results, but they do not deserve the same valuation.
A more rigorous test of Yardeni’s earnings thesis requires looking beneath the aggregate EPS number in five areas: cash conversion, margin quality, capital intensity, estimate revisions, and breadth.
Cash Conversion
Net income is an accounting measure. Cash flow shows whether earnings are being converted into resources that can fund investment, debt repayment, dividends, or repurchases. The relationship is rarely exact in a single quarter because working capital, taxes, deferred revenue, stock-based compensation, and investment timing can create large differences. Over several quarters, however, persistent divergence deserves attention.
For the technology leaders, cash conversion is especially important because capital expenditures are expanding rapidly. A company can report rising operating income while free cash flow grows more slowly if infrastructure spending absorbs the cash. That does not necessarily make the investment unattractive. It means the valuation increasingly depends on the future productivity of the assets rather than only on current earnings.
The same principle applies outside technology. Industrial companies can generate strong earnings while inventories and receivables consume cash. Banks require a different framework because deposits, loans, securities, and regulatory capital are part of the operating model. Energy companies can show high profit during a commodity spike while committing cash to projects with long payback periods. The quality test must fit the business.
Margin Quality
Aggregate earnings growth that exceeds revenue growth implies expanding margins. That can be an excellent sign when it reflects operating leverage, better product mix, automation, disciplined pricing, or lower unit costs. It is less durable when it depends on temporary cost deferrals, unusually low loss provisions, one-time credits, or expenses that will return later.
AI creates both possibilities. Software companies can serve additional users at high incremental margins once platforms are built. Cloud providers can benefit from utilization and scale. At the same time, processors, data centers, power contracts, networking equipment, and technical staff create substantial depreciation and operating costs. The market is currently rewarding the revenue acceleration. The next stage will be judged by whether margins remain strong after the full cost of the infrastructure passes through the income statement.
That transition can occur with a delay. Capital expenditures appear first on the cash-flow statement and balance sheet. Depreciation is recognized over the useful life of the asset. A large buildout can therefore depress free cash flow before it fully depresses accounting earnings. Investors focusing only on near-term EPS may underestimate the expense that arrives in later periods.
Estimate Revisions After Guidance
Positive earnings surprises matter most when they lead analysts to increase future estimates. A company can beat a low quarterly target while reducing its full-year outlook. It can also exceed expectations because of a one-time item that analysts do not carry forward. In those cases, the reported beat does little to support a higher index target.
The more useful signal is the direction and breadth of revisions for the next four quarters and the next calendar year. If analysts raise sales, operating income, and EPS estimates after reviewing management guidance, the forward-earnings denominator becomes more credible. If the forward number rises only because the calendar mechanically gives more weight to a higher next-year forecast, the apparent momentum is weaker.
Revision breadth is as important as the aggregate dollar estimate. A rising S&P 500 forecast driven by five enormous companies is more vulnerable than one supported by upward revisions across hundreds of constituents. The index can reach the same EPS total in either case, but the second route generally offers greater resilience to company-specific disappointments.
Share Count and Financial Engineering
Earnings per share can increase because net income rises, because the diluted share count falls, or both. Repurchases can create genuine value when a company buys shares below intrinsic value using surplus cash. They can destroy value when financed with expensive debt or executed at inflated prices. For the index, buybacks provide a persistent but uneven tailwind to EPS.
The distinction matters when evaluating a $400-plus forward estimate. If aggregate net income grows strongly while share counts decline modestly, the EPS increase has a broad foundation. If EPS depends heavily on shrinking share counts while operating profit stagnates, the forecast is less persuasive. Investors should also account for stock-based compensation, which can offset repurchases and transfer value to employees even when the headline buyback authorization is large.
Breadth Across Business Models
The most durable evidence comes from different industries producing profit for different reasons. Cloud providers can grow through computing demand. Banks can benefit from capital markets and lending. Industrials can benefit from infrastructure orders. Health care can benefit from product innovation. Energy companies can benefit from commodity prices and power demand. When these earnings streams rise together, the index is less dependent on one narrative.
That is why the adjusted second-quarter figures are more useful than the sensational headline. Removing the largest investment gains still leaves substantial earnings and revenue growth across the market. The remaining question is whether that strength survives tougher comparisons, higher depreciation, and a labor market that is no longer accelerating.
A durable version of FEMO would therefore look like this: revenue estimates continue rising; operating margins hold after recurring costs; cash flow broadly tracks earnings; forward revisions spread beyond the largest companies; and companies maintain guidance without relying on unusual gains. If those conditions persist, the market can justify a high level without requiring investors to pay ever-higher multiples.
The 47.4% Earnings Number—and Why It Must Be Handled Carefully
Alphabet and Amazon illustrate how GAAP accounting can produce a technically correct but economically complicated index statistic. Alphabet’s second-quarter earnings included a $98 billion gain, largely related to unrealized gains on equity securities. Amazon’s results included $53.4 billion of non-operating pre-tax other income, primarily from its investments in Anthropic. These gains flowed through reported earnings and therefore through the aggregate S&P 500 growth calculation used by FactSet.
FactSet calculated that Alphabet alone accounted for a major portion of the index’s increase in earnings growth. Excluding Alphabet, the blended S&P 500 growth rate would have fallen from 47.4% to 35.7%. Excluding Amazon alone, it would have fallen to 41.1%. Excluding both reduced it to 28.8%.
There is nothing inherently improper about including the gains in GAAP net income. Changes in the value of investments can increase or decrease shareholder wealth, and accounting standards determine when those changes are recognized. The analytical issue is persistence. A gain from revaluing a private investment is not the same as recurring revenue from cloud contracts, advertising, subscriptions, or retail operations. It may reverse. It may not recur. It does not necessarily generate cash in the quarter.
Amazon’s reported net income rose to $62.6 billion, or $5.75 per diluted share, from $18.2 billion, or $1.68, a year earlier. The company explicitly stated that the quarter included the $53.4 billion pre-tax non-operating gain. AWS operating income, by contrast, rose to $16.6 billion from $10.2 billion. The AWS figure is a cleaner measure of operating momentum in Amazon’s cloud business. Both numbers are relevant, but they answer different questions.
Alphabet’s operating story was also strong independently of the investment gain. Revenue increased 24%, Search and Other revenue rose 17%, YouTube advertising increased 13%, and Google Cloud revenue grew 82%, according to the company’s earnings presentation. Those figures support the argument that AI investment is feeding growth in existing commercial businesses. The equity gain magnified EPS, but it did not create the underlying cloud or advertising growth.
This distinction affects valuation. A forward P/E based on estimates that include recurring operating profit is more informative than one distorted by unpredictable mark-to-market gains. Yardeni’s early-August note attempted to address that issue by emphasizing the consensus 2027 EPS estimate, which he said reached $407.72 without the second-quarter mark-to-market distortion. That is a stronger foundation for the thesis than multiplying the index by a quarter temporarily inflated by investment revaluations.
Fact Box
Q2 2026 S&P 500 Earnings: Headline Versus Adjusted View
- Blended year-over-year earnings growth: 47.4%.
- Growth excluding Alphabet: 35.7%.
- Growth excluding Amazon: 41.1%.
- Growth excluding both Alphabet and Amazon: 28.8%.
- Blended revenue growth: 14.1%.
- Companies reporting by the July 31 cutoff: 61% of the index.
Original source: FactSet’s July 31 S&P 500 earnings-season update.
Revenue Growth Makes the Bull Case More Credible
Earnings can rise faster than revenue for many legitimate reasons: improved pricing, lower costs, higher capacity utilization, operating leverage, reduced interest expense, fewer shares outstanding, or a shift toward higher-margin products. They can also rise for less durable reasons, including reserve releases, tax effects, asset sales, or unrealized gains. Revenue is not immune to distortion, but it provides a useful check.
FactSet’s 14.1% blended revenue growth rate for the second quarter was well above the recent historical averages cited in its report. All eleven S&P 500 sectors were reporting year-over-year revenue growth, and five were growing at double-digit rates. That breadth supports the idea that corporate America is experiencing a genuine nominal expansion rather than merely cutting costs.
Internationally exposed companies were especially strong. FactSet divided the index into companies generating more than half of sales inside the United States and those generating more than half outside it. The internationally exposed group showed higher earnings and revenue growth. Energy producers, global technology platforms, and multinational industrial companies contributed to that result. Currency translation, commodity prices, and geographic mix all affect the comparison, so it should not be interpreted as a permanent advantage. Still, it weakens the argument that the earnings boom is confined to domestic financial engineering.
Revenue growth also helps explain why margins have remained elevated despite high wages, large capital programs, and volatile input costs. Companies with strong demand can spread fixed costs across more sales. Cloud providers can monetize existing networks more efficiently as utilization rises. Industrial suppliers can improve pricing when backlogs are full. Banks can grow fee income and benefit from active capital markets. Energy companies can convert higher commodity prices into cash flow.
The risk is that nominal revenue growth reflects inflation as well as real volume. The U.S. PCE price index was 3.7% higher than a year earlier in June, while headline CPI was up 3.5%. Energy prices were especially volatile. Some of the sales growth therefore represents higher prices rather than more units. That is not automatically bad for profits, but it complicates the claim that revenue growth represents a purely real expansion.
Another risk is that spending is being pulled forward. Data-center customers are racing to secure power, processors, networking equipment, land, and construction capacity. Scarcity can accelerate orders. If supply eventually catches up or AI returns disappoint, order growth could slow abruptly. Backlogs are valuable only if customers accept delivery, financing remains available, and the equipment produces adequate returns.
For now, the revenue evidence is more supportive than skeptical. A 14.1% aggregate growth rate across all eleven sectors is difficult to reconcile with an economy on the edge of a broad corporate recession. It does not eliminate valuation risk, but it gives the earnings estimates a stronger operational base.
Technology Is Expensive in Dollars but Less Expensive Relative to Its Profits
Yardeni’s statement that information technology had gone “on sale” was relative, not literal. The sector still represents an enormous amount of market value, its leading companies remain priced for sustained growth, and long-duration technology assets are sensitive to interest rates. The claim was that earnings estimates had risen enough, and prices had corrected enough, to reduce the sector’s forward P/E premium over the broader index.
In an August 1 note, Yardeni Research placed the S&P 500 Information Technology sector’s forward P/E near 20.0 and the full index near 19.4. The firm contrasted that 0.6-point premium with a gap as wide as roughly 30 points near the 2000 technology peak. The comparison is striking because growth stocks usually command a meaningful premium. If technology trades close to the market multiple while generating much faster earnings growth, the relative valuation case strengthens.
There are several reasons the comparison with 1999 and 2000 is imperfect. Today’s largest technology companies generate substantial revenue, operating income, and free cash flow. Microsoft, Apple, Alphabet, Amazon, and Meta own established platforms with global customers. The late-1990s market included many companies with unproven business models, weak revenues, and valuations dependent on distant possibilities. Current leaders also return capital through buybacks and dividends, even while investing heavily.
Microsoft’s fiscal 2026 results illustrate the scale. Annual revenue exceeded $331 billion, Microsoft Cloud revenue surpassed $214 billion, and Azure revenue exceeded $100 billion. In the fiscal fourth quarter, Microsoft Cloud revenue was $59.3 billion, up 27%, while Azure and other cloud services revenue increased 43%. Those are operating businesses at a scale that did not exist during the dot-com era.
The counterargument is that the capital intensity of the current boom is rising rapidly. Microsoft reported $41 billion of quarterly capital expenditures, including finance leases, and said roughly two-thirds related to shorter-lived assets such as CPUs and GPUs. Meta narrowed its 2026 capital-expenditure outlook to $130 billion to $145 billion, including principal payments on finance leases. Alphabet, Amazon, and other hyperscalers are also spending heavily. These investments can create future revenue, but they also create depreciation, financing commitments, power costs, and the risk of overcapacity.
A low relative premium does not guarantee an absolute bargain. If the entire market trades at an elevated multiple, a sector trading near that multiple may still be expensive. Technology’s top ten constituents account for more than three-quarters of the S&P 500 Information Technology sector’s weight, according to S&P Dow Jones Indices. Company-specific disappointments can therefore move the sector and the index even when the average technology company performs well.
The strongest conclusion is narrower than “there is no tech bubble.” The current technology leaders are producing far more profit and cash flow than the typical speculative leaders of 1999, and their forward valuation premium has compressed. At the same time, concentration, capital intensity, and optimistic long-term assumptions remain genuine risks. The resemblance to 2000 is limited, but that does not make every current price reasonable.
Microsoft, Amazon, Alphabet, Meta, and Apple: Strong Results, Different Earnings Quality
The recent mega-cap reporting cycle reinforced both sides of the argument. Demand for cloud and AI services is strong. Revenue growth accelerated at several companies. Backlogs expanded. Yet reported earnings were affected by investment gains, tariff refunds, and other items that make direct comparisons difficult.
Microsoft: Scale, Backlog, and a $41 Billion Quarterly Capital Program
Microsoft’s fiscal fourth-quarter release showed revenue growth across cloud and enterprise products. Microsoft Cloud revenue reached $59.3 billion, up 27%. Commercial remaining performance obligations rose 84% to $678 billion, indicating a large contracted backlog. Azure and other cloud services revenue increased 43%, and full-year Azure revenue exceeded $100 billion.
The company’s capital expenditures were $41 billion in the quarter. That number is central to the market debate. It demonstrates the confidence of one of the world’s largest companies in AI and cloud demand. It also raises the amount of future revenue required to earn an attractive return on the new assets. Short-lived processors depreciate faster than land or buildings. If utilization remains high and pricing power persists, the investment can support years of growth. If supply catches demand or customers reduce experimentation, depreciation can pressure margins.
Amazon: Cloud Strength Beneath a Huge Anthropic Gain
Amazon’s second-quarter GAAP net income was transformed by the $53.4 billion pre-tax gain associated primarily with Anthropic. The gain is economically relevant because Anthropic’s value affects Amazon’s balance sheet. It is not a substitute for operating analysis.
The cleaner operating signal came from AWS, where operating income rose to $16.6 billion from $10.2 billion a year earlier. Amazon’s North American and international commerce businesses also matter, but AWS has an outsized influence on consolidated profit. The cloud segment’s improvement supports the AI demand thesis independently of the investment gain.
Alphabet: AI Growth and a $98 Billion Equity Gain
Alphabet reported 24% revenue growth, with Search and Other up 17%, YouTube advertising up 13%, and Cloud up 82%. These figures show that AI investment is contributing to core businesses rather than merely creating a new speculative narrative. Search remains commercially powerful, advertising is expanding, and cloud demand is strong.
Alphabet’s reported EPS, however, was enlarged by a $98 billion gain largely related to equity securities. As with Amazon, the proper analysis separates operating growth from investment revaluation. The company can have both a strong quarter and an earnings figure that overstates recurring profit growth.
Meta: Advertising Cash Flow Meets Extraordinary Infrastructure Spending
Meta’s 2026 capital-expenditure range of $130 billion to $145 billion shows how aggressively the company is building AI infrastructure. Its advertising engine gives it substantial cash flow to fund the program, and AI can improve ad targeting, recommendation systems, engagement, and content creation. The expenditure is therefore tied to an existing revenue base rather than an entirely new business.
The uncertainty is timing. Infrastructure spending occurs before all related revenue is visible. Depreciation and operating costs arrive even if monetization develops more slowly than expected. Meta’s ability to maintain strong advertising growth while absorbing higher infrastructure costs will be an important indicator for the broader market.
Apple: Strong Revenue with a Tariff-Refund Benefit
Apple reported fiscal third-quarter revenue of $109.4 billion, up 16%, and diluted EPS of $2.02, up 29%. The company also disclosed that gross margin benefited by approximately two percentage points from tariff refunds and EPS by $0.11. The result was strong, but the refund illustrates why investors must examine the composition of beats rather than relying only on the headline.
Apple’s case also differs from those of the cloud hyperscalers. Its growth depends on devices, services, installed-base monetization, product cycles, supply chains, and consumer demand. A broad technology rally can conceal major differences among business models. That dispersion is healthy when investors distinguish operating performance. It becomes dangerous when every company is valued as an interchangeable AI beneficiary.
Palantir and Caterpillar Show How the AI Trade Is Broadening
Palantir’s second-quarter update was an extreme example of software growth. Revenue reached $1.94 billion, up 93% year over year and 19% sequentially. U.S. commercial growth was even faster, and the company raised guidance. The stock’s sharp August 4 advance reflected both the magnitude of the operating performance and the market’s willingness to pay for scarce high-growth AI exposure.
Palantir also demonstrates valuation risk. Rapid growth can justify a high multiple, but the market may capitalize that growth many years into the future. A company can exceed expectations and still become vulnerable if its valuation assumes continued acceleration. The stronger the current result, the more difficult the comparison can become in later periods.
Caterpillar offers a different signal. Its $20.5 billion of quarterly sales and revenues represented the first quarter above $20 billion in company history. Operating profit margin rose to 20.9% from 17.3%, and adjusted operating margin rose to 21.9%. Enterprise operating cash flow was $4.4 billion. Management described broadening momentum and a growing backlog across its primary segments.
Demand for power generation is particularly relevant. Data centers require electricity, backup systems, natural-gas equipment, turbines, and related services. Caterpillar’s exposure shows that AI spending is reaching companies traditionally classified as industrial rather than technology. The same pattern appears in electrical equipment, engineering, utilities, construction, and energy infrastructure.
This broadening can improve the durability of the market. When earnings growth is confined to a few mega-cap stocks, index performance becomes dependent on narrow leadership. When industrials, financials, materials, energy, and smaller companies also experience rising estimates, the market has more ways to advance.
Broadening is not automatically bullish at every price. Industrial companies can be cyclical, backlogs can peak, and data-center construction can overshoot. Energy-intensive investment can also raise electricity and equipment costs for other parts of the economy. The key point is that the earnings cycle has moved beyond a handful of software and chip companies. That supports Yardeni’s overweight preference for industrials and his argument that the economy is translating technology investment into real activity.
Market Breadth: Better Than the Mega-Cap Headline Suggests
Market breadth can be measured in several ways: the percentage of stocks above moving averages, advance-decline lines, equal-weight index performance, sector participation, new highs, or earnings revisions across company sizes. No single measure is definitive. Together, they show whether an index advance is supported by many companies or driven by a few large constituents.
S&P Dow Jones Indices reported that the S&P 500 Equal Weight Index outperformed the capitalization-weighted S&P 500 by approximately one percentage point in July. Yardeni Research also noted that forward earnings for the S&P 400 MidCap and S&P 600 SmallCap indexes were rising alongside large-cap forward earnings. Those developments support the broadening thesis.
The distinction between price breadth and earnings breadth matters. Small and mid-sized stocks can rally temporarily because investors rotate out of mega-caps. That is not necessarily durable. Rising forward earnings among those companies provide a stronger foundation. Smaller companies are often more sensitive to domestic demand, bank lending, labor costs, and interest expense. If their profit expectations improve while long-term yields remain high, the economy may be healthier than large-cap indexes alone suggest.
Sector breadth also improved. FactSet found earnings growth in ten of eleven sectors, with eight reporting double-digit growth. Energy, communication services, consumer discretionary, information technology, and materials led. Financials benefited from strong results at large banks. Industrials gained from capital spending. Even health care’s reported decline required interpretation because acquisition-related research and development charges affected several companies.
Still, market concentration remains historically high. S&P Dow Jones Indices noted that the ten largest S&P 500 companies represented nearly 40% of the index by mid-2025, a level not seen since the mid-1960s. Concentration means the index can rise or fall substantially based on a small number of companies even when breadth improves underneath.
Concentration is not proof of a bubble. Successful companies become large because their profits, competitive positions, and investor expectations increase. A capitalization-weighted index is designed to reflect that market value. The risk is mechanical: the larger the leaders become, the more a disappointment in one company affects every passive investor tracking the index.
Yardeni’s sector positioning—market weight in information technology, overweight financials, industrials, and health care—reflects a preference for participating in technology without relying entirely on it. The approach also assumes that the earnings expansion will continue spreading. If breadth narrows again, the capitalization-weighted index may still rise, but the underlying market would become more fragile.
Financials: A Broader Earnings Engine
Financial companies have become an important part of the earnings story. FactSet identified positive EPS surprises at JPMorgan Chase, Goldman Sachs, Travelers, Morgan Stanley, Wells Fargo, and Citigroup as meaningful contributors to the improvement in second-quarter growth. The sector’s blended earnings growth rate rose to 20.1% from 5.4% at the end of June.
Banks benefit from several features of the current environment. A positive yield curve can support net interest income. Active capital markets generate underwriting and trading fees. Higher asset values increase wealth-management revenue. A resilient economy limits credit losses. Corporate investment creates financing demand.
Those benefits are balanced by risks. High interest rates can slow borrowing, pressure commercial real estate, and increase defaults. Rapid changes in the yield curve can complicate balance-sheet management. Market activity is cyclical. Regulatory capital requirements can constrain returns. Credit quality often looks strongest near the end of an expansion because losses emerge with a lag.
Financials also offer a valuation contrast with mega-cap technology. Many banks trade at lower earnings multiples and return substantial capital through dividends and buybacks. If earnings growth broadens while recession risk remains low, investors may prefer sectors where expectations are less demanding.
Yardeni’s overweight stance therefore fits the broader thesis: earnings strength is no longer monopolized by technology. But financials are not simply a cheaper version of the same trade. Their profits depend on credit, rates, liquidity, regulation, and the shape of economic growth. A policy error by the Federal Reserve or a renewed inflation shock could help some revenue lines while hurting asset quality and valuation.
Industrials: The Physical Economy Behind Digital Growth
Industrials sit at the intersection of several investment cycles: AI infrastructure, grid expansion, factory construction, defense, transportation, energy, and automation. The sector can benefit even when the final customer is a technology company because data centers require physical assets before they can sell digital services.
Caterpillar’s results provided a visible example, but the opportunity extends across electrical equipment, engineering, building products, logistics, machinery, and power systems. A large data-center campus requires land preparation, concrete, steel, transformers, generators, cooling equipment, networking, and access to reliable power. The capital spending appears in national accounts as investment and in corporate results as orders and backlogs.
The July ISM Manufacturing PMI strengthened the case. The index rose to 55.6, its highest reading since May 2022, indicating expansion. New orders, production, and backlogs suggested that demand was flowing through the manufacturing system. Survey data can be volatile and does not measure output directly, but the improvement aligned with the industrial earnings narrative.
Industrial margins can improve rapidly when volumes rise because factories and distribution systems have fixed costs. They can deteriorate just as quickly if orders slow. Price realization also matters. Caterpillar attributed part of its revenue increase to favorable pricing, a benefit that can fade if supply improves or customers resist further increases.
Another risk is capacity duplication. Every hyperscaler wants sufficient compute and power, and every region wants data-center investment. Projects are announced before all power, permitting, financing, and customer demand are secured. If too many projects proceed simultaneously, the industrial beneficiaries can enjoy a boom followed by a sharp inventory and order correction.
For the near term, industrials strengthen the earnings case because they show real-economy transmission. The AI trade is not only a stock-market story. It is changing capital budgets, factory demand, energy systems, and construction. Whether that becomes a durable productivity cycle or an overinvestment cycle will determine how long the sector can outperform.
Health Care: Weak Headline, More Complicated Underneath
Health care was the only S&P 500 sector showing a year-over-year earnings decline in FactSet’s July 31 report. The blended decline was 14.0%. At first glance, that appears inconsistent with Yardeni’s recommendation to overweight the sector.
The composition matters. FactSet said research and development charges related to acquired assets affected estimates and results at companies including Gilead Sciences and Merck. Excluding two major contributors to the decline, the sector would have shown earnings growth of 11.2%. This does not erase the charges; acquired in-process research and development is a real cost of pharmaceutical dealmaking. It does show that the sector’s recurring operations were stronger than the headline aggregate implied.
Health care also offers defensive characteristics. Demand for many medicines and services is less sensitive to the economic cycle than discretionary spending. Large companies often generate cash flow, pay dividends, and maintain global portfolios. Innovation in obesity, oncology, immunology, rare disease, and medical technology can create idiosyncratic growth unrelated to GDP.
The risks are equally specific: patent expirations, clinical failures, pricing regulation, litigation, reimbursement pressure, acquisition costs, and pipeline concentration. A low market multiple can reflect genuine uncertainty rather than neglect.
Within a broadening market strategy, health care can reduce dependence on AI and the economic cycle. It can also disappoint for reasons that have little connection to the index-level earnings forecast. Yardeni’s overweight is therefore best understood as diversification within a bullish market view, not evidence that every health care company is experiencing the same earnings momentum.
The U.S. Economy Is Resilient, but the Data Are Not Uniformly Strong
Yardeni’s market thesis depends on economic resilience. Corporate earnings cannot grow near current expectations indefinitely if household demand collapses, investment contracts, unemployment rises sharply, or credit deteriorates. The latest data support resilience, but not a simple boom narrative.
Real GDP increased at a 1.5% annualized rate in the second quarter, down from 2.1% in the first quarter. The headline was moderate. Beneath it, real final sales to private domestic purchasers—consumer spending plus private fixed investment—rose at a 3.9% rate, up from 1.7%. Government spending declined, while consumer spending, investment, and exports contributed to growth.
Private domestic final sales are useful because they focus on underlying household and business demand. The 3.9% increase supports Yardeni’s assertion that the economy is performing better than the headline GDP number suggests. It also explains why companies can report strong revenue growth even as overall GDP appears restrained.
The labor market is less decisive. Nonfarm payrolls increased by 57,000 in June, and the unemployment rate was 4.2%. Job openings were little changed at 7.4 million, hires at 5.3 million, and quits at 3.2 million. These figures describe a labor market that is stable but no longer rapidly tightening. Employers are not conducting broad layoffs, yet hiring momentum is modest.
Wage growth remained positive. Average hourly earnings increased 3.5% over the year through June. That supports consumer income but can pressure labor-intensive margins. Inflation-adjusted purchasing power depends on which price measure is used and on the composition of household spending.
Manufacturing improved sharply in July, with the ISM PMI at 55.6. Consumer spending also increased in June, with real PCE up 0.4% from the previous month. Together, these figures are consistent with continued expansion.
The mixed picture matters for the market. Very strong growth could increase inflation and push rates higher. Very weak growth would threaten earnings. The ideal environment for a 20-times multiple is moderate real growth, improving productivity, contained credit losses, and gradually easing inflation. The data are close enough to that outcome to support optimism, but far from settled.
Fact Box
The Economic Backdrop as of Early August 2026
- Second-quarter real GDP: +1.5% annualized.
- Real final sales to private domestic purchasers: +3.9% annualized.
- June payroll growth: +57,000.
- June unemployment rate: 4.2%.
- June job openings: 7.4 million.
- July ISM Manufacturing PMI: 55.6.
- June headline CPI: +3.5% year over year; core CPI: +2.6%.
- June headline PCE inflation: +3.7% year over year; core PCE: +3.3%.
Original sources: Bureau of Economic Analysis GDP release, Bureau of Labor Statistics employment report, BLS JOLTS report, ISM manufacturing report, BLS CPI report, and BEA personal income and outlays report.
Inflation Is Lower in Some Measures but Still a Valuation Risk
Inflation data send conflicting signals because different indexes measure different baskets and because energy prices have been unusually volatile. Headline CPI declined 0.4% in June from May, largely because gasoline prices fell, while core CPI was unchanged. Over 12 months, headline CPI rose 3.5% and core CPI 2.6%.
The Federal Reserve’s preferred PCE measure was less reassuring. Headline PCE inflation was 3.7% in June and core PCE 3.3%. The quarterly GDP report showed a 5.1% annualized increase in the PCE price index during the second quarter and 3.4% excluding food and energy. The measures are not contradictory; they use different weights, formulas, and time windows. Together, they show that inflation has cooled in some categories but remains above the Fed’s 2% objective.
Inflation affects the S&P 500 forecast through several channels. Moderate inflation can support nominal revenue and give companies pricing power. High or unstable inflation can raise input costs, compress household purchasing power, increase bond yields, and force tighter monetary policy. The market’s preferred outcome is disinflation without recession.
Energy is especially important. Oil prices rose sharply during the Middle East conflict and then fell on August 4 as investors grew hopeful about a diplomatic arrangement affecting the Strait of Hormuz. Lower oil helped equities by reducing immediate inflation pressure and supporting lower Treasury yields. That favorable move can reverse quickly if negotiations fail or shipping is disrupted.
AI investment may also create inflationary pressure in specific markets. Demand for advanced chips, electricity, construction labor, transformers, turbines, land, and cooling equipment can exceed supply. These bottlenecks can raise the cost of the capital boom even if consumer-goods inflation moderates.
For Yardeni’s target, inflation does not need to return immediately to 2%. It needs to remain contained enough that the Fed does not tighten aggressively and long-term yields do not reprice sharply higher. A stable 20-times multiple is difficult to reconcile with an uncontrolled inflation regime because the discount rate would rise and earnings uncertainty would increase.
The Federal Reserve Is No Longer an Automatic Tailwind
The Federal Open Market Committee left the federal funds target range at 3.5% to 3.75% on July 29. The decision passed 9–3, an unusually divided vote. The committee described economic activity as expanding at a solid pace despite elevated uncertainty and maintained its ample-reserves operating framework.
The hold means monetary policy is restrictive enough to remain relevant but not so tight that it has stopped private demand. The market’s challenge is that the next move is not obvious. Persistent inflation can lead to a rate increase. Weaker labor data can argue for patience or eventual easing. A geopolitical energy shock can worsen inflation while weakening growth, creating an especially difficult trade-off.
Kevin Warsh took office as Federal Reserve chair in May 2026. His communication style and the committee’s division have increased uncertainty about the reaction function. Investors are accustomed to translating speeches, projections, and press conferences into a likely policy path. Less explicit guidance can make bond yields more volatile because markets must infer policy from data with less reassurance about how the Fed will respond.
Long-term rates matter more for equity valuation than the overnight policy rate alone. The 10-year Treasury yield was 4.70% on August 3 and fell during the August 4 rally. Even after the decline, yields remained high compared with much of the post-financial-crisis period. A higher real discount rate reduces the present value of distant earnings, which is particularly important for growth stocks.
There is also a fiscal component. Heavy Treasury issuance, deficits, term premium, and inflation uncertainty can keep long yields elevated even if the Fed eventually reduces short rates. Investors who assume that lower policy rates automatically justify higher equity multiples may overlook that distinction.
Yardeni has long discussed “bond vigilantes”: investors who push yields higher when they believe fiscal or monetary policy is too loose. In the current setting, strong growth and earnings can be bullish for stocks while simultaneously bearish for bonds. If yields rise far enough, the bond move can eventually cap the equity multiple.
The most supportive Fed outcome is not necessarily rapid rate cuts. It is policy stability accompanied by falling inflation and improving productivity. That would allow earnings to grow without a large increase in the discount rate. The least supportive outcome is a renewed inflation shock that forces the Fed to tighten into slowing employment.
Why a 19.6 Forward P/E Is Neither Cheap nor Automatically Excessive
FactSet’s 19.6 forward P/E at the July 31 cutoff was below its five-year average of 19.9 and above its ten-year average of 19.0. That positioning gives both sides evidence. Bulls can say the index is not expensive relative to the recent five-year period, especially given unusually strong growth. Skeptics can say the five-year average itself was elevated and that the market remains above a longer benchmark while Treasury yields are high.
A P/E ratio is not a universal measure of fair value. It must be interpreted alongside growth, profitability, interest rates, inflation, sector mix, accounting quality, and risk. The S&P 500 now contains more high-margin, asset-light, global technology businesses than it did several decades ago. A higher structural multiple may be reasonable if those companies sustain superior returns on capital.
On the other hand, current index composition also creates concentration. A few companies with high margins and strong balance sheets lift the aggregate quality of the index. Investors may overgeneralize those economics to the entire market. When the top companies become a larger share of index earnings and market value, aggregate ratios can look more stable than the experience of the median company.
Alternative valuation measures are more cautious. The cyclically adjusted P/E, which averages inflation-adjusted earnings over ten years, was above 40 in early August according to data based on Robert Shiller’s methodology. The trailing reported P/E and price-to-sales ratio were also high by historical standards. These measures can remain elevated for years and are poor short-term timing tools, but they show that the market is not broadly cheap.
Forward P/E is the most favorable measure when earnings estimates are rising quickly. That does not make it invalid. It means the valuation depends on the estimates. If forward earnings climb from $380 to $400, the multiple falls even before price changes. If estimates are later revised back to $370, the apparent valuation relief disappears.
Yardeni’s framework is therefore internally consistent: rising forward earnings justify the target. The skeptical response is equally coherent: the target depends on a denominator that is unusually optimistic and on a multiple that leaves limited room for disappointment. The disagreement is about the durability of profits and the appropriate risk premium, not the multiplication.
Why the Current Market Is Not 1999—and Why That Comparison Still Has Value
The dot-com comparison is tempting because technology leadership, new infrastructure, enthusiastic capital spending, and claims of transformative productivity all appear in both periods. It is also easy to misuse.
The largest current technology companies have mature businesses, global distribution, recurring revenue, strong balance sheets, and substantial operating cash flow. Cloud computing, digital advertising, enterprise software, smartphones, and e-commerce are established markets. AI revenue is increasingly embedded in products customers already buy. The companies funding the boom are often profitable enough to finance capital expenditure internally.
In 1999, many public companies were valued on traffic, concepts, or expected network effects before they had demonstrated sustainable economics. Telecommunications firms and startups borrowed or issued equity to build capacity that later proved excessive. The resulting collapse combined valuation compression, bankruptcies, and a long period of technology underperformance.
Yardeni’s valuation comparison reinforces the difference. His research placed the technology sector’s forward P/E only slightly above that of the full S&P 500, whereas the premium around the 2000 peak was dramatically wider. If the data are measured consistently, that argues against describing the entire technology sector as a replica of the dot-com bubble.
The historical analogy remains useful in three areas. First, transformative technologies attract capital faster than anyone can estimate demand. Even when the technology changes the economy, early investors can overpay. Second, infrastructure booms create winners in the buildout phase that may not remain winners when capacity becomes abundant. Third, market concentration and narrative confidence can reduce skepticism precisely when it is most valuable.
The railroad, electricity, telecommunications, internet, and cloud cycles all produced real productivity gains and periods of overinvestment. AI can be both economically revolutionary and financially overcapitalized in specific segments. Those statements are not contradictory.
A disciplined comparison therefore avoids two extremes. It is inaccurate to dismiss today’s profitable leaders as 1999-style vaporware. It is equally inaccurate to assume that real technology guarantees attractive returns at any valuation. The question is not whether AI is real. It is whether the cash flows earned by each company justify the price investors pay.
The Bull Case for 8,250
The strongest bullish case rests on six connected arguments.
1. Forward Earnings Continue to Rise
Analysts’ 2027 estimate has moved above $400, and later-quarter growth expectations remain strong. If the estimate reaches $412.50 by year-end, 8,250 requires only a 20-times multiple. That is close to the market’s recent valuation rather than a dramatic re-rating.
2. Earnings Strength Persists After Removing One-Time Gains
Excluding Alphabet and Amazon reduces second-quarter growth to 28.8%, but that is still well above historical norms. Revenue growth of 14.1% and positive earnings in ten sectors support the idea that the expansion is genuine.
3. AI Spending Is Producing Revenue, Not Just Promises
Cloud growth at Microsoft, Amazon, and Alphabet shows customer demand. Palantir’s acceleration shows adoption at the application and data layer. Caterpillar’s results show physical infrastructure demand. The spending cycle is broad enough to affect both digital and industrial companies.
4. The Economy Avoids Recession
Private domestic demand grew at a 3.9% annualized rate in the second quarter. Unemployment remained 4.2%. Job openings were stable. Manufacturing expanded. A non-recessionary economy supports revenue and reduces credit losses.
5. Market Breadth Improves
Equal-weight performance, mid-cap and small-cap forward earnings, financial results, and industrial demand suggest more companies are participating. Better breadth can reduce dependence on a handful of mega-caps.
6. Inflation and Oil Do Not Force a Major Repricing
If oil remains below recent peaks, core inflation continues easing, and the Fed holds rates rather than tightening sharply, the equity multiple can remain near 20. The target does not require immediate rate cuts; it requires the absence of a disruptive increase in discount rates.
Under this scenario, the market’s progress would be driven primarily by the earnings denominator. Investors who sold during the summer’s technology rotation would rebuild positions. Strong results would validate high capital spending. Financials and industrials would continue broadening the rally. The S&P 500 could reach 8,250 without the kind of speculative excess normally associated with a final-stage melt-up.
The Skeptical Case
The strongest skeptical case is not that earnings are weak. They are not. It is that the market is pricing a favorable combination of earnings, inflation, interest rates, and geopolitics with little margin for error.
1. The Most Impressive Earnings Number Is Distorted
The 47.4% second-quarter growth rate is not a clean measure of recurring operating performance. Large mark-to-market gains at Alphabet and Amazon account for much of the increase. The adjusted 28.8% rate is strong, but the difference shows how aggregate statistics can overstate momentum.
2. Forecasts Are Highest Near Peaks in Confidence
Analysts revise estimates based on company guidance, recent results, and economic trends. Record forward earnings demonstrate optimism, not certainty. If growth slows, revisions can become self-reinforcing in the opposite direction.
3. Capital Spending May Outrun Monetization
Hundreds of billions of dollars are being committed to AI infrastructure. Microsoft’s $41 billion quarterly capex and Meta’s $130 billion to $145 billion annual range are signs of confidence, but also of risk. Depreciation and operating expenses will rise. Some customers may build overlapping capacity. The ultimate return on the investment remains uncertain.
4. Long-Term Yields Are High
A forward P/E around 20 is more vulnerable when the 10-year Treasury yield is near the upper end of its recent range. Stocks can absorb high yields while earnings accelerate. If yields rise further or earnings growth slows, valuation compression can be abrupt.
5. Inflation Is Still Above Target
Core PCE inflation at 3.3% is not consistent with victory over inflation. Energy and tariffs can create renewed pressure. A divided Fed may respond later and more aggressively than the market expects.
6. The Labor Market Is Cooling
June payroll growth of 57,000 was modest, and previous months were revised. Stable unemployment and job openings prevent a bearish conclusion, but the next employment reports could reveal a sharper slowdown. Consumer spending eventually depends on income and job security.
7. Geopolitical Relief Can Reverse
The August 4 rally benefited from lower oil and hopes for progress involving Iran and the Strait of Hormuz. Markets can price diplomatic optimism before an agreement is completed. Renewed disruption would affect energy, inflation, shipping, and risk premiums simultaneously.
8. Concentration Magnifies Company-Specific Risk
The largest companies represent an unusually large share of the index. One disappointing cloud outlook, regulatory action, product failure, or capex warning can move the S&P 500 even if most companies are stable.
Under a skeptical scenario, forward earnings could stall below $400 while the multiple falls to 18 or 19. The index would not need a recession to decline. A shift from $400 at 20 times to $385 at 18 times would reduce the implied level from 8,000 to 6,930. That is the valuation risk hidden by seemingly small changes in assumptions.
What Could Invalidate Yardeni’s Forecast?
A useful forecast should have observable failure conditions. Yardeni’s thesis would weaken materially if several of the following occurred together.
- Consensus 2027 S&P 500 EPS falls decisively below $400 rather than continuing toward $412.50.
- Third- and fourth-quarter earnings growth estimates are revised sharply lower.
- Revenue growth slows much faster than earnings, suggesting temporary margin or accounting effects.
- Cloud and AI demand remains strong in reported revenue but hyperscalers reduce future capital budgets because returns are disappointing.
- Industrial backlogs peak and cancellations rise.
- Credit losses increase across consumer, commercial real estate, or corporate lending.
- Unemployment rises quickly while job openings and hiring fall.
- Core inflation reaccelerates and the Fed raises rates more aggressively than expected.
- The 10-year Treasury yield moves materially above the range the equity market has recently absorbed.
- Oil supply disruptions create a prolonged inflation and growth shock.
- Market breadth deteriorates while the index remains dependent on fewer companies.
No single item automatically defeats the forecast. Markets can absorb one negative development when other factors improve. For example, higher rates may be manageable if earnings rise faster. Slower employment can be manageable if productivity increases and inflation falls. A technology correction can be manageable if financials, industrials, health care, and smaller companies advance.
The danger comes from correlation. Inflation can raise yields, weaken consumers, compress margins, and reduce valuations at the same time. An AI spending slowdown can affect chips, cloud platforms, utilities, construction, and industrial equipment simultaneously. A geopolitical shock can raise energy prices and reduce risk appetite together.
Yardeni’s target is therefore a conditional forecast. It assumes the favorable relationships among growth, profits, rates, and risk remain intact. The index’s proximity to 8,250 makes the forecast more achievable, but it also makes the remaining upside more dependent on avoiding a negative combination.
What the Market’s August 4 Reaction Really Said
Market reactions are not referendums with one question. The August 4 advance reflected multiple changes: earnings surprises, lower oil, reduced immediate fear around the Middle East, lower yields, position rebuilding, and a rebound in technology. It would be inaccurate to attribute the full 1.79% S&P 500 gain to Yardeni’s earnings thesis.
The session did show that investors remained willing to buy growth after a violent internal rotation. Semiconductor shares rallied, Palantir surged, and industrial companies advanced. The S&P 500 technology sector led, but equal-weight and non-technology measures also rose. That pattern is consistent with a reset in positioning rather than a narrow squeeze in one stock.
Citadel Securities strategist Scott Rubner had argued in July that a technical reset had largely occurred and that investors could return to fundamentals. Yardeni agreed with the general idea: valuations had declined because earnings rose while investors took profits, leaving room for buyers to re-enter when results confirmed the outlook.
The distinction between a technical reset and a fundamental reset matters. A technical reset reduces crowded positioning, leverage, and short-term overbought conditions. A fundamental reset changes profits, cash flow, or economic expectations. The summer appears to have included both. Some leveraged AI positions were liquidated, while earnings estimates continued rising.
The bullish interpretation is that weak holders sold without damaging the underlying economy or corporate outlook. The skeptical interpretation is that the market quickly returned to crowded trades before long-term risks were resolved. Future volume, breadth, and earnings revisions will show which interpretation is more accurate.
How Investors Should Read Sector Recommendations Without Treating Them as Instructions
Yardeni said his firm had recommended market-weighting information technology and overweighting financials, industrials, and health care. These terms refer to positioning relative to a benchmark, not absolute predictions that every stock in a sector will rise.
A market weight means holding roughly the benchmark’s exposure. Because technology is already a large share of the S&P 500, market-weighting it still represents substantial participation. An overweight means allocating more than the benchmark, which increases both potential return and sector-specific risk.
The sector view expresses three judgments. First, technology earnings remain strong enough to justify participation, but concentration and valuation argue against an aggressive overweight. Second, financials and industrials offer earnings growth tied to broad economic activity and capital spending. Third, health care offers valuation and diversification despite complicated near-term earnings.
Sector allocations can fail even if the index forecast succeeds. Technology could lead the market so strongly that market weight underperforms. Financials could suffer from credit losses. Industrials could face an order slowdown. Health care could experience clinical or regulatory setbacks. The benchmark can reach 8,250 through a different mix of winners than Yardeni expects.
For readers, the analytical value lies in the broadening thesis. The forecast is not solely a bet that mega-cap technology will continue expanding its multiple. It is a bet that earnings growth will spread and that sectors with lower valuations or different economic drivers will contribute.
This article is provided for general informational purposes and does not constitute financial, investment, tax, or legal advice.
A Practical Dashboard for Tracking the 8,250 Forecast
The forecast can be monitored without trying to predict every daily market move. A small set of indicators reveals whether its underlying assumptions are strengthening or weakening.
Forward S&P 500 EPS
The first measure is the consensus forward-earnings estimate. The relevant question is not merely whether it remains above $400, but how it gets there. A steady rise supported by company guidance and broad revisions is stronger than a jump caused by calendar weighting or a few unusual items.
Revision Breadth
Count how many sectors and companies receive upward versus downward revisions. Broad positive revisions indicate that analysts see improving demand and margins across the economy. A rising aggregate estimate accompanied by deteriorating breadth would signal increasing concentration.
Revenue Versus EPS Surprises
Revenue beats provide evidence of demand. EPS beats reveal profitability relative to expectations. When both occur together, the result is generally more convincing than an EPS beat produced only by taxes, buybacks, or lower costs. The size and persistence of guidance changes matter more than the percentage of companies that beat by a few cents.
Free Cash Flow and Capital Expenditure
For AI beneficiaries, investors should compare incremental revenue and operating cash flow with the growth in capital spending. A temporary decline in free cash flow can be rational during a productive buildout. The concern would be several years of rising investment without a corresponding improvement in utilization, pricing, backlog conversion, or cash generation.
Long-Term Treasury Yields
The 10-year yield is a practical gauge of the discount-rate pressure on equities. A stable or falling yield alongside rising earnings supports the target. A sharp rise in yields would require faster profit growth to preserve the same index valuation.
Equal-Weight and Smaller-Company Earnings
The capitalization-weighted S&P 500 can advance while the typical stock struggles. The equal-weight index, mid-cap and small-cap forward earnings, and sector-level revisions provide a check on breadth. Sustained confirmation outside the largest companies would make the forecast less dependent on mega-cap technology.
Credit Conditions
Bank lending standards, delinquency rates, corporate spreads, and loan-loss provisions can reveal stress before it becomes visible in aggregate GDP. Financial-sector earnings are strongest when activity remains healthy and credit costs stay contained. A simultaneous widening of spreads and increase in provisions would challenge the soft-landing assumption.
Inflation Composition
Headline inflation can move sharply with gasoline. Core services, shelter, wages, and business input costs provide a clearer view of persistent pressure. The bullish configuration is slowing underlying inflation with continued real demand. Falling inflation caused by collapsing demand would be less supportive for earnings.
Market Response to Good News
Finally, observe how prices react to strong results. When companies beat expectations and raise guidance but their shares fall, valuations may already discount the improvement. When broad groups advance on better earnings while multiples remain stable, the market is behaving more consistently with Yardeni’s earnings-led thesis.
No dashboard can eliminate uncertainty. Its value is discipline. The 8,250 forecast should become more credible when earnings, cash flow, breadth, and economic data improve together. It should become less credible when the index rises mainly because investors pay more for an unchanged or increasingly concentrated profit outlook.
What Happens Next
The next several weeks contain scheduled tests of nearly every assumption in the forecast.
August 6: Productivity and Costs
Productivity is central to Yardeni’s long-running “Roaring 2020s” framework. Faster output per hour allows wages and profits to rise without creating the same inflation pressure. A strong productivity reading would support the idea that technology investment is improving the economy’s supply capacity. A weak reading would increase concern that AI capex is raising costs faster than output.
August 7: July Employment Report
The June report showed modest payroll growth and 4.2% unemployment. The July report will indicate whether the labor market is stable, cooling gradually, or weakening more rapidly. Markets will focus on payrolls, unemployment, wages, hours, participation, and revisions.
August 12: July CPI
The June CPI benefited from a large monthly decline in gasoline. July will show whether core disinflation continued and how renewed energy volatility affected the headline. A soft core reading would support stable rates and valuations. A hot report could revive expectations of Fed tightening.
Continuing Earnings Releases
As the remaining S&P 500 companies report, the blended earnings rate will change. The key question is whether strong results persist beyond the largest companies and whether management guidance supports the third- and fourth-quarter growth estimates.
August 19: July FOMC Minutes
The minutes will provide more detail about the 9–3 vote and the committee’s discussion of inflation, employment, and risks. Investors will look for evidence about what would trigger a rate increase or continued hold.
September 15–16: Federal Reserve Meeting
The September meeting includes updated economic projections. By then, policymakers will have additional employment and inflation data. The meeting could materially change the discount-rate assumption behind a 20-times forward P/E.
Geopolitics will not follow a calendar. Developments affecting Iran, the Strait of Hormuz, oil supply, shipping insurance, and U.S. policy can change the outlook before any scheduled data release.
Frequently Asked Questions
What is Ed Yardeni’s S&P 500 target for 2026?
Yardeni Research’s year-end 2026 target is 8,250. After the S&P 500 closed at 7,736.52 on August 4, the target was approximately 6.6% higher than the latest close.
How does Yardeni get to S&P 500 at 8,250?
His framework combines forward earnings with a forward P/E. Forward earnings of $412.50 multiplied by 20 equal 8,250. Alternatively, $400 in forward earnings multiplied by 20.625 also produces 8,250.
What are forward earnings?
Forward earnings are a rolling estimate of profits over the next 12 months, commonly calculated from a time-weighted blend of current-year and next-year analyst estimates. The number changes as the calendar advances and analysts revise forecasts.
Is the S&P 500 earnings growth rate really 47.4%?
FactSet’s blended estimate was 47.4% as of July 31. The figure included large GAAP investment gains at Alphabet and Amazon. Excluding both companies reduced the rate to 28.8%, which remained very strong.
Why did Alphabet and Amazon have such large earnings gains?
Alphabet reported a $98 billion gain largely related to equity securities. Amazon reported $53.4 billion of non-operating pre-tax other income, primarily related to Anthropic investments. These gains increased GAAP earnings but are not equivalent to recurring operating profit.
Is technology cheaper than the overall market?
Yardeni Research estimated the S&P 500 Information Technology sector near 20 times forward earnings and the full index near 19.4 in early August. That meant technology’s relative premium was small. The sector was not necessarily cheap in absolute historical terms.
Why does Yardeni say this is not like the dot-com bubble?
Current technology leaders generate large revenues, profits, cash flow, and recurring business. Yardeni also points to a much smaller forward-P/E premium for technology over the index than at the 2000 peak. Concentration and overinvestment risks still remain.
What is the strongest evidence supporting the forecast?
The strongest evidence is record forward earnings, 28.8% second-quarter growth even after excluding Alphabet and Amazon, 14.1% revenue growth, positive earnings in ten sectors, strong cloud demand, and improving industrial activity.
What is the biggest risk to the forecast?
The biggest risk is a combined earnings and valuation disappointment. If forward estimates are cut while long-term interest rates rise, the index can fall even without a recession.
Does the forecast require Federal Reserve rate cuts?
No. The target can be reached if earnings rise and the forward P/E remains near 20. Rapid rate cuts are not required. A sharp rate increase or sustained rise in long-term yields would make the valuation more difficult to maintain.
What should readers watch next?
Key indicators include forward EPS revisions, third- and fourth-quarter guidance, cloud growth, AI capital expenditure, industrial backlogs, the July employment and CPI reports, Treasury yields, oil prices, and the September Fed meeting.
Final Assessment
Yardeni’s 8,250 target is credible because it no longer requires an extreme leap from the market’s latest level. The S&P 500 needs approximately 6.6% from the August 4 close. If forward earnings reach $412.50 and investors maintain a 20-times multiple, the target follows directly.
The evidence supporting the earnings side is substantial. Second-quarter revenue growth is broad. Cloud businesses are expanding rapidly. Semiconductor and software demand remain strong. Financials have contributed positive surprises. Industrial companies are benefiting from power and infrastructure spending. Private domestic demand grew faster than headline GDP. Manufacturing accelerated in July.
The headline evidence must still be cleaned. A 47.4% aggregate earnings growth rate gives an exaggerated impression because unrealized investment gains at Alphabet and Amazon had an enormous effect. The adjusted 28.8% rate is the more persuasive statistic. It is lower, but it is also more durable evidence for the bull case.
The strongest concern is valuation. A forward P/E near 20 leaves the market sensitive to estimate cuts and long-term yields. Inflation remains above the Fed’s target. The 10-year Treasury offers a meaningful alternative return. AI capital spending is so large that future depreciation and utilization matter as much as current demand. Market concentration remains historically high.
The forecast therefore deserves neither dismissal nor certainty. It is a coherent earnings-based scenario supported by current revisions and operating data. It is not a guarantee that the index has become inexpensive or that the AI investment cycle will produce adequate returns everywhere.
The decisive variable is forward earnings quality. If the consensus estimate above $400 is sustained by recurring cloud revenue, advertising growth, industrial orders, banking profits, and broader corporate margins, 8,250 may prove conservative. If that estimate is maintained only by one-time gains, optimistic guidance, and a willingness to capitalize distant profits at a high multiple, the target will be much harder to defend.
For now, the market has answered one question: investors were willing to return to technology and cyclical growth after the summer reset. The next answer must come from the companies themselves. They need to convert record spending and record expectations into cash flow that survives higher depreciation, volatile energy prices, and a Federal Reserve still confronting inflation. That is the earnings test behind 8,250.
Sources
- S&P Dow Jones Indices — U.S. equity index market data
- Reuters — Dow and S&P 500 close at records on AI-linked earnings and Middle East hopes
- Yardeni QuickTakes — Great Expectations
- Yardeni QuickTakes — Situational (Un)Awareness and the market reset
- Yardeni QuickTakes — Information Technology Is On Sale
- FactSet — S&P 500 Earnings Season Update, July 31, 2026
- Microsoft — Fiscal 2026 fourth-quarter earnings release
- Amazon — Second-quarter 2026 results
- Alphabet — Second-quarter 2026 earnings call
- Meta Platforms — Second-quarter 2026 results
- Apple — Fiscal third-quarter 2026 results
- Palantir — Second-quarter 2026 business update
- Caterpillar — Second-quarter 2026 results
- Bureau of Economic Analysis — Second-quarter 2026 GDP advance estimate
- Bureau of Economic Analysis — Personal Income and Outlays, June 2026
- Bureau of Labor Statistics — Employment Situation, June 2026
- Bureau of Labor Statistics — Consumer Price Index, June 2026
- Bureau of Labor Statistics — Job Openings and Labor Turnover, June 2026
- Institute for Supply Management — July 2026 Manufacturing PMI
- Federal Reserve — July 29, 2026 FOMC statement
- Federal Reserve Bank of St. Louis — 10-year Treasury constant-maturity yield
- S&P Dow Jones Indices — In the Shadows of Giants
- S&P Dow Jones Indices — Equal Weight Sector Dashboard
- Bureau of Labor Statistics — 2026 release calendar
- Federal Reserve — FOMC meeting calendar
Affiliate disclosure: Businessfinance.news may earn compensation from qualifying actions completed through selected links on this website, at no additional cost to the reader. Affiliate relationships do not influence our editorial reporting, analysis, or conclusions.