Last updated: July 31, 2026, 3:45 a.m. EDT
Amazon and Apple delivered the same broad headline on Thursday night: quarterly results that exceeded many Wall Street expectations. The market’s first reaction could hardly have been more different. Amazon shares rose roughly 9% in late after-hours trading after Amazon Web Services accelerated to 37% revenue growth, while Apple shares fell about 5% to 6% as management warned that supply constraints and foreign-exchange pressure would slow growth in the September quarter.
The split matters because it captures the central argument now driving the largest technology stocks. Investors are not rewarding earnings beats in isolation. They are asking whether enormous spending on artificial intelligence is producing measurable revenue, whether that revenue is translating into durable operating profit, and whether the next quarter looks stronger or weaker than the one just reported. Amazon answered those questions with faster cloud growth, a large operating-income contribution from AWS and a decision to raise 2026 capital spending to approximately $220 billion. Apple reported record June-quarter revenue and earnings per share, but its guidance suggested that component shortages could prevent the company from fully satisfying demand during its most important product season.
The reports arrived after an unusually sharp rebound in U.S. stocks. On July 30, the S&P 500 rose 1.66% to 7,437.63, the Nasdaq Composite gained 2.78% to 24,122.18, and the Dow Jones Industrial Average climbed 1.19% to 52,208.06. Microsoft was the dominant force behind the move, rising about 15.5% after reporting rapid Azure growth, strong cash generation and an outlook that reassured investors about the economics of AI infrastructure. Semiconductor stocks also rebounded. The rally followed a difficult session in which the Federal Reserve held its policy rate steady, long-term Treasury yields rose and doubts about the central bank’s inflation credibility unsettled markets.
That means Thursday’s market action was not a simple celebration of technology earnings. It was a repricing of several related risks: cloud demand, capital intensity, supply shortages, inflation, interest rates and the economic consequences of the U.S.-Iran conflict. The Strait of Hormuz remained effectively constrained, West Texas Intermediate crude settled at $83.59 a barrel, and the Federal Reserve’s preferred inflation gauge was still 3.7% higher than a year earlier in June. Stronger AI revenue offered a powerful counterweight, but it did not remove the macroeconomic risks.
The most useful way to interpret the Amazon and Apple earnings is therefore not to declare one company a winner and the other a loser. Amazon’s quarter showed why investors are willing to tolerate negative free cash flow when cloud growth and contracted demand are accelerating. Apple’s quarter showed why an excellent backward-looking result can still disappoint when supply limits, product costs and services growth complicate the next forecast. Together with Microsoft’s surge, the reports show a market demanding evidence that strategy, spending and execution are aligned.
Key Takeaways
- Amazon’s central development: Second-quarter 2026 net sales rose 20% to $200.6 billion, while AWS revenue increased 37% to $42.2 billion, its fastest growth in 18 quarters.
- Apple’s central development: Fiscal third-quarter revenue rose 16% to $109.4 billion and diluted earnings per share increased 29% to $2.02, but September-quarter revenue growth guidance of 9% to 11% fell below the pace many investors expected.
- Market response: Amazon rose roughly 9% after hours, while Apple fell approximately 5% to 6%. Microsoft had already gained about 15.5% during regular trading and led a broad index rebound.
- Quality-of-earnings issue: Amazon’s $62.6 billion net income included a large non-operating gain, primarily related to its Anthropic investment. Apple’s reported 50.1% gross margin and $2.02 EPS included benefits from tariff refunds.
- AI spending: Amazon raised expected 2026 capital expenditures to about $220 billion. The market accepted the increase because AWS growth accelerated and management said capacity remained insufficient to meet demand.
- Macro backdrop: U.S. real GDP grew at a 1.5% annualized rate in the second quarter, June PCE inflation was 3.7% year over year, and the Fed kept the federal-funds target range at 3.50% to 3.75%.
- What comes next: Investors will test whether Amazon can convert its AI buildout into free cash flow and whether Apple can navigate chip and memory shortages during the September product cycle.
Fact Box
The July 30 Market Close
- S&P 500: 7,437.63, up 1.66%
- Nasdaq Composite: 24,122.18, up 2.78%
- Dow Jones Industrial Average: 52,208.06, up 1.19%
- Microsoft: up approximately 15.5% in regular trading
- WTI crude: settled at $83.59 a barrel, down 1.03%
Original sources: Associated Press market close data and Reuters oil-market report
What Happened in the Final Hours of July 30
The trading day began with investors still processing a difficult combination of signals. The Federal Reserve had left interest rates unchanged the previous afternoon, but the decision did not calm the bond market. Three policymakers dissented in favor of a quarter-point increase, and Chair Kevin Warsh offered limited guidance about what would be required for the next move. Long-dated Treasury yields rose as investors considered whether inflation might remain above target for longer and whether monetary policy would be sufficiently restrictive.
Then Microsoft changed the tone. The company reported $90.0 billion in fiscal fourth-quarter revenue, up 18% from a year earlier, and $40.6 billion in operating income. Azure and other cloud-services revenue increased 43%. Microsoft Cloud revenue reached $59.3 billion, and commercial remaining performance obligations rose 84% to $678 billion. Those figures gave investors evidence that the demand behind AI infrastructure was not merely a collection of pilot projects or optimistic forecasts. Customers were signing contracts, cloud revenue was accelerating and the company was still producing substantial profit.
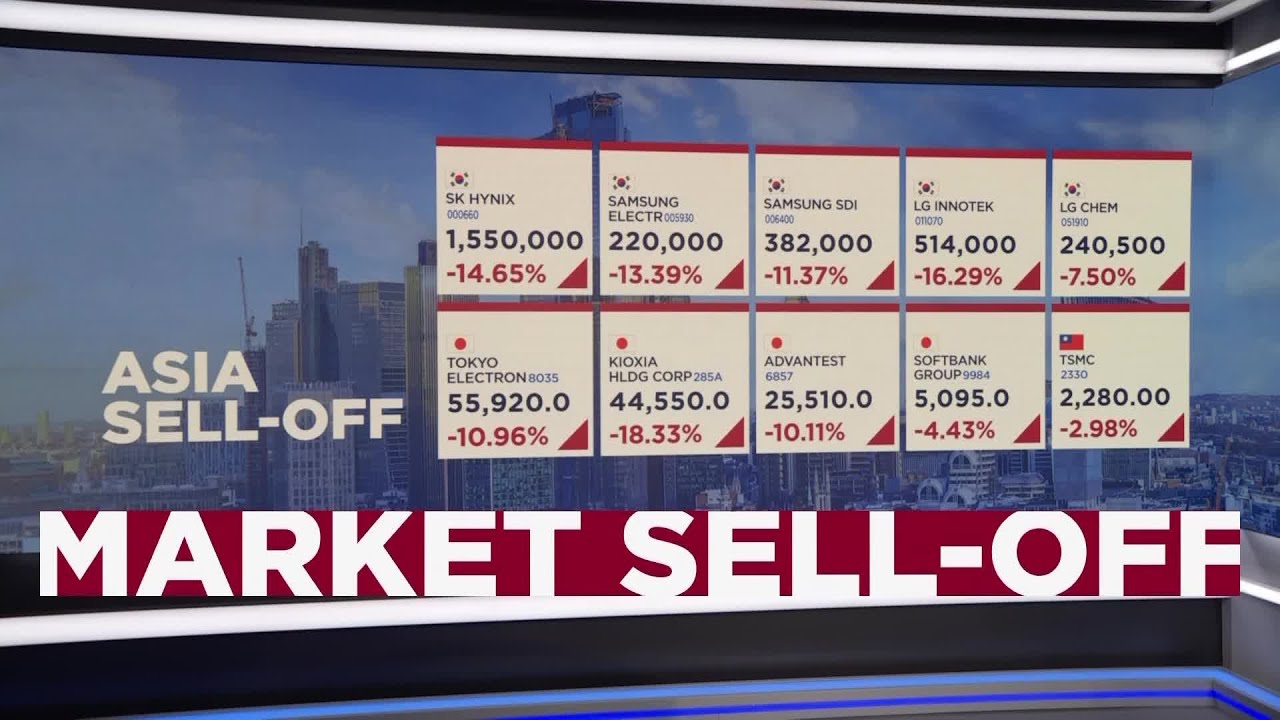
Microsoft’s rally spread quickly through the technology complex. Chipmakers rebounded because cloud operators are among the largest buyers of advanced processors, memory, networking equipment and data-center systems. Micron rose sharply. The Philadelphia Semiconductor Index gained about 8%. The market’s internal composition changed from the prior day, when semiconductor weakness and rate anxiety had dominated trading.
The rebound was powerful, but it was not completely broad. A small number of mega-cap technology companies contributed a disproportionate share of the major indexes’ gains. That concentration is important. When a stock as large as Microsoft rises more than 15% in one session, it can make the overall market appear healthier than the median company. The Nasdaq’s 2.78% gain therefore reflected both a genuine improvement in risk appetite and the arithmetic influence of its largest members.
After the closing bell, Amazon extended the pro-AI narrative. AWS growth accelerated from 28% in the previous quarter to 37%, and the cloud segment generated $16.6 billion in operating income. Apple complicated the story. Its reported quarter was strong, especially for the iPhone and Mac, but the company warned that supply constraints would become more severe in the next quarter. The resulting after-hours divergence was a lesson in how earnings are priced: the market weighs the new information about the future more heavily than the already-known information about the past.
The final hours of July 30 thus produced three distinct verdicts. Microsoft received a strong vote of confidence because growth, backlog and cash generation supported its spending. Amazon received a conditional endorsement because rapid AWS growth appeared to justify even more investment. Apple was marked down because its guidance indicated that operational constraints could limit near-term upside even after a record quarter.
Why Amazon and Apple Earnings Moved Shares in Opposite Directions
At first glance, both companies exceeded headline expectations. Amazon’s sales surpassed the consensus figures cited by major financial-data providers, and Apple’s revenue and earnings per share also came in above forecasts. Yet an earnings release contains several layers of information, and the market does not value them equally.
The first layer is the reported quarter: revenue, profit, margins and cash flow. The second is the composition of those results. A company can beat estimates because its strongest business improved, because a low-quality one-time item boosted earnings, because currency moved favorably or because analysts had lowered expectations. The third layer is guidance. Management’s forecast often has more influence over the stock price than the quarter just completed. The fourth is strategic credibility: whether management’s spending and operational decisions appear likely to create future cash flows.
Amazon’s reported quarter contained an unusually attractive combination for an infrastructure-heavy growth story. AWS grew faster, its operating income increased materially, advertising remained strong and the retail operations were profitable. Amazon simultaneously raised capital spending, but it explained the increase as a response to demand and higher component costs rather than a speculative attempt to manufacture demand. Investors could see a direct line from data-center investment to contracted cloud workloads.
Apple’s quarter contained the opposite timing pattern. Current demand was strong, but management said supply limitations would intensify. Foreign exchange would become a larger headwind. Services growth, while still double-digit, was below some expectations. The company projected 9% to 11% revenue growth for the September quarter, a healthy rate for a business of Apple’s size but below the roughly 12% pace that Wall Street had expected. The market therefore revised the near-term trajectory downward even though it revised the completed quarter upward.
The quality of reported earnings also required adjustment. Amazon’s net income of $62.6 billion was not a clean measure of recurring profitability because it included $53.4 billion of non-operating pre-tax other income, primarily related to its Anthropic investment. Amazon’s $27.5 billion of operating income was more informative for assessing the performance of its core businesses. Apple’s $2.02 in diluted earnings per share included an estimated $0.11 benefit from tariff refunds, while its 50.1% reported gross margin included an approximately two-percentage-point benefit from the same factor. Excluding the refunds, Apple’s underlying margin was lower.
None of this makes Amazon’s result unquestionably superior or Apple’s result weak. Amazon’s enormous spending has driven trailing free cash flow below zero, and the economics of AI infrastructure could deteriorate if utilization, pricing or technology lifecycles disappoint. Apple remains one of the world’s most profitable companies, with a vast installed base, strong customer retention and a high-margin services ecosystem. The different stock reactions reflected changes in expectations, not definitive judgments about long-term corporate quality.
The Market Was Pricing an AI Cash-Flow Test, Not Just an Earnings Beat
The largest technology companies have entered a phase in which capital expenditures are becoming as important to investors as revenue growth. Building AI capacity requires land, power contracts, data centers, servers, networking equipment, cooling systems and increasingly expensive memory. Those investments appear in cash flow before the associated revenue is fully recognized. That creates a recurring tension: companies can report strong accounting earnings while free cash flow weakens because capital spending accelerates.
The market’s tolerance for that pattern depends on evidence. Investors are more willing to accept lower free cash flow when three conditions are present. First, the company must show that demand is real and not merely anticipated. Contracted backlog, capacity reservations and accelerating revenue help. Second, operating economics must remain attractive. Cloud margins, asset utilization and pricing discipline matter. Third, management must show that the investment cycle is controlled rather than open-ended.
Microsoft met much of that test. Azure growth reached 43%, commercial remaining performance obligations expanded sharply and management indicated that the company could fund its infrastructure ambitions while maintaining strong operating performance. Amazon met the demand test through AWS acceleration and management’s description of capacity shortages. It did not meet the free-cash-flow test in the current period, but investors appeared willing to defer that concern because the cloud business produced strong operating income and the company’s backlog and customer commitments supported further construction.
Apple is not primarily a public-cloud infrastructure provider, so its capital-allocation problem is different. Apple’s challenge is to integrate AI into devices and services without sacrificing its privacy positioning, hardware margins or customer experience. Its supply constraints also show that AI demand affects companies that are not selling cloud capacity. Advanced logic chips, DRAM and NAND memory are shared inputs across phones, computers, servers and AI accelerators. When data-center demand raises component prices or absorbs manufacturing capacity, consumer-device companies can face higher costs and fewer available parts.
That link helps explain why the market treated Amazon’s capital spending and Apple’s supply warning as parts of the same story. The AI investment cycle creates revenue for cloud providers and chip suppliers, but it also creates scarcity and cost pressure elsewhere. Amazon can monetize capacity through AWS contracts. Apple must protect device availability and margins during major product launches. The same industry boom can therefore improve one company’s outlook while constraining another’s.
Amazon Q2 2026 Results: The Numbers Behind the After-Hours Jump
Amazon reported second-quarter net sales of $200.6 billion for the three months ended June 30, 2026, up 20% from $167.7 billion a year earlier. The result was broad. North America sales increased 16% to $116.2 billion, International sales rose 15% to $42.2 billion, and AWS sales climbed 37% to $42.2 billion. Operating income increased 43% to $27.5 billion from $19.2 billion.
The operating-income mix is central to understanding the quarter. AWS generated $16.6 billion of operating income, compared with $10.2 billion a year earlier. That means the cloud division contributed roughly 60% of Amazon’s total operating income while accounting for about 21% of consolidated sales. North America produced $9.1 billion in operating income, and the International segment contributed $1.7 billion. The result illustrates why AWS has such an outsized effect on Amazon’s valuation: it is not only a fast-growing business but also the company’s largest profit engine.
Amazon reported net income of $62.6 billion, or $5.75 per diluted share, up from $18.2 billion, or $1.68 per share, in the prior-year quarter. That increase should not be interpreted as a comparable increase in recurring operating earnings. The quarter included $53.4 billion of non-operating pre-tax other income, primarily related to Amazon’s investment in Anthropic. Changes in the estimated value of private-company stakes can create large accounting gains or losses without producing equivalent cash in the quarter.
For that reason, the most informative figures are operating income, segment performance, operating cash flow and capital expenditures. Amazon generated $45.4 billion in operating cash flow during the quarter but spent approximately $53 billion on capital expenditures, according to management commentary and the company’s cash-flow disclosures. On a trailing-12-month basis, free cash flow was an outflow of $7.6 billion, compared with an inflow of $18.2 billion in the comparable prior-year period.
That cash-flow deterioration did not prevent the stock from rising because AWS growth changed the interpretation of the spending. If capex had risen while cloud growth slowed, the market would likely have treated the investment as a warning. Instead, AWS accelerated by nine percentage points from the first quarter’s 28% growth rate. The company also said its AI and custom-chip businesses had each surpassed a $25 billion annualized revenue run rate. Those disclosures suggested that the infrastructure was supporting businesses already operating at meaningful scale.
Amazon’s third-quarter outlook was more restrained. The company projected net sales of $197 billion to $202 billion, compared with the higher consensus estimate cited by FactSet in contemporaneous reporting. Guidance therefore did not explain the after-hours rally. The positive reaction was primarily about the AWS acceleration, the profitability of cloud growth and management’s confidence that demand remained greater than available capacity.
| Amazon Q2 2026 metric | Reported result | Year-over-year change | Why it matters |
|---|---|---|---|
| Net sales | $200.6 billion | Up 20% | Growth was broad across retail, cloud and advertising. |
| Operating income | $27.5 billion | Up 43% | A better measure of core performance than net income this quarter. |
| AWS revenue | $42.2 billion | Up 37% | Fastest growth in 18 quarters and the main reason for the stock reaction. |
| AWS operating income | $16.6 billion | Up from $10.2 billion | Shows that rapid growth was accompanied by substantial profitability. |
| Net income | $62.6 billion | Up from $18.2 billion | Included a large non-operating gain tied mainly to Anthropic. |
| Advertising services | $19.8 billion | Up 26% | High-margin growth diversifies Amazon beyond retail and cloud. |
Amounts are in U.S. dollars for the quarter ended June 30, 2026. Sources: Amazon’s earnings release and SEC exhibit; advertising revenue from Amazon’s reported supplemental data.
AWS Accelerated on a Base That Was Already Enormous
AWS’s 37% growth rate is more important than it might appear. Percentage growth naturally becomes harder to sustain as a business becomes larger. AWS added approximately $11.3 billion of quarterly revenue from a year earlier, an increase that would itself be a substantial cloud business. Its quarterly run rate implied annualized revenue of roughly $169 billion.
The acceleration also reversed a concern that had followed Amazon through earlier quarters. Investors had questioned whether AWS was losing momentum relative to Microsoft Azure and Google Cloud, particularly as generative-AI workloads expanded. AWS remained the largest infrastructure-cloud provider by revenue, but competitors were reporting faster percentage growth. The second-quarter result did not settle the competitive debate, because the companies disclose cloud metrics differently, yet it demonstrated that AWS was participating fully in the AI demand cycle.
Several forces likely contributed. Enterprises continue to migrate traditional computing workloads from privately owned data centers to public cloud platforms. At the same time, companies building and deploying AI models require large amounts of training and inference capacity. Amazon has also expanded its custom-silicon strategy through Trainium chips for AI training and Inferentia chips for inference. Custom chips can lower the cost of certain workloads, reduce dependence on external suppliers and create tighter integration between AWS hardware and cloud services.
The economics are not automatic. Cloud providers must invest before revenue is recognized, and customers can negotiate aggressively when they commit large volumes. Hardware becomes obsolete, power costs fluctuate and new chip generations can change the cost structure. A data center may last decades, but servers and accelerators have much shorter useful lives. The value of AWS’s growth therefore depends on utilization and the rate at which each generation of equipment earns back its cost.
Amazon’s quarter offered encouraging evidence on this point. AWS operating income of $16.6 billion on $42.2 billion of revenue implies an operating margin of approximately 39.3%. That margin was unusually strong for a business investing at such a rapid pace. It suggests that established cloud services, pricing, efficiency improvements and higher utilization were offsetting at least part of the cost of new AI capacity.
Still, a single quarter should not be extrapolated mechanically. Segment operating income can be affected by depreciation schedules, stock-based compensation allocation, energy costs, the mix of services sold and timing differences between capacity installation and customer usage. AWS could continue to grow rapidly while its margin fluctuates. Investors will need several quarters of data to determine whether the second quarter marks a durable improvement or a particularly favorable point in the investment cycle.
Why Cloud Backlog Matters
Cloud revenue recognizes only the services delivered during a reporting period. Large enterprise contracts often extend over several years, meaning a company can have substantial committed demand that has not yet appeared in revenue. Remaining performance obligations and backlog therefore help investors judge whether current growth is supported by future commitments.
Amazon indicated that customer demand continued to exceed available capacity and that a meaningful amount of future capacity had already been reserved. This is a critical distinction. Spending to satisfy signed or highly visible commitments carries less risk than constructing capacity in the hope that customers will eventually arrive. It does not eliminate risk—contracts can contain flexibility, customer usage can vary and pricing can change—but it improves the evidence behind management’s investment plan.
Microsoft provided a related signal through its $678 billion of commercial remaining performance obligations, up 84% from a year earlier. The measures are not directly comparable because company definitions and contract mixes differ. Even so, both companies reported a large body of work that will be recognized as revenue over time. That made the AI buildout look less speculative than it did when the investment wave first accelerated.
Amazon Raised Capital Spending to $220 Billion—and the Stock Still Rose
Amazon’s decision to raise expected 2026 capital expenditures from approximately $200 billion to $220 billion would ordinarily create pressure on the stock. Higher capex reduces near-term free cash flow and increases the amount of future profit required to justify the investment. In this case, investors initially accepted the increase because management tied it to two concrete factors: higher memory costs and demand that continued to exceed capacity.
The scale is extraordinary. Amazon spent about $128 billion on capital expenditures in 2025, according to the company and contemporaneous reporting. A $220 billion plan would represent an increase of roughly 72% in one year. The spending includes more than AI servers. It covers data centers, networking, chips, robotics, logistics systems, satellite infrastructure and other long-lived assets. AWS is the dominant component, but it is not the only one.
Management’s argument rests on the relationship between asset life and customer demand. Data-center buildings can remain useful for decades and support multiple generations of servers. Networking and power infrastructure can be upgraded. Servers and accelerators have shorter lives, but cloud providers can adjust purchases more quickly than they can adjust construction. Amazon also argues that many AI servers can recover their cost within two to three years while remaining in service longer, creating attractive returns if utilization stays high.
The skeptical case begins with free cash flow. A business can report rising operating income while consuming cash if investment outpaces cash generation. Amazon’s trailing free cash flow fell to negative $7.6 billion. If AI pricing declines, customers improve model efficiency, specialized competitors take share or hardware becomes obsolete faster than expected, the company could earn lower returns on its new assets. The sheer size of the program also creates execution risk involving power availability, permitting, construction schedules and supply chains.
There is also a financing and valuation issue. Amazon can fund the spending because its operating businesses generate large cash flows and it retains access to capital markets. Smaller competitors may not have that flexibility. This can strengthen Amazon’s competitive position by raising the cost of entry, but it can also encourage an industry-wide arms race in which every hyperscaler builds aggressively to avoid falling behind. If all major providers add capacity simultaneously, pricing could weaken even as demand grows.
Investors should therefore interpret the after-hours rise as conditional approval. The market did not declare that any amount of spending was acceptable. It rewarded a quarter in which AWS growth and operating profit offered evidence that the investment was working. Future quarters will have to repeat that evidence. If growth slows while capex remains near $220 billion, free cash flow will return to the center of the debate.
Fact Box
Amazon’s AI Investment Trade-Off
- Expected 2026 capital expenditures: approximately $220 billion
- Previous 2026 estimate: approximately $200 billion
- Trailing-12-month free cash flow: negative $7.6 billion
- AWS Q2 revenue growth: 37%
- AWS Q2 operating income: $16.6 billion
Original sources: Amazon’s second-quarter earnings release and Amazon’s SEC earnings exhibit
Amazon’s Net Income Was Real Accounting Profit, but Not Recurring Operating Profit
Amazon’s $62.6 billion in quarterly net income was one of the most striking numbers in the release, but it requires careful interpretation. The company recorded $53.4 billion of non-operating pre-tax other income, primarily from its investment in Anthropic. Accounting standards can require companies to recognize changes in the value of investments, including private-company holdings, when observable transactions or other valuation events provide a new reference point.
That gain is part of GAAP net income. It should not be dismissed as fictitious. Amazon’s ownership interest may have become more valuable, and that increase affects shareholder wealth. But the gain did not arise from selling more cloud services, shipping more packages or displaying more advertisements during the quarter. It also did not necessarily produce an equivalent amount of cash. The value could change again in future periods.
Operating income is therefore the better starting point for evaluating the quarter’s repeatable business performance. Amazon generated $27.5 billion in operating income, a 43% increase. Even that figure should be analyzed by segment because AWS contributed most of the increase. The retail businesses were profitable and growing, but their margins remained far below the cloud division’s margin.
The distinction matters for valuation. Price-to-earnings ratios can become misleading when one-time investment gains inflate earnings. An investor comparing Amazon’s reported net income with another company’s operating-derived profit would not be making a like-for-like comparison. Free cash flow also tells a very different story because Amazon was investing more cash than it generated after operating expenses.
A useful interpretation is to separate three economic layers. The first is operating performance: $27.5 billion of operating income. The second is investment revaluation: the Anthropic-related gain. The third is reinvestment: approximately $53 billion of quarterly capital expenditures. Amazon’s headline net income was exceptional, its core operating performance was strong, and its cash conversion was weak because of deliberate investment. All three statements can be true at the same time.
Retail and Advertising Made the Amazon Story More Durable
AWS dominated the market reaction, but Amazon’s non-cloud businesses reduced the risk that the quarter was a one-engine result. North America revenue rose 16% to $116.2 billion, while segment operating income increased to $9.1 billion from $7.5 billion. International revenue rose 15% to $42.2 billion, and operating income improved to $1.7 billion from $1.5 billion.
Retail growth benefited from faster delivery, logistics efficiency and the timing of Prime Day, which was moved into the second quarter. Shifting the event between quarters can distort year-over-year comparisons, so investors should not assume that the entire acceleration reflects underlying demand. Even so, Amazon reported record delivery speeds and continued to expand same-day and rapid-delivery options. Faster delivery can increase purchase frequency, improve Prime retention and make the company more attractive to merchants.
Advertising services generated approximately $19.8 billion of revenue, up 26%. This business is strategically important because Amazon has direct knowledge of shopping behavior and purchase intent. Advertisers can place products near the point of sale, making the service attractive to merchants seeking measurable returns. Advertising also tends to carry higher margins than first-party retail sales, although Amazon does not disclose a separate operating-profit figure for the segment.
The combination of commerce, advertising and cloud creates reinforcing data and distribution advantages. Retail traffic attracts merchants and advertisers. Advertising improves monetization without requiring Amazon to own the inventory. Cloud infrastructure supports internal systems and external customers. Prime membership increases loyalty across shipping, media and other services.
Those advantages also create regulatory and competitive risks. Sellers depend on Amazon’s marketplace while competing with Amazon’s own retail operations. Regulators continue to examine the power of large digital platforms. Advertising growth can attract scrutiny over data use and marketplace ranking. Retail margins remain exposed to wages, fuel costs, tariffs and shipping disruption.
The Iran conflict makes that exposure more immediate. Higher oil and fuel prices can raise transportation costs throughout Amazon’s network. Tariffs can affect the price and availability of imported goods. Consumers facing higher gasoline and food bills may reduce discretionary spending. Amazon’s scale and logistics efficiency offer protection, but they do not make the retail business immune to macroeconomic pressure.
Amazon’s Strongest Supporting Case
The strongest positive interpretation of Amazon’s results is that the company has reached an inflection point in which AI demand is accelerating the most profitable part of the business faster than capital spending is damaging the strategic case. AWS revenue grew 37%, operating income rose to $16.6 billion, advertising increased 26% and the retail operations remained profitable. Management raised spending because capacity was constrained, not because demand was weak.
Under this interpretation, negative free cash flow is temporary. New data centers and servers begin generating revenue after installation, while the largest construction and equipment payments occur earlier. If AWS growth remains above 30% and operating margins stay near current levels, operating cash flow could eventually catch up with capex. The assets may also serve multiple generations of hardware and customers, improving lifetime returns.
Amazon’s custom chips strengthen this case. Trainium and Inferentia can reduce the cost of selected workloads and give AWS an alternative to relying entirely on third-party accelerators. Customers may choose Amazon’s chips for cost, availability or integration. If the chip businesses continue to scale, Amazon could capture more of the economics within its own infrastructure rather than passing a larger share to suppliers.
The retail and advertising businesses provide additional cash-generation potential. Faster delivery can improve purchase frequency. Advertising monetizes traffic at high incremental margins. Pharmacy, satellite services and logistics offerings provide optionality. None of those projects is guaranteed to become a major profit center, but Amazon has multiple paths to growth rather than a single product cycle.
Amazon’s Strongest Skeptical Case
The skeptical interpretation begins with the possibility that AI infrastructure returns will be lower than current growth suggests. A 37% increase in AWS revenue is impressive, but the company is committing approximately $220 billion of capital spending in one year. The return on that investment depends on years of utilization, pricing and technological relevance. Rapid improvements in model efficiency could reduce the amount of computing required for a given task. Competition among Amazon, Microsoft, Google and specialized providers could pressure prices.
Capacity shortages can also lead to overbuilding. When demand appears greater than supply, every provider has an incentive to add infrastructure. Construction lags are long, so capacity approved during a shortage may come online after the market has balanced. The industry has seen similar cycles in semiconductors, telecommunications and commodities.
Amazon’s negative free cash flow limits the margin for error. The company remains financially strong, but continued outflows would make its valuation more sensitive to interest rates and growth assumptions. Long-term Treasury yields were already elevated after the Fed meeting. Higher discount rates reduce the present value of cash expected far in the future, particularly for companies investing heavily today for later returns.
The Anthropic gain may also distract from the core economics. It lifted GAAP earnings dramatically, but it does not fund the entire capital program unless Amazon realizes the value. Private-company valuations can be volatile and depend on future financing conditions. Investors should not treat the gain as a recurring source of profit.
Finally, Amazon’s third-quarter sales guidance was cautious relative to consensus. Prime Day timing may shift revenue between quarters, and retail costs could rise with oil prices and tariffs. The after-hours rally was justified by AWS, but the rest of the business still faces cyclical and operational risks.
Apple Fiscal Q3 2026 Results: A Record Quarter With a Complicated Forecast
Apple reported revenue of $109.4 billion for its fiscal third quarter ended June 27, 2026, up 16% from a year earlier. Net income rose to approximately $29.8 billion, and diluted earnings per share increased 29% to $2.02. The company described the period as its strongest June quarter, with records for total revenue, earnings per share, iPhone revenue, Mac revenue and Services revenue.
The product mix was strong but uneven. iPhone revenue increased 21.7% to $54.25 billion, slightly above the consensus figure cited by Reuters. Mac revenue rose 28.7% to $10.35 billion, a much larger beat relative to expectations. Services revenue increased 12.1% to $30.74 billion but came in below some forecasts. iPad revenue declined 5.9% to $6.19 billion, and Wearables, Home and Accessories revenue was approximately $7.88 billion.
Geographic performance was broadly positive. Greater China revenue increased 22.4% to $18.82 billion, although it was below the Visible Alpha consensus cited by Reuters. The result indicated that Apple’s business in China was recovering, but the miss also showed that investor expectations had risen. China remains both a major consumer market and a critical part of Apple’s supply chain, making the region central to revenue, manufacturing and geopolitical risk.
Apple reported a company gross margin of 50.1%. That figure included an approximately two-percentage-point benefit from tariff refunds. Diluted EPS included an estimated $0.11 benefit from the refunds. Adjusting for those items does not erase the strength of the quarter, but it changes the comparison. The underlying gross margin was approximately 48.1%, below the reported figure and lower than the prior quarter’s 49.3% margin.
The central disappointment was guidance. Chief Financial Officer Kevan Parekh said Apple expected September-quarter revenue to grow 9% to 11% from a year earlier. Foreign exchange was expected to create a sequential headwind of about 2.5 percentage points to the year-over-year growth rate, and supply constraints were expected to intensify significantly. The constraints affected iPhone, Mac and iPad.
That forecast reframed the quarter. Investors had expected Apple to continue near the June quarter’s pace. Instead, management warned that the company might not be able to produce enough devices or source components economically enough to meet all demand. For a company entering its most important seasonal product period, supply can matter as much as demand.
| Apple fiscal Q3 2026 metric | Reported result | Year-over-year change | Interpretation |
|---|---|---|---|
| Total revenue | $109.4 billion | Up 16% | Record June quarter and above consensus. |
| Diluted EPS | $2.02 | Up 29% | Included an estimated $0.11 benefit from tariff refunds. |
| iPhone revenue | $54.25 billion | Up 21.7% | Demand was strong and exceeded the cited consensus. |
| Mac revenue | $10.35 billion | Up 28.7% | A major upside surprise, helped by new models. |
| Services revenue | $30.74 billion | Up 12.1% | Record revenue, but below some investor expectations. |
| iPad revenue | $6.19 billion | Down 5.9% | A weak spot, partly reflecting a difficult comparison. |
| Reported gross margin | 50.1% | Not directly comparable | Included about two percentage points from tariff refunds. |
Amounts are in U.S. dollars for Apple’s fiscal quarter ended June 27, 2026. Sources: Apple’s earnings release, SEC exhibit and earnings-call guidance.
The iPhone Upgrade Cycle Was Stronger Than the Stock Reaction Suggested
Apple’s after-hours decline should not obscure the strength of iPhone demand in the completed quarter. Revenue of $54.25 billion represented a June-quarter record and growth of nearly 22%. That performance suggests that the iPhone 17 family continued to attract upgrades, including in markets where smartphone replacement cycles had lengthened.
Several forces can drive an upgrade cycle. Consumers may replace older devices because batteries degrade, camera quality improves or operating-system support changes. Carrier promotions can lower the apparent upfront cost. New AI features can create demand, although the actual influence of AI is difficult to separate from ordinary hardware replacement. Pricing also matters. Apple had held iPhone prices steady while raising some Mac and iPad prices, making the phone lineup relatively more attractive than investors had feared.
The result also demonstrated the resilience of Apple’s installed base. Once customers own multiple Apple devices and use services such as iCloud, Apple Pay, the App Store and Apple TV, switching ecosystems becomes more costly. That does not guarantee permanent loyalty, but it supports repeat purchases and gives Apple opportunities to earn revenue after the original device sale.
Yet the quarter’s strength creates a difficult comparison for the future. If a large number of customers upgraded earlier than usual, some demand may have been pulled forward. The September quarter will also include a new product launch, which creates timing uncertainty around availability and revenue recognition. Supply constraints could shift sales from one quarter into another rather than destroy demand, but the market must discount the possibility that higher prices or delayed production reduce total purchases.
The key question is therefore not whether the iPhone business was healthy in fiscal Q3. It was. The question is whether Apple can convert that demand into shipments during the next product cycle while protecting gross margin. Management’s guidance indicated that production capacity, not customer interest, was the immediate bottleneck.
Mac Revenue Surged, but Component Scarcity Threatens the Next Quarter
Mac revenue increased almost 29% to $10.35 billion, well above the cited consensus estimate of $8.74 billion. New products, including the MacBook Neo and refreshed professional models, contributed to the result. The gain was particularly notable because personal-computer demand can be cyclical and had benefited in prior periods from replacement activity tied to operating-system transitions.
Apple’s control over its own silicon architecture has been a major advantage in the Mac business. The company can coordinate processors, operating systems and hardware design, improving performance per watt and differentiating its products from Windows-based competitors. That integration also reduces dependence on commodity processors, but it does not eliminate dependence on semiconductor foundries, memory suppliers and other component manufacturers.
Advanced system-on-chip production remains concentrated among a small number of suppliers, especially Taiwan Semiconductor Manufacturing Company. AI data centers compete indirectly for leading-edge manufacturing capacity, advanced packaging and memory. A shortage in one part of the chain can limit shipments of otherwise completed devices.
Apple described the coming constraints as very significant. Management said the pressure involved advanced logic chips as well as memory. This is a different risk from weak demand. In a demand slowdown, companies can reduce production and promotional spending. In a supply shortage, they may have to allocate scarce components among products, pay more for inputs, seek alternative suppliers or delay shipments.
Apple’s size gives it purchasing power, long-term supplier relationships and the ability to commit large volumes. Those advantages historically helped the company secure components during shortages. Yet the current AI-led investment wave is unusually large, and cloud providers are competing for many of the same inputs. Apple can manage scarcity better than many smaller hardware companies without escaping it entirely.
Services Reached a Record but Did Not Remove Regulatory and Growth Questions
Services revenue rose 12.1% to $30.74 billion, setting another record. The segment includes the App Store, advertising, cloud services, payments, digital content and other offerings. Services are important because they generate recurring revenue, deepen the value of the installed base and generally carry higher gross margins than hardware.
For years, the growth of Services helped investors view Apple as more than a cyclical device maker. A customer who buys an iPhone can generate revenue through app purchases, subscriptions, storage and payment activity for years. The business also smooths some of the seasonality associated with hardware launches.
The latest result was strong in absolute terms but below some expectations. That matters because Apple’s valuation incorporates continued expansion in high-margin recurring revenue. A modest deceleration can have an outsized effect on the market’s long-term model, especially when hardware margins face component pressure.
Regulation is another constraint. Courts and regulators in multiple jurisdictions have challenged app-store rules, payment practices and platform fees. Changes can reduce Apple’s ability to require developers to use its payment system or can increase competition from alternative marketplaces. The exact financial impact depends on customer behavior and the remedies adopted in each jurisdiction, but the direction of policy has generally been toward greater openness.
Apple can offset some pressure through new services, advertising, payments, sports rights and higher engagement. It can also improve monetization as the installed base grows. The risk is that new revenue streams may not carry the same margins or defensibility as the historical App Store model. Investors should therefore distinguish between Services revenue growth and the quality of that growth.
Tariff Refunds Improved Apple’s Reported Margin and EPS
Apple’s earnings release explicitly stated that tariff refunds added approximately two percentage points to company gross margin and $0.11 to diluted earnings per share. This is a useful example of why investors should not evaluate a quarter only from the reported headline.
A refund can be economically valuable. It returns cash or reduces costs that the company had previously incurred. It may also reflect a favorable legal or administrative outcome. But it is not necessarily repeatable. If the benefit does not recur in the September quarter, the year-over-year comparison becomes more difficult even if underlying operations remain healthy.
Subtracting the reported benefit implies an underlying company gross margin near 48.1%. That remains a high margin for a business selling hundreds of millions of physical devices, but it is below the headline 50.1%. Similarly, EPS excluding the estimated refund benefit would have been approximately $1.91 rather than $2.02, all else equal. This simple adjustment is not a full non-GAAP reconciliation, but it helps isolate the unusual item.
The distinction also explains why the market focused on guidance. A one-time benefit improved the completed quarter while supply and foreign-exchange headwinds threatened the next one. Investors therefore faced a transition from a quarter with favorable refunds to a quarter with potentially higher component costs and constrained production.
Apple’s management can respond through product pricing, supplier negotiations, design changes and mix. Higher-priced Pro devices can support margins, while lower-cost models can expand volume. Price increases preserve unit economics but risk weakening demand. Supplier diversification improves resilience but takes time because components must meet strict performance and quality standards.
Fact Box
What Apple Guided for the September Quarter
- Total company revenue growth: 9% to 11% year over year
- Foreign-exchange impact: about a 2.5-percentage-point sequential headwind to the year-over-year growth rate
- Supply constraints: expected to intensify significantly
- Affected products: iPhone, Mac and iPad
- Main market concern: Apple may be unable to satisfy all demand during a major launch quarter
Original sources: Apple’s fiscal third-quarter release and a transcript of Apple’s earnings call
Why Apple Fell Even Though Revenue and Earnings Beat Expectations
An earnings beat is not a fixed standard of quality. It is the difference between actual results and a forecast made before the release. Once the numbers are published, investors update their expectations for all future periods. A stock can fall after a beat if the new forecast is lower than the old one.
Apple’s share price had already reflected optimism about the upgrade cycle, product demand and management’s ability to navigate costs. The fiscal third-quarter results validated much of that optimism. The guidance then introduced new information: growth would slow, supply constraints would worsen and foreign exchange would become less favorable.
The market also had to adjust the quality of the completed quarter. Tariff refunds boosted margin and EPS. Services growth was below some expectations. iPad revenue declined. Greater China improved sharply but missed the cited consensus. None of those items made the quarter poor, but together they reduced the amount of upside investors could carry into the next forecast.
Apple’s after-hours move also occurred in the context of a strong regular session for technology stocks. When a sector rallies sharply before a company reports, expectations can become more demanding. Investors who bought the stock in anticipation of a strong result may sell when the report merely confirms the thesis rather than improving it.
After-hours liquidity is thinner than regular trading, so percentage moves can change by the next market open. The initial decline should be treated as a real signal but not a final verdict. Analysts would continue to revise models overnight, and management’s explanations about supply versus demand could influence Friday trading.
Tim Cook’s Final Earnings Call Added a Succession Premium—and Succession Risk
The July earnings call was Tim Cook’s last as Apple chief executive. Apple announced in April that Cook would become executive chairman and that John Ternus, then senior vice president of Hardware Engineering, would become CEO effective September 1, 2026. The transition had been planned and unanimously approved by the board, reducing the surprise that often accompanies an executive departure.
Cook’s record reshaped Apple. He became CEO in 2011 after serving as the company’s operations chief. Under his leadership, Apple expanded the iPhone franchise, built a services business generating more than $100 billion in annual revenue, launched new product categories, increased capital returns and developed one of the most sophisticated global supply chains in corporate history.
That operational expertise is especially relevant to the current moment. Cook’s final quarter as CEO featured exactly the kind of problem he was known for managing: severe component constraints across multiple products. His move to executive chairman provides continuity, but it also creates questions about the division of authority between the board and the new CEO.
Ternus brings deep hardware experience. He has overseen product engineering and participated in Apple’s transition to custom silicon. That background fits a company facing competition in AI devices and pressure on component sourcing. Yet the CEO role extends beyond product design. It requires capital allocation, regulatory strategy, developer relations, geopolitical diplomacy, services growth and management of a supply chain spanning numerous countries.
The market may eventually award Apple a succession premium if Ternus accelerates product innovation while Cook provides continuity. It may apply a discount if strategic responsibilities become unclear or if the company’s AI response disappoints. The first months of the transition will be evaluated through product launches, supplier decisions, organizational changes and communication with investors.
Succession does not explain the immediate after-hours decline as directly as guidance, but it raises the stakes. Apple is entering a new leadership era while facing its most significant technological transition since mobile computing became dominant. The supply warning made that transition feel less theoretical.
Apple’s AI Strategy Is a Device-and-Ecosystem Strategy, Not a Hyperscaler Strategy
Comparing Apple’s AI spending with Amazon’s or Microsoft’s can be misleading because the companies occupy different layers of the technology stack. Amazon and Microsoft sell computing capacity and software services to external customers. Apple sells devices and operates an ecosystem of software and services. Its objective is not necessarily to build the largest public cloud. It is to make AI features useful enough to support device demand, customer retention and services engagement.
Apple has emphasized a hybrid model combining on-device processing with Private Cloud Compute for more demanding tasks. On-device models can improve privacy, reduce latency and limit cloud costs. They also face hardware constraints involving memory, battery life and processing power. Cloud models can be larger and more capable but require data-center investment and raise privacy questions.
The company’s all-new Siri AI is intended to demonstrate the value of that integration. The commercial question is whether the features are compelling enough to accelerate upgrades or protect Apple’s premium pricing. Investors will also watch whether developers adopt Apple’s AI frameworks and whether the company can maintain a differentiated privacy position while matching the usefulness of competing assistants.
Apple’s AI model may be less capital-intensive than running a public cloud for millions of enterprise workloads, but it is not costless. The company must invest in research, custom silicon, servers, networking and developer tools. It may also pay partners for models or data. Higher memory prices affect both devices and cloud infrastructure.
The strongest case for Apple is that control over hardware, operating systems and distribution allows it to deliver AI directly to a large installed base. The skeptical case is that platform control matters only if the underlying models and experiences are competitive. A familiar device does not guarantee that users will prefer its AI features.
Apple’s Strongest Supporting Case
The positive case begins with current demand. Revenue grew 16% on a base of more than $94 billion in the prior-year quarter. iPhone and Mac revenue expanded sharply. Services set a record. Greater China returned to strong growth. The installed base reached a new high across major product categories and geographic segments, according to the company.
Supply constraints can be less damaging than demand weakness because delayed purchases may be recovered later. If Apple’s primary problem is obtaining components rather than attracting buyers, revenue could shift into later quarters. The company has historically managed shortages through supplier relationships, product allocation and design expertise.
Apple’s balance sheet and cash generation provide flexibility. It can prepay suppliers, sign long-term agreements, invest in domestic manufacturing, acquire technology and continue returning capital to shareholders. Its brand supports premium pricing, and its services ecosystem creates recurring revenue after the hardware sale.
The leadership transition may also be constructive. Ternus has direct experience with hardware engineering and custom silicon, areas central to AI devices. Cook’s executive-chairman role can preserve relationships and institutional knowledge while allowing a new CEO to focus on the next product cycle.
Apple’s Strongest Skeptical Case
The skeptical case is that Apple’s current strength masks a difficult combination of slowing future growth, higher input costs and regulatory pressure on Services. The September-quarter forecast implies a material deceleration from 16% growth. If shortages persist into the holiday season, delayed sales could become lost sales as consumers choose competing products or postpone upgrades.
Apple’s reported gross margin benefited from tariff refunds. Excluding that benefit, underlying profitability was less exceptional. Memory and advanced logic-chip costs may rise further. Passing those costs to consumers through higher prices could weaken demand, especially when inflation remains above target and household saving rates are low.
Services growth is still healthy but may be harder to sustain at premium margins if app-store rules change. Regulators can force greater payment choice, lower fees or alternative distribution. Apple can develop new services, but replacing a highly profitable platform toll with equally attractive revenue is not assured.
The AI transition adds strategic uncertainty. Competitors are investing hundreds of billions of dollars and releasing products rapidly. Apple’s integrated approach may produce a superior consumer experience, but delays or weaker model performance could make the company appear behind. Leadership succession increases execution risk at precisely that moment.
Microsoft’s 15.5% Rally Set the Standard for the Entire Earnings Night
Amazon and Apple reported after the close, but Microsoft had already established the market’s benchmark during regular trading. Its fiscal fourth-quarter revenue increased 18% to $90.0 billion, operating income rose 18% to $40.6 billion and Azure revenue grew 43%. Microsoft Cloud revenue reached $59.3 billion, up 27%, while commercial remaining performance obligations increased 84% to $678 billion.
The numbers mattered because Microsoft showed both growth and financial discipline. Its cloud business was expanding rapidly, and management did not announce an unexpected increase in capital spending comparable to Amazon’s later $20 billion revision. Investors were particularly sensitive to that issue after other large technology companies reported weaker free cash flow or higher spending floors.
Microsoft also demonstrated the value of a diversified enterprise software model. Azure growth attracts the headlines, but Microsoft 365, LinkedIn, Dynamics and other services provide recurring revenue. The company can distribute AI features through products that customers already use, then charge for higher-value functionality. That creates a direct monetization path that is different from simply selling raw computing capacity.
The quarter was not free of complexity. Microsoft’s GAAP net income included effects from its investments in OpenAI and a separate gain from Anthropic, while its non-GAAP figures adjusted for OpenAI-related impacts. More Personal Computing revenue declined 4%, Xbox content and services revenue fell 10%, and Windows OEM and Devices revenue dropped 7%. The market nevertheless focused on the cloud and AI businesses because they were growing faster and carrying greater strategic importance.
Microsoft’s 15.5% share-price gain—its best day since 2008—added hundreds of billions of dollars in market value. A move of that size can influence index performance, sector sentiment and the interpretation of other companies’ results. Amazon’s AWS acceleration looked more credible because Microsoft had already shown that enterprise AI spending was strong. Apple’s supply warning looked more concerning because investors had just rewarded a company that translated AI demand into cloud revenue.
The comparison also reveals that “AI exposure” is not one trade. Microsoft sells software, cloud capacity and developer tools. Amazon sells infrastructure, marketplace services and advertising. Apple sells integrated devices and services. The market may reward all three at different times, but it uses different evidence for each business model.
How Amazon, Microsoft and Apple Monetize the AI Cycle Differently
Amazon’s primary AI monetization route is usage. Customers pay AWS for computing, storage, databases, model access and related services. Revenue rises when customers train models, run inference, store more data or adopt additional cloud products. Capital intensity is high because Amazon must build capacity before usage occurs.
Microsoft combines usage and subscription models. Azure resembles AWS, but Microsoft can also sell Copilot features through Microsoft 365, GitHub, Dynamics and other applications. The company reported more than 30 million paid Microsoft 365 Copilot seats. Subscription distribution can improve revenue visibility and allows Microsoft to monetize AI even when customers do not manage infrastructure directly.
Apple’s route is more indirect. AI can encourage device upgrades, support premium pricing, increase ecosystem loyalty and create demand for services. Apple may not report a separate line item called AI revenue. The financial impact appears through iPhone, Mac, iPad and Services growth. That makes the return harder to isolate.
These models have different risk profiles. Cloud providers face utilization and pricing risk. They can build too much capacity or see customers optimize workloads. Software providers face adoption risk: customers may resist higher subscription prices or fail to find enough productivity benefit. Device companies face product-cycle risk and component constraints. Features must be compelling enough to influence hardware purchases.
The models also interact. Apple may use external cloud providers or model partners for some tasks. Developers building applications for Apple devices may host services on AWS or Azure. Amazon and Microsoft buy chips and memory from many of the same suppliers that serve Apple. A shortage caused by one part of the AI ecosystem can affect another.
For investors, the practical lesson is to avoid treating all AI spending as equivalent. The key questions are who pays, how often they pay, what assets must be built, how long those assets remain useful and how much profit remains after depreciation and operating expenses.
The Economic Backdrop: Slower GDP, Strong Consumers and Persistent Inflation
The technology rally occurred on the same day the Bureau of Economic Analysis reported that real U.S. gross domestic product increased at a 1.5% annualized rate in the second quarter of 2026. That was slower than the 2.1% rate in the first quarter. Imports weighed on the headline, while consumer spending, investment and exports contributed to growth.
Consumer spending increased at a 3.2% annualized rate, according to the advance estimate and contemporaneous reporting. That is important for Apple and Amazon because both depend on household demand, although in different ways. Apple sells premium devices that can be postponed when budgets are tight. Amazon serves a broad mix of essential and discretionary categories, giving it greater resilience but also exposure to overall consumption.
Business investment remained strong, particularly in technology and AI infrastructure. This is the bridge between macroeconomic data and cloud earnings. Data-center construction, servers, networking equipment and software investment contribute to business spending. The same activity that boosts Amazon and Microsoft can support GDP even when other sectors slow.
Headline GDP can be distorted by trade flows. Imports are subtracted in the national accounts because GDP measures domestic production, not because imports are economically harmful. A surge in imports can reduce the reported growth rate even when domestic demand remains firm. Analysts therefore examine measures such as final sales to private domestic purchasers to judge underlying activity.
The second-quarter report presented a mixed economy rather than an obvious recession. Growth slowed, but consumers and businesses continued to spend. Inflation remained too high for the Federal Reserve’s comfort. Energy disruption threatened to worsen the picture. That combination—moderate growth with persistent inflation—is difficult for monetary policy because raising rates can slow demand while doing little to resolve supply shocks.
For technology valuations, the macro mix cuts both ways. Strong business investment supports cloud demand. Slower overall growth can reduce advertising, device and retail spending. Persistent inflation keeps bond yields elevated, increasing the discount rate applied to future profits. Companies must therefore produce more convincing earnings growth to justify the same valuation.
June PCE Inflation Cooled to 3.7%, but the Improvement May Be Temporary
The personal consumption expenditures price index was 3.7% higher in June than a year earlier, down from 4.1% in May. Core PCE inflation, which excludes food and energy, was 3.3% year over year. On a monthly basis, the headline index declined 0.1%, while core prices rose 0.1%.
The slowdown was welcome, but inflation remained well above the Federal Reserve’s 2% objective. The improvement also reflected lower energy prices during a temporary pause in the U.S.-Iran conflict. Oil prices rose again as hostilities resumed and shipping through the Strait of Hormuz remained constrained. That means July inflation could reverse part of June’s progress.
Energy affects corporate results directly and indirectly. Amazon pays for transportation across a vast logistics network. Apple’s suppliers use energy to manufacture and ship components. Airlines and cruise operators face higher fuel bills. Consumers have less money available for discretionary purchases when gasoline and utility costs rise.
Inflation also affects wages, rents and construction costs. Data-center projects require skilled labor, electrical equipment, cooling systems and large amounts of power. Amazon’s $220 billion capital plan is therefore exposed not only to the number of servers purchased but also to the cost of building and operating the infrastructure.
Higher inflation can help companies with strong pricing power, but it also increases interest rates and economic uncertainty. Apple can raise prices on premium devices, yet consumers may extend replacement cycles. Amazon can adjust marketplace fees or advertising prices, but merchants and shoppers may resist. Cloud providers can raise prices or sell higher-value services, but customers can optimize workloads.
The June PCE report therefore did not remove the inflation risk from the earnings story. It showed temporary relief in the headline number while the underlying rate remained elevated. The market rally suggested that investors were willing to focus on company-specific growth, but bond yields indicated that the macroeconomic problem was unresolved.
The Federal Reserve Held Rates at 3.50% to 3.75%
On July 29, the Federal Open Market Committee maintained the federal-funds target range at 3.50% to 3.75%. Three members dissented in favor of a quarter-point increase. The disagreement reflected concern that inflation had remained above target for an extended period and that energy shocks could create renewed pressure.
Chair Kevin Warsh’s press conference did not provide the clear forward guidance some investors wanted. He emphasized the Fed’s commitment to price stability but left the next decision dependent on incoming data. The bond market responded by pushing long-term yields higher, with the 30-year Treasury yield reaching levels not seen since 2007.
Long-term yields matter to technology stocks for two reasons. First, they affect the discount rate used in valuation. A dollar of profit expected years from now is worth less today when risk-free yields are higher. Second, yields influence borrowing costs for companies, consumers and governments. Even cash-rich technology companies operate in an ecosystem where customers and suppliers depend on financing.
Amazon is particularly sensitive to the valuation effect because it is sacrificing current free cash flow for future infrastructure returns. Apple is sensitive through consumer financing and the present value of its installed-base cash flows. Microsoft’s strong current profitability reduces, but does not eliminate, the effect.
The market’s reaction on July 30 showed that earnings can overpower rate concerns for a day. Microsoft’s results were strong enough to lift the major indexes despite elevated yields. That does not mean the yield risk disappeared. If inflation accelerates and the Fed raises rates, the hurdle rate for AI investments will rise. Companies will need greater cash returns to justify the same capital spending.
Oil, Iran and the Strait of Hormuz Remained a Direct Business Risk
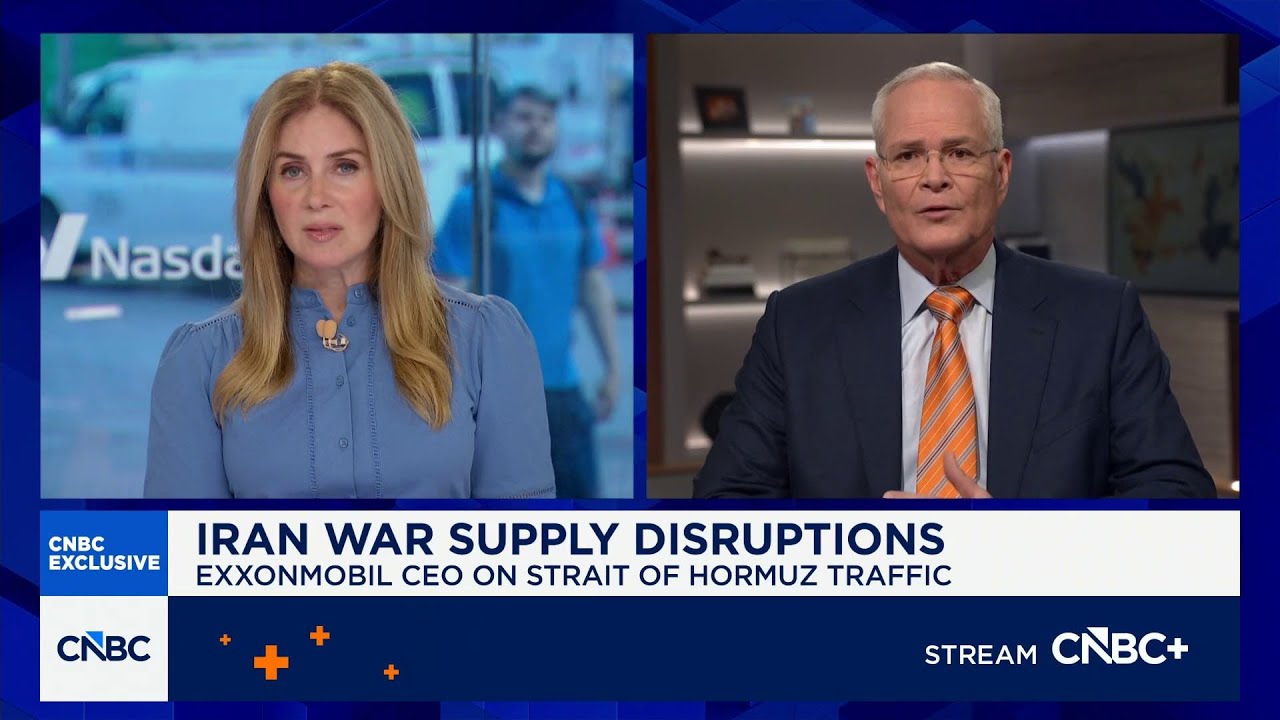
West Texas Intermediate crude settled at $83.59 a barrel on July 30, down 1.03% for the session but still elevated by the U.S.-Iran conflict and constrained shipping through the Strait of Hormuz. Brent crude settled at $89.03 after trading above $93 during the day.
The Strait of Hormuz is the world’s most important oil transit chokepoint. The U.S. Energy Information Administration estimated that flows through the strait averaged 20.9 million barrels per day in the first half of 2025, equivalent to about 20% of global petroleum-liquids consumption. Qatar also ships large volumes of liquefied natural gas through the route.
A complete and sustained closure would affect far more than oil producers. Shipping costs would rise. Insurers would charge more for vessels entering conflict zones. Airlines and cruise companies would face higher fuel bills. Manufacturers would pay more for petrochemical inputs and transportation. Consumers would encounter higher gasoline and goods prices.
The market’s ability to rally despite the conflict reflected confidence that company earnings could offset some macro pressure. It also reflected the fact that oil had pulled back from intraday highs. Yet the risk remained asymmetric. A diplomatic improvement could lower prices gradually, while a major disruption could produce a rapid spike.
Amazon’s logistics network is directly exposed to fuel costs. Apple’s global supply chain is exposed to freight rates and component shipments. Both companies can hedge some costs and negotiate with suppliers, but neither can fully insulate itself from a sustained energy shock.
For the Federal Reserve, higher oil prices complicate the distinction between headline and core inflation. Energy shocks can initially appear temporary, but they can spread into transportation, wages and expectations. That is one reason long-term yields remained elevated even after June PCE inflation cooled.
Market Breadth Improved, but the Rally Was Still Concentrated
The July 30 rebound included gains across many semiconductor and technology shares, yet the largest companies still exerted exceptional influence. Microsoft alone added hundreds of billions of dollars in market value. Because the S&P 500 and Nasdaq are weighted by market capitalization, a handful of mega-cap moves can dominate index returns.
Market breadth measures how many stocks are advancing relative to declining, how many reach new highs and whether smaller companies participate. Broader participation generally suggests that investors have confidence in the economy and corporate earnings beyond a few leaders. Narrow rallies can continue for long periods, but they create vulnerability if the leaders disappoint.
Thursday’s trading offered a partial broadening. Chipmakers rebounded, the Russell 2000 gained 1.4%, and the major indexes recovered from the prior day’s decline. At the same time, the market’s narrative remained heavily dependent on Microsoft and the AI complex.
Amazon’s after-hours rise could broaden leadership further if it holds during regular trading. Apple’s decline could offset part of that effect because Apple is also a major index weight. The net result for Friday would depend on the final premarket moves and on earnings from companies including Exxon Mobil, Chevron, Moderna and AbbVie.
Investors should therefore separate index performance from the experience of the average stock. A 2.78% Nasdaq gain is economically meaningful, but it does not imply that every technology company improved by a similar amount. The market was rewarding specific evidence of AI monetization, not indiscriminately lifting all growth companies.
Why Semiconductor Stocks Rebounded So Sharply
Semiconductor shares had suffered a sharp selloff before rebounding on July 30. Microsoft’s cloud results changed the immediate demand outlook. If Azure and AWS are growing rapidly and both companies remain capacity constrained, they are likely to continue purchasing processors, memory, networking chips and related equipment.
Micron’s approximately 18% gain reflected the importance of memory in AI systems. Large models require high-bandwidth memory and substantial conventional DRAM and storage. Supply has struggled to keep pace, raising prices and improving the revenue outlook for memory producers. The same shortage increases costs for Apple and contributes to Amazon’s higher capex estimate.
This is a classic supply-chain redistribution. A shortage can benefit the producer of a scarce component while hurting the buyer. Micron may gain pricing power. Amazon can pass some costs through cloud pricing or absorb them in return for long-term growth. Apple may have less flexibility if consumers resist higher device prices.
The semiconductor rally also reflected relief after a “gut check” in the sector. High valuations had made chip stocks sensitive to any sign that AI demand was slowing. Microsoft’s results offered evidence that end demand remained strong. Amazon reinforced that evidence after the close.
The risk is that the market extrapolates current shortages too far. Memory is cyclical. Producers can add capacity, customers can redesign systems and demand can normalize. Investors should distinguish between durable structural growth in AI computing and temporary pricing power created by tight supply.
A Practical Framework for Reading Big Tech Earnings
The July 30 reports provide a useful framework for evaluating future technology earnings. The first question is whether revenue growth is accelerating or decelerating in the strategically important business. AWS accelerated to 37%. Azure grew 43%. Apple’s iPhone and Mac grew strongly, but total-company guidance pointed to slower growth.
The second question is whether the growth produces operating profit. AWS operating income rose to $16.6 billion. Microsoft operating income reached $40.6 billion. Apple generated nearly $30 billion in net income, although tariff refunds improved the quarter. Growth without profit can still be valuable, but it requires stronger evidence about future economics.
The third question is cash conversion. Amazon’s free cash flow turned negative because capex rose. Microsoft continued to generate substantial cash while investing. Apple’s model remains less capital-intensive than the hyperscalers, but component costs and supply constraints can pressure margin and working capital.
The fourth question is the quality of earnings. Investment gains, tariff refunds, restructuring charges and stock-based compensation can all affect reported results. Investors should identify which items are recurring, which are non-cash and which reflect the underlying business.
The fifth question is guidance. The market often reacts more strongly to the forecast than the completed quarter. Amazon’s cautious sales guidance was outweighed by AWS acceleration. Apple’s strong quarter was outweighed by supply and foreign-exchange warnings.
The sixth question is strategic credibility. Does management explain how spending creates revenue and returns? Amazon linked capex to constrained capacity and customer demand. Microsoft linked AI investment to cloud growth and paid Copilot seats. Apple linked its AI strategy to devices and privacy, but investors still need evidence that the features will strengthen the product cycle.
What Could Change the Amazon Interpretation
The Amazon thesis would strengthen if AWS maintains growth above 30%, operating margins remain robust and free cash flow recovers as new capacity begins producing revenue. Continued growth in advertising and retail operating income would reduce dependence on cloud.
Evidence of lower capex intensity would also help. Amazon does not need to reduce total spending immediately, but investors will look for a point at which operating cash flow grows faster than capital expenditures. A return to positive trailing free cash flow would make the investment case less dependent on distant assumptions.
The interpretation would weaken if AWS growth slows while capex remains near $220 billion. Falling cloud prices, weaker utilization or customer optimization could reduce returns. A deterioration in AWS margin would be particularly important because the segment funds much of the company’s profit.
Retail risks could also become more material. Sustained oil prices above current levels, tariffs and weaker consumer spending would raise costs and reduce demand. The third-quarter sales outlook already suggests that the next period may not match the second quarter’s headline growth.
Finally, changes in Anthropic’s valuation could create large swings in GAAP net income. Investors should avoid confusing those accounting movements with the operating trajectory of AWS and retail.
What Could Change the Apple Interpretation
Apple’s outlook would improve if supply constraints ease faster than management expects. Component availability could allow delayed orders to be fulfilled later in the September quarter or shift revenue into the December quarter. Strong demand for new iPhones would confirm that the issue is supply rather than consumer fatigue.
A successful Siri AI launch could also support the upgrade cycle. The most persuasive evidence would be higher device demand, greater engagement and developer adoption rather than promotional claims. Apple does not need to match every cloud-provider metric; it needs AI to strengthen the economics of its ecosystem.
Services acceleration would reduce concern about hardware cycles. Investors will watch App Store economics, advertising, payments, cloud services and subscriptions. Regulatory decisions remain a key variable.
The outlook would weaken if shortages persist, margins fall and price increases reduce demand. A decline in China would be especially important because the region is both a major market and a manufacturing center. Leadership missteps during the transition from Cook to Ternus would add uncertainty.
The market will also evaluate whether tariff-refund benefits were a one-time peak. If reported margins normalize lower while component costs rise, analysts may reduce earnings estimates even if revenue remains healthy.
What Investors and Business Readers Should Watch on Friday
The first test is whether the after-hours moves persist into regular trading. Thin liquidity can exaggerate overnight reactions. Analyst calls, revised estimates and new information can narrow or widen the moves before the opening bell.
Amazon’s share price will reveal whether investors remain comfortable with the $220 billion capital plan after fully considering the free-cash-flow impact. Apple’s price will show whether management’s supply explanation is enough to offset weaker guidance. Microsoft’s ability to hold its 15.5% gain will indicate whether the market views the rally as a durable revaluation or a short squeeze after a difficult month.
Energy earnings will add information about the Iran conflict and oil-market outlook. Exxon Mobil and Chevron can provide insight into production, refining margins and capital allocation. Higher oil-company profits can coexist with higher costs for the rest of the economy.
Consumer sentiment will help assess whether households remain willing to spend despite inflation. Travel and leisure companies have already warned about high fuel costs and cautious consumers. Apple and Amazon are larger and more diversified, but the same pressure reaches their customers.
Friday will also be the first trading day of August. Portfolio rebalancing, options positioning and month-end flows can amplify company-specific moves. Investors should avoid attributing every price change to a single earnings detail.
Scenario Analysis: Three Plausible Paths From Here
Scenario One: AI Demand Remains Strong and Cash Flow Catches Up
In the most constructive scenario, enterprise AI adoption continues to expand, AWS and Azure maintain rapid growth and new data-center capacity achieves high utilization. Amazon’s free cash flow improves as revenue from installed infrastructure rises. Microsoft continues to monetize Copilot and cloud usage. Apple’s new AI features support device upgrades, and component supply normalizes.
Under this path, the July 30 rally would look like an early recognition of a durable earnings cycle. Semiconductor demand would remain strong, memory pricing would stay favorable for producers and technology capital spending would support business investment. Inflation could still create volatility, but corporate growth would offset part of the valuation pressure from higher yields.
Scenario Two: Growth Continues, but Returns Become More Competitive
A middle scenario is that AI demand grows while pricing and margins weaken. Hyperscalers add large amounts of capacity, customers optimize workloads and competition increases. Revenue remains strong, but free cash flow recovers more slowly than investors expect.
Amazon and Microsoft would still benefit from scale, yet the market might assign lower valuation multiples if returns on capital decline. Semiconductor companies could experience a transition from shortage pricing to volume growth. Apple could benefit from lower component costs even if cloud providers face weaker margins.
This outcome would not imply an AI collapse. It would resemble many technology cycles in which adoption expands rapidly while economics shift from scarcity to competition.
Scenario Three: Energy, Inflation and Rates Interrupt the Technology Cycle
The adverse scenario combines a prolonged Strait of Hormuz disruption with higher oil prices, renewed inflation and Fed rate increases. Consumers reduce discretionary spending, construction costs rise and bond yields move higher. Cloud customers delay projects, retailers face shipping pressure and device buyers extend replacement cycles.
Amazon would face weaker retail demand and a higher hurdle for its capital program. Apple would face both supply and affordability pressure. Microsoft’s recurring enterprise revenue would offer protection, but new cloud commitments could slow. Technology valuations would contract as investors discount future cash flows at higher rates.
This scenario is not inevitable, but it explains why the market’s strong rally did not eliminate risk. Company execution can offset macro pressure for a period; it cannot permanently ignore energy supply and monetary policy.
Frequently Asked Questions
Why did Amazon stock rise after its Q2 2026 earnings?
Amazon shares rose roughly 9% in late after-hours trading primarily because AWS revenue increased 37% to $42.2 billion, its fastest growth in 18 quarters. AWS operating income rose to $16.6 billion, showing that the acceleration was profitable. Investors accepted Amazon’s higher capital-spending plan because management linked it to strong demand and insufficient capacity. The move was not based solely on headline net income, which included a large non-operating gain related mainly to Anthropic.
Why did Apple stock fall after beating earnings expectations?
Apple’s reported quarter was strong, but its forward guidance disappointed. Management expected September-quarter revenue growth of 9% to 11%, below the pace many analysts had modeled. Apple also warned that supply constraints affecting iPhone, Mac and iPad would intensify and that foreign exchange would become a larger headwind. Markets generally place more weight on new information about future performance than on a quarter that has already ended.
How much revenue did Amazon report in the second quarter of 2026?
Amazon reported $200.6 billion in net sales for the quarter ended June 30, 2026, up 20% from $167.7 billion a year earlier. North America contributed $116.2 billion, International contributed $42.2 billion and AWS contributed $42.2 billion. The segment figures include different types of revenue and should not be interpreted as having similar margins.
How much revenue did Apple report in fiscal Q3 2026?
Apple reported $109.4 billion in revenue for the fiscal quarter ended June 27, 2026, up 16% year over year. iPhone revenue was $54.25 billion, Mac revenue was $10.35 billion, Services revenue was $30.74 billion, iPad revenue was $6.19 billion and Wearables, Home and Accessories revenue was approximately $7.88 billion.
Was Amazon’s $62.6 billion net income generated by its core business?
Only part of it. Amazon generated $27.5 billion in operating income from its businesses. The company’s $62.6 billion of GAAP net income also included $53.4 billion of non-operating pre-tax other income, primarily related to its Anthropic investment. The gain is valid under accounting rules, but it is not equivalent to recurring cloud, retail or advertising profit and did not necessarily produce the same amount of cash.
What does Amazon’s negative free cash flow mean?
Amazon’s trailing-12-month free cash flow was an outflow of $7.6 billion because capital expenditures rose faster than operating cash flow. Negative free cash flow means the company spent more on capital assets than it generated after operating activities under its stated calculation. It does not mean Amazon lacked liquidity or reported an operating loss. It does mean the return on its investment program will depend on future revenue, margins and asset utilization.
How much will Amazon spend on capital expenditures in 2026?
Management raised its expected 2026 capital expenditures to approximately $220 billion from an earlier estimate of about $200 billion. The spending is concentrated in AWS and AI infrastructure but also includes logistics, robotics, chips, satellites and other assets. Higher memory costs contributed to the increase.
What was Apple’s underlying gross margin without tariff refunds?
Apple reported a 50.1% company gross margin and said tariff refunds contributed approximately two percentage points. A simple adjustment therefore implies an underlying margin near 48.1%. This is an analytical estimate based on the company’s disclosure, not a separately reported non-GAAP measure. Apple also said the refunds added approximately $0.11 to diluted earnings per share.
Who will replace Tim Cook as Apple CEO?
John Ternus, Apple’s senior vice president of Hardware Engineering, is scheduled to become chief executive on September 1, 2026. Tim Cook will become executive chairman of Apple’s board. Apple announced the transition on April 20, 2026, and said the board approved it unanimously.
What did Microsoft report that caused its stock to rise so sharply?
Microsoft reported fiscal fourth-quarter revenue of $90.0 billion, up 18%, and operating income of $40.6 billion, also up 18%. Azure and other cloud-services revenue increased 43%, Microsoft Cloud revenue rose 27% to $59.3 billion, and commercial remaining performance obligations increased 84% to $678 billion. The combination of rapid growth, backlog and strong profitability reassured investors about AI spending.
What was the U.S. inflation rate in June 2026?
The PCE price index was 3.7% higher than a year earlier in June, down from 4.1% in May. Core PCE inflation, excluding food and energy, was 3.3% year over year. The headline index declined 0.1% from May, but renewed oil-price pressure created a risk that inflation would rise again in subsequent data.
What did the Federal Reserve decide in July 2026?
The Federal Open Market Committee kept the federal-funds target range at 3.50% to 3.75% on July 29. Three policymakers dissented in favor of a quarter-point increase. The decision left future policy dependent on inflation, employment and other incoming data rather than providing a firm commitment about September.
Final Assessment
The July 30 market rebound was not simply a return to risk-taking after a bad day. It was a demanding comparison of business models at the center of the AI investment cycle. Microsoft showed that rapid cloud growth, expanding contractual commitments and strong operating profit could justify infrastructure spending. Amazon showed that investors would tolerate negative free cash flow and an even larger capital plan when AWS accelerated and remained highly profitable. Apple showed that a record quarter could still disappoint when supply constraints, foreign exchange and one-time margin benefits changed the next forecast.
The most important verified evidence from Amazon was not its $62.6 billion of net income. It was AWS revenue growth of 37%, AWS operating income of $16.6 billion and consolidated operating income of $27.5 billion. Those figures supported management’s claim that demand was exceeding capacity. The strongest concern was the scale of the response: approximately $220 billion of expected capital spending and negative trailing free cash flow. Amazon must prove that the infrastructure earns attractive returns after depreciation, competition and technological change.
The most important verified evidence from Apple was the strength of current demand. Revenue rose 16%, iPhone sales increased nearly 22% and Mac sales rose almost 29%. The strongest concern was not that consumers had abandoned Apple. It was that the company expected significant supply constraints during a major product quarter, while foreign exchange and component costs threatened the earnings trajectory. Tariff refunds also made the reported margin and EPS stronger than the underlying operations alone.
The broader market remains caught between company-specific growth and macroeconomic restraint. Real GDP slowed to a 1.5% annualized rate, PCE inflation remained at 3.7%, the Fed held rates steady with three dissents, and oil prices stayed elevated because of the Iran conflict and the Strait of Hormuz disruption. Long-term Treasury yields signaled that investors had not become comfortable with inflation simply because technology earnings were strong.
For Amazon, the next decisive evidence will be free-cash-flow conversion and sustained AWS growth. For Apple, it will be component availability, September-quarter shipments and the first product cycle under John Ternus’s leadership. For Microsoft, it will be whether Azure growth and paid AI adoption continue after the market’s dramatic revaluation.
The strongest conclusion is therefore conditional. The AI spending cycle is producing real revenue and operating profit at extraordinary scale, but the cost of participation is rising just as inflation and interest rates remain restrictive. Amazon earned the benefit of the doubt for one quarter. Apple lost some of that benefit despite excellent reported results. Neither market reaction is permanent. The next set of filings will determine whether Thursday’s split was the beginning of a durable divergence or merely the latest adjustment in a volatile earnings season.
This article is provided for general informational purposes and does not constitute financial, investment, tax, or legal advice.
Sources
- Amazon.com Announces Second Quarter Results
- Amazon Q2 2026 earnings exhibit filed with the SEC
- Reuters: Amazon lifts investment plans after strong cloud sales
- Associated Press: Amazon raises AI and technology spending plan
- Apple reports fiscal 2026 third-quarter results
- Apple fiscal Q3 2026 earnings exhibit filed with the SEC
- Apple’s official Tim Cook and John Ternus succession announcement
- Reuters: Apple forecast pressured by supply constraints
- Transcript of Apple’s fiscal Q3 2026 earnings call
- Microsoft fiscal 2026 fourth-quarter earnings release
- Reuters: Wall Street ends sharply higher, lifted by Microsoft
- Associated Press: July 30 U.S. stock-index closing data
- U.S. Bureau of Economic Analysis: Q2 2026 GDP advance estimate
- U.S. Bureau of Economic Analysis: Personal Income and Outlays, June 2026
- U.S. Bureau of Economic Analysis: PCE Price Index data
- Federal Reserve: July 29, 2026 FOMC statement
- U.S. Energy Information Administration: World Oil Transit Chokepoints
- Reuters: Oil settles lower amid Middle East conflict
- Reuters: U.S. economic growth slows in the second quarter
- Reuters: June inflation slows as energy risk persists
Affiliate disclosure: Businessfinance.news may earn compensation from qualifying actions completed through selected links on this website, at no additional cost to the reader. Affiliate relationships do not influence our editorial reporting, analysis, or conclusions.