Two of the largest companies on earth reported earnings within an hour of each other on Thursday, July 30, 2026. Both are being reshaped by the same physical constraint — a shortage of memory chips severe enough that Goldman Sachs analysts have described the 2026 supply-demand gap as the tightest in fifteen years. One of them made the shortage look like a business model. The other made it look like a tax.
Amazon’s cloud unit grew 37% year over year, its fastest pace in eighteen quarters, and the stock rose roughly 13% on Friday, July 31. Apple posted the strongest June quarter in its history and fell more than 7% the same day, because the fiscal fourth-quarter outlook management attached to it was worse than Wall Street had modeled. Tim Cook, on his final earnings call before handing the chief executive role to hardware chief John Ternus, called what is happening to memory prices “a 100-year flood.”
That divergence is the answer to the question most readers arrived with. Apple did not miss. Apple beat on revenue and beat on earnings per share, and its shares fell anyway, because guidance for the September quarter implied 9% to 11% revenue growth against a consensus closer to 12%, and because management attributed the shortfall not to weak demand but to an inability to buy enough components at a price that protects margin. Amazon did not simply beat. Amazon reaccelerated the one business line — Amazon Web Services — that investors had spent nine months worrying was structurally losing ground to Microsoft and Google, and it did so while raising its 2026 capital spending plan to roughly $220 billion, citing higher memory costs as one reason the number went up.
The same 24 hours produced a third data point that belongs in the same story. South Korea’s Kospi index rose 17.9% on Friday to close at 6,695.45 — the largest single-day gain in the index’s history — after Samsung Electronics and SK Hynix posted their biggest one-day percentage advances on record. That rebound followed a three-day decline of more than 17%, which in turn followed a June peak above 9,000. And it came in the same week that an artificial-intelligence-focused hedge fund running roughly four times leverage was forced to hand its entire public equity book to Ken Griffin’s Citadel after margin calls from three prime brokers.
Put those pieces together and the week reads less like a referendum on whether AI demand is real and more like a stress test of how that demand has been financed. This article works through what was actually reported, what the numbers mean when you separate operating performance from accounting gains, why memory has become the binding constraint on the entire technology complex, how Korea’s market turned into the most violent expression of the AI trade anywhere in the world, and what the forced unwind of a $10 billion-plus fund does and does not tell you about the durability of the rally.
Key Takeaways
- Main development: Amazon and Apple reported on July 30, 2026, and moved in opposite directions the following session — Amazon up roughly 13%, Apple down roughly 7% — with the same memory chip shortage cited as a driver in both reports.
- Key figure: AWS revenue of $42.2 billion in the second quarter of 2026, up 37% year over year, against a consensus near $40.5 billion and analyst growth expectations of about 31% — a beat of roughly 6 percentage points on the growth rate.
- The catch on Amazon’s profit: Net income of $62.6 billion included a $53.4 billion pre-tax gain on Amazon’s stake in Anthropic. That is a non-cash mark, not operating performance. Operating income was $27.5 billion, up 43%.
- Apple’s problem is supply, not demand: Fiscal third-quarter revenue rose 16% to $109.4 billion with diluted EPS of $2.02, both above consensus. Fiscal fourth-quarter guidance of 9% to 11% revenue growth, with a 2.5 percentage-point foreign exchange headwind, is what moved the stock.
- Market response: South Korea’s Kospi rose 17.9% on July 31 to 6,695.45, its largest daily gain on record; Europe’s STOXX 600 hit an all-time high; US futures pointed higher premarket before the rally faded as the 30-year Treasury yield hovered near 5.22%, a level last seen in 2007.
- Why it matters: Memory is now the scarce input that determines who captures AI economics and who pays for them. It sits upstream of hardware margins, cloud capital budgets, consumer electronics pricing and the earnings of three companies in Korea, Japan and the United States.
- What comes next: Apple’s fiscal fourth quarter closes in late September, with John Ternus taking over as chief executive on September 1. Amazon guided third-quarter net sales to $197 billion–$202 billion. The next Federal Reserve decision follows a July hold at 3.50%–3.75% that drew three dissents in favour of a hike.
Last updated: July 31, 2026, 4:45 p.m. Eastern Time. Intraday market levels cited in this article carry their own timestamps.
The Week That Set Up Friday
To understand why a single trading session produced an 18% move in a developed-market equity index, it helps to walk back through the five sessions that preceded it, because almost nothing that happened on Friday was independent of what happened Monday through Thursday.
The week opened with a listing. On Monday, July 27, ChangXin Memory Technologies — CXMT, China’s largest domestic maker of dynamic random-access memory — began trading in Shanghai after raising 57.92 billion yuan, roughly $8.6 billion, at 8.66 yuan per share. It was the largest initial public offering in the history of mainland China’s semiconductor industry. The shares closed up approximately 466%, having traded as much as 531% above the offer price intraday.
The pop itself was less important than what investors read into it. CXMT derives the overwhelming majority of its revenue from commodity DRAM and has no meaningful presence in high-bandwidth memory, the stacked product that feeds Nvidia’s accelerators. As SemiAnalysis has argued in detail, the company is at least a technology generation behind the three incumbent suppliers on AI-grade memory. But a Chinese DRAM producer with state-adjacent capital and an $8.6 billion war chest is a credible threat to commodity pricing, and commodity pricing is where Samsung and SK Hynix earn a large share of their volume even when HBM earns the headlines.
On Tuesday and Wednesday, that anxiety collided with an earnings report. SK Hynix delivered a quarter that would have been unimaginable two years earlier and still disappointed. Revenue of 79.32 trillion won represented growth of 257% year over year. Operating profit of 60.54 trillion won was up 557%. Net profit of 93.92 trillion won was more than thirteen times the prior-year figure, and cumulative first-half revenue crossed 100 trillion won for the first time in company history. Analysts had modelled revenue closer to 84 trillion won and operating profit near 64 trillion won. The shares fell 9.6%.
The explanation offered by analysts was timing: HBM4 shipments came in lighter than expected, pushing revenue recognition into later periods. SK Hynix confirmed it had begun mass shipments of HBM4 during the quarter and said it planned to ramp production in the second half. That is a scheduling problem rather than a demand problem. Markets priced it as something worse, because by late July the market had stopped grading AI-linked semiconductor companies on growth and started grading them on whether they were beating an expectation curve that had been revised upward for six consecutive quarters.
By Tuesday, July 28, the Philadelphia Semiconductor Index had fallen 4.5% in a session and sat roughly 25% below its June peak — a bear market by the conventional definition. The Nasdaq 100 opened down 10% from its own June high of 30,660, entering correction territory. Notably, the selling was concentrated: memory names and custom-silicon designers took the damage while Nvidia held up, functioning as the group’s defensive asset — an unusual role for the most expensive large-cap stock in the world, and one worth remembering when assessing how orderly this repricing actually was.
Then, on Wednesday, July 29, the Federal Reserve gave the bond market something to chew on.
Fact Box
Central bank decisions, week of July 27–31, 2026
- Federal Reserve (July 29): Held the federal funds target range at 3.50%–3.75%, a sixth consecutive hold. Three officials dissented, all preferring a rate increase. Markets had priced roughly a 35% probability of a hike going in.
- Bank of England (July 30): Voted 6–3 to hold Bank Rate at 3.75%. Three Monetary Policy Committee members voted for 4.00%.
- Bank of Japan (July 31): Held the policy rate at 1.00% by an 8–1 vote, with board member Hajime Takata proposing 1.25%. The Bank said core inflation was likely to run “clearly above” 2% from the second half of its 2026 fiscal year.
- Euro area inflation (July 31): Flash annual HICP of 2.9% for July, up from 2.8% in June, in line with expectations. Energy inflation accelerated to 10.0% from 8.5%.
Original source: Eurostat flash estimate for July 2026 and CNBC’s report on the July FOMC decision
Warsh’s Fed and the market that did not believe him
Kevin Warsh’s July press conference was the fifth of his tenure as Federal Reserve chair, and it produced a reaction that should worry anyone running a duration-sensitive portfolio. The Committee held the target range at 3.50%–3.75%. Three officials dissented in favour of tightening — an unusually large bloc, and one that reflects genuine discomfort about inflation running above target while energy prices climb.
Warsh’s own message was hawkish in tone. He told reporters the central bank was committed to bringing inflation down and, in a line that circulated widely afterward, said there is “no soft inflation target.” He has also been visibly reworking how the institution communicates: the July statement was materially shorter than what had become standard, and one of the five internal task forces he has established is dedicated to communications.
The bond market’s response was the interesting part. Long yields rose rather than fell. The 30-year Treasury yield climbed from around 5.1% to 5.21% during and after the press conference, its highest since 2007, while the 10-year rose more than 7 basis points to 4.677%. Equities sold off, with the Dow Jones Industrial Average down more than 840 points, or 1.6%, the S&P 500 off 0.6% and the Nasdaq Composite down 0.5%.
A basis point is one hundredth of a percentage point, so a 7 basis-point move in the 10-year is a rise of 0.07 percentage points — small in isolation, meaningful in context, because it happened on a day when a hawkish chair delivered a hawkish message. When long yields rise after an inflation-fighting speech, the most common interpretation is that investors are demanding more compensation for holding long-dated paper rather than revising down their inflation expectations. CNN framed the reaction as the bond market asking Warsh to prove it, which is a fair characterisation of a term-premium repricing.
By Friday, July 31, the 10-year had touched 4.737% intraday, its highest since January 2025, with the 30-year hovering near 5.22%. That backdrop matters for equity valuation generally and for the AI complex specifically, because the case for spending hundreds of billions of dollars on assets that depreciate over five years is more fragile when the risk-free discount rate is climbing.
Apple’s Quarter: A Record June, and a September Nobody Liked
Apple reported fiscal third-quarter results for the period ended June 27, 2026, after the close on Thursday, July 30. On the reported numbers, it was the best June quarter the company has ever produced.
| Measure | Result | Change vs. year earlier | Versus expectations |
|---|---|---|---|
| Total revenue | $109.4bn | +16% | Above ~$108.8bn consensus |
| Diluted EPS | $2.02 | +29% | Above ~$1.89 consensus |
| Net income | $29.8bn | — | — |
| iPhone revenue | $54.3bn | +21.7% | Ahead |
| Services revenue | $30.7bn | +12.1% | Below ~$31.2bn consensus |
| Greater China revenue | $18.82bn | +22% | Below ~$19.5bn consensus |
Cook’s framing in the release was that this was Apple’s “strongest June quarter ever, with double-digit revenue growth across iPhone, Mac and Services, and in every geographic segment.” Read narrowly, that is accurate. Read as a description of what investors were reacting to, it is beside the point.
The guidance that did the damage
Apple does not issue formal quarterly guidance in the way most large caps do; it provides directional revenue and margin ranges on the call. For the fiscal fourth quarter — the September quarter, which will be the first full period under new leadership — management pointed to year-over-year revenue growth of 9% to 11% and a gross margin of 47% to 48%, and flagged a foreign exchange headwind of approximately 2.5 percentage points.
Consensus had been sitting closer to 12% growth. The gap sounds narrow. On a base of roughly $95 billion in prior-year September-quarter revenue, one to three percentage points is a difference measured in billions of dollars, and more importantly it is a difference in direction. Apple has spent the past several quarters accelerating. The September guide implies deceleration in a period that includes the iPhone launch cycle, which is the single most reliable growth quarter in the company’s calendar.
What makes the guide unusual is the stated reason. Cook did not describe softening demand. He described an inability to convert demand into shipments. Shortages of memory and other components, he said, would constrain shipments of iPhones, Macs and certain iPads during the fourth quarter, with guidance for those categories landing below Street expectations even though underlying demand remained healthy.
“A 100-year flood”
The phrase that defined the call was Cook’s description of memory pricing as “a 100-year flood on the memory pricing, with exponential increases in memory prices.” Fortune reported the remark as the closing note of Cook’s fifteen-year run of earnings calls, and it is worth taking seriously precisely because Cook is not a hyperbolic communicator. He built his reputation as an operations executive. Supply chain is the discipline he is famous for. When the person who spent a decade and a half making Apple’s procurement the envy of the industry says the pricing environment is a hundred-year event, the reasonable inference is not that he is dramatising. It is that the constraint is genuinely outside the range his organisation has planning models for.
Cook confirmed Apple has absorbed rising memory costs for three consecutive quarters and expects fourth-quarter costs to be higher still. That is the mechanism by which a component shortage becomes a guidance problem: it compresses gross margin, and when a company chooses to defend margin rather than volume, it constrains units.
There is a second-order effect that matters more for consumers than for the quarter. Apple has already raised hardware prices in response, with MacBook and iPad increases reported earlier in the year. CNN reported in mid-July that the memory squeeze was pushing price increases across consumer electronics well beyond Apple. If the shortage persists into 2027 and 2028, as most supply-side analysts expect, the average selling price of a mainstream smartphone is going to move structurally higher — not because manufacturers are exercising pricing power, but because the bill of materials moved.
Services and China: the two soft spots that got less attention
The memory story dominated coverage, but two line items in the quarter deserve scrutiny independent of it.
Services revenue of $30.7 billion grew 12.1% and missed consensus of roughly $31.2 billion. Services is the segment on which Apple’s valuation multiple rests, because it carries a gross margin roughly double the hardware business and because it converts an installed base into recurring revenue. A miss of about $500 million on a $31 billion line is not a crisis. A second consecutive quarter of decelerating Services growth would be a different conversation, and it is the number to watch when Apple reports in late October or early November.
Greater China revenue of $18.82 billion grew 22% — an excellent growth rate in absolute terms — but landed below the roughly $19.5 billion analysts had modelled. China has been the swing factor in Apple’s results for four years, and a 22% growth rate that still misses tells you expectations there had been reset upward aggressively. It also sits against a geopolitical backdrop in which US–China technology and critical-minerals frictions have been re-escalating, a risk Apple carries more directly than any other American company of its size given the concentration of its manufacturing base.
The handover
This was Cook’s last quarter as chief executive. John Ternus, currently senior vice president of hardware engineering, takes over on September 1, 2026. Cook is 65.
The timing is awkward in a specific way. Ternus inherits a company whose immediate operational problem is procurement of a commodity input, which is the domain his predecessor personally dominated, and whose strategic problem is that it is widely perceived to have arrived late to generative AI. One assessment circulating this week framed the transition around the market value Apple has ceded relative to peers during the AI buildout. That framing is contestable — Apple was, by several accounts, the best-performing member of the largest US technology cohort year to date before this report, precisely because it was the one place investors could hide from AI capital-spending risk. The uncomfortable irony of Thursday’s results is that the hiding place turned out to be exposed to the AI boom after all, just through the cost line instead of the revenue line.
Fact Box
Apple fiscal Q3 2026 at a glance
- Quarter ended June 27, 2026; results released after the close on July 30, 2026.
- Revenue $109.4 billion, up 16% year over year — a record June quarter.
- Diluted earnings per share $2.02, up 29%; net income $29.8 billion.
- Fiscal Q4 outlook: revenue growth of 9%–11% year over year; gross margin 47%–48%; approximately 2.5 percentage points of foreign exchange drag.
- Chief executive transition: John Ternus succeeds Tim Cook effective September 1, 2026.
Original source: Apple’s third-quarter results announcement and the accompanying Form 8-K exhibit filed with the SEC
Amazon’s Quarter: Reacceleration, and a $53 Billion Asterisk
Amazon’s second quarter of 2026, which ended June 30 and was reported the same evening as Apple’s, was the more consequential of the two for the AI narrative, and it requires more care to read than the headlines suggest.
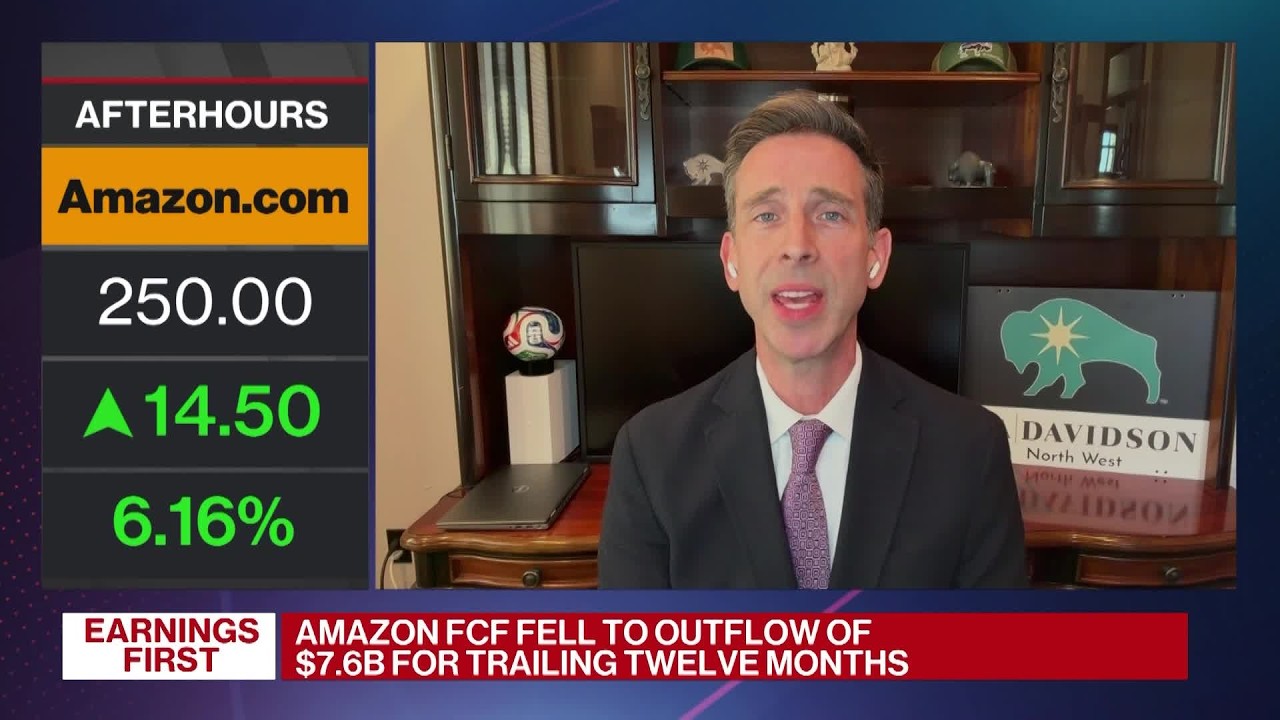
Start with what is unambiguously operating performance. Net sales reached $200.6 billion, up 20% from $167.7 billion a year earlier — the first time Amazon has crossed $200 billion in a quarter, and comfortably ahead of the roughly $196.5 billion analysts expected. Operating income rose 43% to $27.5 billion from $19.2 billion. North America segment sales rose 16% to $116.2 billion; international grew 15% to $42.2 billion. Advertising services revenue climbed 26% to $19.8 billion, which is a business now running at close to $80 billion annualised and carrying margins the retail operation cannot approach.
AWS: the number that mattered
AWS produced $42.2 billion of revenue, up 37% year over year. That is the division’s fastest growth since 2021 — eighteen quarters — and it exceeded a consensus near $40.5 billion. Perhaps more telling, analysts had modelled roughly 31% growth, so the beat was about 6 percentage points on the growth rate itself, not merely on the dollar figure.
Segment profitability moved with it. AWS operating income reached $16.6 billion against $10.2 billion a year earlier, an operating margin of 39.4%. The division exited the quarter at an annualised revenue run rate of approximately $169 billion. Amazon separately disclosed that its AI business and its custom-silicon business had each passed a $25 billion annual run rate.
The reason this mattered so much to sentiment is competitive. For most of the past two years the market’s working assumption was that Microsoft and Google had structural advantages in the AI phase of cloud — Microsoft through its OpenAI relationship, Google through owning its own models and its own tensor processing units — and that AWS, despite being the incumbent leader, was a laggard. Microsoft’s fiscal fourth quarter, reported on July 29, showed Azure growth accelerating to 43% from 40%, with Azure crossing $100 billion in annual revenue, up 41%. AWS growing 37% off a much larger base narrows a gap the market had assumed was widening.
Chief executive Andy Jassy, who ran AWS before taking the top job, has been explicit that he sees the current moment as a repeat of the original cloud build-out. He said AWS is “booming” and told investors that even at $220 billion of capital expenditure the company will not have enough capacity to meet 2026 demand, that the same is likely to hold in 2027, and that already-committed 2028 demand is “striking.” On silicon, the company indicated Trainium2 is largely sold out, Trainium3 nearly fully subscribed following initial 2026 shipments, and a meaningful share of Trainium4 capacity reserved before broad availability.
That is a strong claim set. It is also, importantly, a claim set — forward commentary from an interested party, not audited fact. Investors bought it on Friday. Whether backlog converts to recognised revenue at the margins implied is the question that resolves over the next four to six quarters.
The $53.4 billion problem with the profit line
Here is where most coverage got lazy. Amazon’s reported net income was $62.6 billion, up more than 243% from $18.2 billion, with earnings per share of $5.75 against a consensus near $1.82. Those headline numbers circulated all day Friday as evidence that Amazon had “tripled” profits.
They did not. Included in that figure is a pre-tax gain of $53.4 billion on Amazon’s investment in Anthropic. That is a mark-to-market adjustment to the carrying value of a private equity stake, recognised in non-operating income. It generates no cash. It reflects a third-party funding round — Anthropic was valued at $965 billion in a Series H round in late May 2026 — rather than anything Amazon’s operations did during the quarter.
Strip it out and the picture is still very good and considerably more sober. Operating income of $27.5 billion, up 43%, is the number that describes the business. The gap between $27.5 billion of operating income and $62.6 billion of net income is one of the largest divergences of its kind in the history of American corporate reporting, and any analysis that quotes the EPS beat without flagging it is misleading readers.
There is a further wrinkle worth naming plainly. Amazon has invested approximately $13 billion in Anthropic with commitments of up to $20 billion more. Anthropic is a major AWS customer and has committed to Amazon’s Trainium silicon. So Amazon is simultaneously an investor in, supplier to, and beneficiary of the revaluation of a company whose spending flows back through Amazon’s own income statement. This is not an accusation of impropriety — the accounting treatment is conventional and disclosed. But it is precisely the kind of interlocking relationship that critics of the AI capital cycle point to when they argue that end demand looks larger and more independent than it is.
Capital expenditure: $220 billion, and why the number moved
Amazon raised its 2026 capital expenditure expectation to approximately $220 billion, from the $200 billion it had guided to in February and reaffirmed in April. Jassy attributed part of the increase to rising memory prices.
Read that sentence next to Tim Cook’s flood metaphor and the connective tissue of the whole week comes into focus. The same input cost inflation that is squeezing Apple’s device margins is inflating Amazon’s data centre bill. The difference is what each company can do about it. Apple sells a finished good into a consumer market with elastic demand and visible price points, so cost inflation either compresses margin or suppresses units. Amazon sells capacity into a market where, by its own account, demand exceeds supply through 2028, so cost inflation is more readily passed through — or, at minimum, absorbed against a revenue line growing 37%.
That asymmetry is the honest summary of Friday’s divergence, and it is more durable than a single quarter’s results. It is also not risk-free for Amazon. A $220 billion annual capital programme creates a depreciation schedule that lands on the income statement for years, whatever happens to demand. Microsoft’s own disclosure in the same week is instructive: it lowered its calendar 2026 capital expenditure forecast to approximately $175 billion from about $190 billion, in part by extending the assumed useful life of office and data centre properties to 25 years from 15. Extending useful life reduces annual depreciation expense. It is a permissible accounting judgement. It also flatters near-term earnings, and it moves in exactly the opposite direction from the argument made by sceptics who contend that AI infrastructure is being depreciated too slowly, not too quickly.
| Measure | Q2 2026 | Q2 2025 | Change |
|---|---|---|---|
| Net sales | $200.6bn | $167.7bn | +20% |
| Operating income | $27.5bn | $19.2bn | +43% |
| Net income (incl. Anthropic gain) | $62.6bn | $18.2bn | +243% |
| AWS revenue | $42.2bn | — | +37% |
| AWS operating income | $16.6bn | $10.2bn | Margin 39.4% |
| Advertising services | $19.8bn | — | +26% |
| North America segment | $116.2bn | — | +16% |
| International segment | $42.2bn | — | +15% |
For the third quarter, Amazon guided net sales to a range of $197 billion to $202 billion and operating income to $22.5 billion to $26.5 billion. Note that the operating income guide, at its midpoint, sits below the $27.5 billion just reported. That is consistent with a company absorbing higher input costs and heavier depreciation while continuing to invest, and it is the sort of detail that tends to be overlooked in a session when the stock is up 13%.
Fact Box
Separating Amazon’s operating result from its accounting gain
- Operating income: $27.5 billion, up 43% year over year. This reflects the business.
- Reported net income: $62.6 billion, which includes a $53.4 billion pre-tax gain on the Anthropic stake.
- Nature of the gain: a non-cash revaluation of a private holding, following Anthropic’s late-May 2026 Series H round at a reported $965 billion valuation.
- Why it matters: reported EPS of $5.75 against roughly $1.82 consensus is not comparable to the estimates it “beat,” because most analyst models exclude such marks.
Original source: CNBC’s report on Amazon’s second-quarter 2026 results
The Memory Chip Shortage: The Variable Underneath Everything
Almost every thread in this week’s news runs through the same physical bottleneck, so it is worth explaining properly rather than gesturing at it.
How the shortage happened
Three companies — Samsung Electronics, SK Hynix and Micron Technology — produce the overwhelming majority of the world’s dynamic random-access memory. DRAM is a commodity in the economic sense: fungible, cyclical, historically prone to devastating price collapses when the three producers all add capacity at once. For most of the past thirty years the industry’s defining problem has been oversupply.
High-bandwidth memory changed the shape of the market. HBM is DRAM dies stacked vertically and connected with through-silicon vias, sitting adjacent to an AI accelerator on the same package. It is what allows a modern GPU to feed its compute units fast enough to be useful. It also consumes substantially more wafer capacity per usable bit than conventional DRAM, because of the stacking, the packaging complexity and the yield loss.
So when the three producers shifted capacity toward HBM to serve Nvidia, AMD and the hyperscalers’ custom silicon programmes, they did not simply add a product line. They removed conventional DRAM capacity from a market whose demand — from smartphones, PCs, servers, automotive and industrial customers — did not shrink. The result is a structural shortfall in the commodity product caused by a boom in the premium product.
What the numbers look like
The pricing data is stark. Goldman Sachs analysts have estimated a 2026 DRAM supply-demand gap of 4.9%, which they characterise as the most severe in fifteen years. Spot DRAM prices have risen roughly 52% since January 2026. Contract pricing rose an estimated 98% in the first quarter of 2026 alone, with further increases in the range of 58% to 63% forecast for the current quarter. Some suppliers have reportedly told customers to plan for increases of 10% to 20% per month through the end of 2026.
On the HBM side, Micron’s capacity is reported sold out through 2026, with demand exceeding supply by an estimated 50% to 67%, and HBM4 shipments for Nvidia’s Vera Rubin platform beginning in March 2026. SK Hynix, Samsung and Micron remain the only volume HBM producers, and HBM is effectively spoken for in 2026 under multi-year supply agreements.
Most supply-side analysis expects tightness to persist into late 2027 or 2028, because new fabrication capacity takes years to build and qualify. CNBC reported in June that the crunch had reached the point where even Apple’s purchasing scale offered no protection — a claim Thursday’s guidance substantiated.
Fact Box
Memory market snapshot, mid-2026
- Estimated 2026 DRAM supply-demand gap of 4.9%, described by Goldman Sachs as the most severe in fifteen years.
- DRAM spot prices up approximately 52% since January 2026.
- Micron’s high-bandwidth memory capacity reported sold out through 2026.
- Three producers — Samsung Electronics, SK Hynix and Micron — account for the great majority of global DRAM and all volume HBM output.
- China’s CXMT listed in Shanghai on July 27, 2026, raising 57.92 billion yuan (approximately $8.6 billion), the largest mainland semiconductor IPO on record; it currently has no meaningful HBM presence.
Original source: SemiAnalysis on CXMT’s challenge to the DRAM incumbents
Who wins, who pays
The distributional consequences are unusually clean, which is why the market has repriced so violently around them.
The producers win, spectacularly, until they don’t. SK Hynix’s 557% year-over-year operating profit growth is what a genuine shortage looks like on an income statement. The vulnerability is that the same economics guarantee a capacity response, and capacity responses in memory have historically overshot. CXMT’s arrival adds a producer with different capital-cost discipline and a strategic mandate that may not be strictly commercial.
The hyperscalers pay, but pass through. Amazon’s capex increase is the direct evidence. So is Microsoft’s decision to lengthen depreciation schedules, which softens the earnings impact of a more expensive asset base.
Consumer hardware makers pay and cannot fully pass through. Apple’s guidance is the clearest single illustration available anywhere in the market. It is not alone — the pressure extends across PCs, gaming consoles and smartphones.
Consumers pay last and slowest, through higher device prices and, quite possibly, through less generous base configurations. If the cost of the memory in a phone doubles, the least visible way to protect margin is to stop increasing the storage that ships in the entry-level model.
Korea’s Record Session: An 18% Day Is Not a Healthy Day
On Friday, July 31, the Kospi closed 17.9% higher at 6,695.45. That is the largest single-day gain in the index’s history. Samsung Electronics rose approximately 28% and SK Hynix approximately 30% — both record one-day percentage advances, with SK Hynix hitting its daily limit.
The immediate catalysts were external: strong Microsoft and Amazon cloud results reframing the AI capital cycle as intact, and a rebound in US AI-linked shares. But an 18% move in a developed-market index of Korea’s size and liquidity is not explicable by good news alone. It is the signature of position unwinding in a market that had become mechanically leveraged.
What came before
The Kospi peaked above 9,000 in June. By July 16 it had fallen 25% from that peak. In the three sessions immediately before Friday it lost more than 17%. Over roughly two and a half months, forced liquidations in the Korean market reportedly totalled 2.3 trillion won.
The proximate causes were the ones already described — the CXMT listing raising the spectre of Chinese competition in commodity DRAM, and SK Hynix’s record-but-short-of-expectations quarter — layered on a broader global de-rating of AI-linked semiconductors. But the amplitude was domestic.
The leverage machine
Korean retail investors had piled into single-stock leveraged exchange-traded funds tracking Samsung Electronics and SK Hynix. These products deliver a multiple of a single company’s daily return and rebalance daily, which means they mechanically buy into strength and sell into weakness. In a market where a handful of names dominate the index, a large enough stock of such products converts ordinary volatility into forced flow.
Regulators moved during the week. The Financial Services Commission temporarily halted new listings of single-stock leveraged ETFs, to remain in place until conditions stabilise. Authorities also raised the minimum deposit requirement for leveraged ETF trading to 30 million won, roughly $20,300, from 10 million won, with implementation expected on August 5, and moved toward capping individual investors’ holdings of such products at 20% of their total portfolio. The exchange’s sidecar mechanism — an automatic brief halt on programme trading triggered by sharp futures moves — had reportedly fired for ten consecutive sessions.
These are sensible measures arriving late. They also do not address the underlying issue, which is that an index dominated by two memory manufacturers will be violently sensitive to the AI capital cycle regardless of what retail derivatives are permitted.
How to read the rebound
A guest on Bloomberg’s morning programme on Friday, markets columnist Ven Ram, put the point sharply, arguing that the Korean market had been “behaving more like a casino than a stock market” and that the move was positional rather than fundamental. That is an opinion, not a finding, and it is worth weighing against the fact that the fundamentals underneath Samsung and SK Hynix are, by any historical standard, extraordinary.
Both readings can be right. SK Hynix’s operating profit genuinely grew 557%. The Kospi genuinely remains far below its June high even after a record day. A market can be underpinned by real earnings and still be priced by leverage. The practical implication for investors is that Korean chip equities are currently a poor instrument for expressing a view on AI demand, because the noise term dominates the signal term over any horizon shorter than a year.
| Security or index | Market | Move | Reported driver |
|---|---|---|---|
| Kospi | Korea Exchange | +17.9% to 6,695.45 | Record daily gain; chip rebound |
| SK Hynix | Korea Exchange | approx. +30% | Record one-day gain; hit daily limit |
| Samsung Electronics | Korea Exchange | approx. +28% | Record one-day gain |
| STOXX Europe 600 | Pan-European | +0.9% to 655.45 (08:36 GMT) | Record high; technology leadership |
| Amazon (AMZN) | Nasdaq | approx. +13% | AWS reacceleration |
| Apple (AAPL) | Nasdaq | approx. −7% | Fiscal Q4 guidance below consensus |
| Universal Music Group | Euronext Amsterdam | approx. −23% | Subscription growth miss; record low |
| Vivendi | Euronext Paris | approx. −14% | Largest one-day fall since August 2002 |
The Situational Awareness Unwind: Leverage, Not Thesis
The most instructive story of the week involved no earnings report at all.
Situational Awareness, the artificial-intelligence-focused fund founded by former OpenAI researcher Leopold Aschenbrenner, was forced during the week to unwind its entire public equity portfolio. Ken Griffin’s Citadel bought the bulk of it. The trigger was margin calls from the fund’s prime brokers — reported to include Goldman Sachs, JPMorgan Chase and Bank of America — against a portfolio carrying leverage of roughly four times.
What is confirmed, what is reported, and where sources disagree
This distinction matters more than usual here, because the figures in circulation differ substantially depending on which outlet you read, and several of them are not measuring the same thing.
The Financial Times reported that Citadel bought a large portion of Situational Awareness’s roughly $16 billion in public equity holdings. Bloomberg reported that the fund’s overall assets fell to approximately $10 billion, down from around $20 billion in recent months. CNBC’s reporting has described a decline from $45 billion. These are not necessarily contradictory: $45 billion plausibly describes gross market exposure including borrowed money, $20 billion net assets before the drawdown, and $16 billion the public equity book specifically. But no party has published a reconciliation, and readers should treat any single headline number with caution.
What multiple outlets agree on: the portfolio included positions in AI-linked names including Broadcom, Intel, CoreWeave, SK Hynix and Bloom Energy, along with cryptocurrency miners. Citadel took over the portion financed through prime brokerage leverage. The fund’s stake in Anthropic — reported at north of $5 billion — was not part of the transaction and remains. The fund reportedly explored selling stakes in private companies but did not proceed after reaching agreement on the equity book. It has been seeking fresh capital.
On performance, the fund reportedly returned 439% in the first half of 2026 and had gained more than 1,000% since inception before this month’s decline. Those are extraordinary figures, and they are also the explanation for what followed.
Fact Box
Situational Awareness: what is established and what is not
- Established across multiple outlets: the fund unwound its public equity portfolio; Citadel acquired the bulk of it; margin calls from prime brokers triggered the sale; the Anthropic stake was excluded.
- Disputed or inconsistently reported: the fund’s peak assets, variously described as approximately $45 billion, approximately $20 billion, and a public equity book of roughly $16 billion. These figures likely measure different things.
- Not independently verified: the precise discount at which the portfolio changed hands, and the identity and size of every position.
- Not established at all: online speculation that any market participant engineered the sell-off. No evidence supporting such a claim has been presented publicly.
Original source: Bloomberg’s report on the fund’s asset decline and CNBC’s reporting on the forced unwind
The mechanism, in plain terms
A fund running four times leverage has borrowed roughly four dollars for every dollar of its own capital. That arrangement multiplies gains, which is why a concentrated bet on AI equities produced a 439% first half. It multiplies losses identically. If the underlying portfolio falls 20%, an unhedged four-times-levered position loses roughly 80% of equity capital before financing costs.
Prime brokers manage this exposure through margin requirements. When collateral values fall, they demand more collateral. If the fund cannot post it, the broker can liquidate. Critically, brokers tend to raise requirements at exactly the moment the market is falling, which forces selling into weakness, which pushes prices lower, which triggers further calls. This reflexive loop is the single most reliable way that leverage converts a market decline into a liquidation event, and it is why the speed of this episode — days, not weeks — should not be surprising.
Why Citadel
Very few firms can absorb billions of dollars of concentrated equity risk in a single negotiated transaction. Citadel is one of them. The commercial logic is straightforward: a forced seller with a deadline is a price-taker, and a buyer with balance sheet capacity and the ability to hedge or warehouse the exposure can demand a discount for providing immediacy. This is a well-established function of large multi-strategy firms and market makers, and it is not evidence of anything improper.
It is, however, evidence of concentration. The number of institutions capable of clearing a book this size in one transaction has shrunk over the past decade. That is a structural feature of modern markets worth noting: liquidity in a crisis is increasingly supplied by a small number of very large private firms, on terms they set.
What it says — and does not say — about AI
The temptation is to read the unwind as a verdict on the AI trade. The evidence does not support that reading, and the more careful commentary this week avoided it.
What was tested was the financing structure, not the thesis. The fund’s positions were in companies whose underlying results, in several cases, were strong. SK Hynix’s operating profit rose 557%. AWS accelerated to 37%. The problem was that a concentrated portfolio funded with four times leverage cannot survive a 20% drawdown in its holdings regardless of whether those holdings are correctly valued over five years.
That said, two genuine warning signs sit inside the episode. First, the fund’s positions overlapped substantially with the crowded consensus — the same names, in the same direction, held by many of the same investors. Crowding is what turns one fund’s forced selling into everyone’s problem, and the concentrated damage in memory and custom-silicon names during the week is consistent with exactly that dynamic. Second, the fund’s remaining principal asset is a private stake in Anthropic, marked at a valuation set by a primary funding round rather than a liquid market. Private marks are the last thing to reprice in a drawdown. That is a general observation about the structure of AI exposure across the industry, not a claim about this fund’s specific carrying value.
The Bank of Japan’s Credibility Problem, and a Yen That Will Not Behave
The other major event on Friday was monetary. Hours after Japanese authorities were reported to have intervened in the currency market — in conjunction with US authorities conducting a “rate check,” a step usually understood as a precursor to intervention — the Bank of Japan held its policy rate at 1.00%.
The vote was 8–1. Board member Hajime Takata dissented, proposing an increase to 1.25%. In its outlook, the Bank said core inflation was likely to accelerate to a level “clearly above” 2% from the second half of its 2026 fiscal year, citing wage increases being passed into selling prices, higher crude oil prices and the recent depreciation of the yen. Governor Kazuo Ueda’s press conference struck a tone most strategists read as mildly hawkish, with the governor saying policymakers needed to scrutinise upside inflation risks more closely.
The currency’s behaviour tells the story of how that landed. The yen had been trading around 163 to the dollar. The suspected intervention drove it as strong as 157.96. After the Bank’s decision, the gains faded. By late in the European morning it had drifted back toward the 159 area, with further sharp moves during the session.
Why hawkish talk stopped working
Jane Foley, head of foreign exchange strategy at Rabobank, made the most useful observation of the morning on Bloomberg’s programme: the Bank of Japan was hawkish, and the market has simply decided that hawkish language is no longer the variable it cares about. What it wants is a faster cadence of increases. Foley’s own view, as she described it, is that an October hike would be a first step toward a firmer yen, but that for dollar-yen to hold below 160 the market may also need to price out further Federal Reserve tightening this year.
That second condition is the crux. Currency pairs are relative prices. The yen’s weakness is not solely a Japanese phenomenon; it is also a function of a US policy rate at 3.50%–3.75% with three Federal Reserve officials pushing for more, and 30-year Treasury yields above 5.2%. A one-quarter-point move in Tokyo does not close a gap of that size.
Foley also pointed to something structural that receives less attention than it deserves: the composition of Japanese government bond ownership has shifted as the Bank of Japan’s balance sheet has contracted, and that shift has coincided with pressure on JGBs and on the currency. Japan’s 30-year yield reached 3.94% at the end of June, and the 10-year has traded above 2% for the first time in two decades. When a central bank steps back from a market it dominated for a decade, private buyers must be found, and they price risk differently. Foley suggested there may be lessons in that experience for Warsh should he pursue balance-sheet changes in the United States — an analogy worth taking seriously rather than dismissing.
The fiscal overlay
There is a political dimension that the market is clearly pricing. Prime Minister Sanae Takaichi’s government has pursued expansionary fiscal policy, including a stimulus package approved in November totalling 21.3 trillion yen, roughly $135.5 billion. Investors have read that programme, and the associated bond issuance, as adding to supply pressure at the long end while implying institutional resistance to faster monetary tightening.
Whether the Bank of Japan is in fact under political pressure not to raise rates is not something any outside observer can establish. What can be observed is that the market is behaving as though it believes the risk is real, and that belief has become part of the yen’s price. Ueda’s problem is that the standard remedy for such a belief — a surprise hike — is precisely what the Bank declined to deliver on a morning when the currency had just been supported by public money. That combination gave the intervention a shorter half-life than it might otherwise have had.
The critical view, articulated on Friday by Ven Ram, is that the Bank squandered an opportunity: with no hike priced, a move would have caught the market unprepared and supported the currency more durably than intervention can. The counterargument, which deserves equal weight, is that central banks that surprise markets to defend exchange rates tend to damage the predictability of their own reaction function, and Japan has spent years rebuilding exactly that. Reasonable people disagree here, and the disagreement will be resolved by the October meeting rather than by argument.
Europe’s Record, and a Quiet Rewrite of Merger Rules
European equities had the better week and, by several measures, the better month. The STOXX Europe 600 hit a fresh all-time high on Friday, up 0.9% at 655.45 by 08:36 GMT, led by technology names that had been among the worst performers earlier in the week. The rally extended a stretch of European outperformance relative to the United States that has been building through 2026.
Beneath the index, the bond market was less comfortable. Euro area flash inflation for July came in at 2.9%, up from 2.8% in June and in line with economists’ expectations. The composition was the concerning part: energy inflation accelerated to 10.0% from 8.5%, services to 3.3% from 3.2%, and non-energy industrial goods to 0.9% from 0.7%, while food, alcohol and tobacco decelerated to 1.2% from 1.5%. French preliminary harmonised inflation came in at 2.4%, materially above the 2.1% average of a Reuters poll of seventeen analysts. Short-dated European yields rose.
It is worth flagging a small discrepancy that circulated on Friday. Some market commentary described the euro area print as having exceeded expectations. Eurostat’s flash estimate was in line with consensus; it was the French number that surprised to the upside, and it was the energy component that did the work. The distinction matters because energy-driven inflation is the kind central banks have historically looked through, whereas services inflation at 3.3% is the kind they cannot.
The merger guidelines nobody outside Brussels is watching closely enough
Running underneath the market story is a regulatory one with a long fuse. On April 30, 2026, the European Commission published draft revised Merger Guidelines — the most significant overhaul of EU merger control in more than two decades. The draft consolidates the horizontal guidelines dating from 2004 and the non-horizontal guidelines from 2008 into a single framework. Consultation closed on June 26, 2026, and the Commission is expected to finalise its review in the fourth quarter, with adoption anticipated around the end of 2026 or early 2027.
The substantive shift is toward accepting efficiency and benefit arguments that the previous regime treated with scepticism. The draft devotes roughly fifteen pages to benefits from mergers, against about two pages in the existing guidelines, and establishes a structured “theory of benefit” framework alongside the traditional theories of harm. It gives greater weight to innovation, dynamic competition, industrial scale, resilience and sustainability, and it introduces a more explicitly forward-looking assessment of what one practitioner described as the dynamic competitive potential of a transaction.
The political motivation is not concealed. Europe’s anxiety about its position in artificial intelligence and its broader growth performance has been building for two years, reinforced by a series of high-profile official reports. A claim made on Bloomberg’s Wall Street Week — that 43 of the 50 largest AI companies are US-based and one is European — circulated widely this week. That specific figure depends entirely on how one defines “largest” and “AI company,” and it has not been independently verified here, but the directional point it illustrates is not seriously contested.
The draft guidelines also address the exit problem for startups, providing clearer routes for early investors to realise returns through acquisition. That is a meaningful design choice: venture capital funding depends on plausible exits, and if the only viable acquirers of European AI startups are American, restricting acquisitions constrains the funding available to build European ones in the first place. Whether loosening merger review is the right instrument for that problem is a genuine policy debate, and the answer will not be known for years.
The Rest of the Tape: Coinbase, Universal Music, and Big Oil
Coinbase: market share up, revenue down
Coinbase reported second-quarter results showing revenue of $1.22 billion, down 14% from the prior quarter and below Wall Street’s roughly $1.3 billion forecast, with a net loss of $359.5 million, or $1.36 per share. It was the third consecutive quarter in which the exchange fell short of targets. Shares were down more than 4% in Friday morning trading.
The context is a soft crypto market rather than a company-specific failure. Total crypto market capitalisation fell 11% quarter over quarter. Industry-wide spot trading volume dropped 25%, total crypto trading volume 15%, and realised volatility 14% — and volatility, more than price level, is what drives exchange revenue.
Against that backdrop, several disclosures cut the other way. Coinbase reported an all-time-high 10.3% share of crypto trading volume, its third consecutive quarter of record share. Subscription and services revenue reached $555 million, a record 48% of net revenue, which is the diversification the company has been promising for years. Prediction market contracts and revenue grew 106% quarter over quarter, crossing $100 million in annualised revenue.
The honest reading is that Coinbase is executing a transition from a volatility-dependent trading business toward recurring revenue, and that the transition is real but not yet far enough along to insulate reported results from the crypto cycle. A quarter with a $359.5 million net loss is not a quarter to explain away.
Universal Music: the worst day the industry has had in years
Universal Music Group fell approximately 23% on Friday to a record low. Vivendi, its largest shareholder, dropped about 14% — its largest one-day decline since August 2002.
The trigger was subscription revenue growth of 6.9% year over year excluding foreign exchange, down from 12.5% in the first quarter and well short of a Bloomberg consensus near 11%. Streaming revenue fell 3.9% ex-FX, reversing 10.3% growth in the first quarter. Management attributed the decline to deceleration at key advertising-based platform partners and to shortfalls related to the timing of deal renewals.
Two specific events sit behind that language. Universal ended its partnership with Meta Platforms in May, and it lost roughly a month of revenue during its licensing dispute with TikTok. Both are the consequence of a deliberate strategy: the company has been willing to pull catalogue from platforms to negotiate better terms. That strategy has worked before. This quarter it produced a visible revenue hole, and the market punished it severely — a reminder that when a business is valued on the assumption of durable double-digit subscription growth, any interruption is priced as a change in the growth algorithm rather than a timing effect.
Big Oil: a war premium, unevenly captured
Exxon Mobil and Chevron both reported before Friday’s opening bell, into an oil market that has been driven all year by conflict involving Iran and by the intermittent functioning of the Strait of Hormuz, through which roughly one-fifth of global energy supplies normally transit.
Exxon reported second-quarter earnings of $14.5 billion, or $3.48 per share, with adjusted earnings of $14.7 billion, or $3.52 per share — up approximately 105% year over year, but below analyst estimates. The company cited its highest upstream production in more than two decades excluding Middle East disruptions, with record output from the Permian Basin, while scheduled maintenance costs weighed on results.
Chevron beat. Profit of $12.07 billion represented a roughly 385% increase over the prior-year period, with adjusted earnings of $6.06 per share against consensus near $5.57, driven by surging refining margins. Both companies faced production losses estimated around 6% from Middle East disruption.
The divergence between the two is essentially a question of where in the value chain each is weighted. Refining margins expand when crude supply is disrupted but product demand holds; upstream production suffers directly when specific assets are offline. Chevron’s mix worked in its favour this quarter.
On price, Brent traded above $88 in late July and was on track for a monthly gain exceeding 20%. The path there was violent: a 7.9% single-session surge followed by a 1.8% decline to below $89 on Thursday as tanker traffic through the Strait improved. Earlier in 2026, Brent traded above $102 and spiked as high as $109.10 during the most acute phase of the conflict.
The commentary from oil executives across this earnings season has been unusually humble about forecasting. Shell and TotalEnergies both described the market as difficult to call for the remainder of the year, because prices have been driven by headlines and diplomatic developments rather than by inventory and demand fundamentals. That is a reasonable position for a management team to take, and it is also a warning to anyone building a 2027 model on current strip prices.
The AI Bubble Argument, Stated Fairly on Both Sides
July 2026 was the month the bubble debate stopped being theoretical for equity investors. It is worth setting out both cases properly, because most coverage picks one and caricatures the other.
The strongest case that this is not a bubble
The revenue is real and it is accelerating at the largest providers. AWS grew 37% off a $169 billion annualised base. Azure grew 43% and crossed $100 billion in annual revenue, up 41%. These are not speculative pre-revenue businesses; they are the two largest cloud franchises in the world reporting faster growth at greater scale, which is the opposite of what a saturating market looks like.
Contracted future revenue is being disclosed and it is enormous. Microsoft’s commercial remaining performance obligations rose 84% to $678 billion. RPO is not recognised revenue and its conversion timing is uncertain, but it is a contractual commitment, not a projection.
The supply constraint is physical and verifiable. You cannot fake a memory shortage. The fact that Apple — the company with arguably the greatest procurement leverage on earth — cannot buy enough DRAM at an acceptable price is direct, third-party evidence that demand for AI-grade silicon is real enough to distort a global commodity market.
The July drawdown was a leverage event with an identifiable cause. A fund running four times leverage into a crowded, concentrated position was liquidated. That is a description of a financing accident, and financing accidents are not the same as demand collapses. The speed of the Friday rebound — 17.9% in Korea — is more consistent with position clearing than with a fundamental reassessment.
The strongest case that this is a bubble
The gap between capital deployed and revenue generated is enormous. Estimates circulating this year put 2026 hyperscaler capital expenditure in the region of $660–690 billion against direct AI revenue in the vicinity of $51 billion — roughly a ten-to-one ratio. Reasonable people dispute both numerators and denominators here, and the ratio was similarly lopsided in the early years of every genuine infrastructure build-out. But it is a large number to be wrong about.
Depreciation assumptions may be flattering earnings. Several analysts, including Michael Burry, have argued that the economic life of AI accelerators is closer to two or three years than the five to six years commonly assumed, with one estimate putting the resulting understatement of depreciation at approximately $176 billion between 2026 and 2028. Microsoft’s decision this quarter to extend the assumed useful life of data centre and office properties to 25 years from 15 pushes in the same direction, though it applies to buildings rather than chips — a distinction that matters and that some commentary has blurred.
Off-balance-sheet obligations are large. Moody’s reported in early 2026 that hyperscalers held approximately $662 billion in signed but not-yet-commenced data centre lease commitments. Under prevailing accounting standards these sit outside the balance sheet until commencement, meaning they do not appear in the capital expenditure figures most analysts model.
The financing is increasingly circular. Interlocking arrangements among chip vendors, model developers, cloud providers and neoclouds — vendor equity stakes, take-or-pay compute contracts, debt-funded GPU purchases — can make end demand appear larger and more independent than it is. Amazon’s quarter is a live illustration: a $53.4 billion gain on a stake in a company that is also a major customer and a committed user of Amazon’s own silicon. Nothing about that is improper. It is, however, exactly the pattern that made vendor financing in telecommunications equipment such a poor guide to real demand in 1999 and 2000.
Cash flow buffers are thin. By some estimates combined hyperscaler capital expenditure now consumes roughly 94% of operating cash flow after dividends and buybacks. A business spending nearly all of its cash generation on assets with uncertain useful lives has limited room to absorb a demand shortfall without turning to debt markets — at a moment when 30-year Treasury yields are above 5.2%.
Where the evidence actually leaves us
The bull case is stronger on observable, near-term facts. The bear case is stronger on accounting treatment, financing structure and the arithmetic of return on invested capital over a five-year horizon. Both can be accurate simultaneously, and historically they usually have been: infrastructure build-outs that transform economies have routinely bankrupted the companies that financed them and enriched the ones that bought the assets afterward.
The specific question worth tracking is not whether AI demand is real — the memory shortage settles that — but whether the current owners of AI infrastructure can earn an adequate return on assets purchased at 2026 prices with 2026 financing costs. That is an empirical question with a five-year answer, and nothing that happened this week resolved it in either direction.
Historical Comparisons, Used Carefully
Three analogies have been offered this week. Each illuminates something and misleads about something else.
Archegos, 2021
The closest structural match to the Situational Awareness episode. A concentrated, heavily levered vehicle faced margin calls; prime brokers liquidated; blocks changed hands at discounts in negotiated transactions; the unwind took days. The similarities in mechanism are strong enough to be useful.
The differences matter. Archegos used total return swaps that obscured its positions from both brokers and regulators, and its collapse imposed billions in losses on the banks that financed it — Credit Suisse most severely. There is no public evidence of comparable opacity or of comparable prime broker losses in this case; the reporting indicates brokers made calls and a buyer was found. Archegos was also concentrated in a handful of mid-cap media and Chinese technology names with limited liquidity. Situational Awareness’s positions were in large, liquid semiconductor and infrastructure companies, which is why an orderly transfer was possible at all.
The dot-com telecom build-out, 1999–2001
The relevant parallel is not internet retail valuations but the fibre-optic capacity build. Enormous capital was deployed on infrastructure that was genuinely necessary and ultimately transformative, financed in part by vendors lending to their own customers, and it destroyed most of the companies that funded it while leaving assets that later generated tremendous value for others. The circular-financing critique of the current AI capital cycle is a direct descendant of that episode.
The differences are substantial. The hyperscalers funding today’s build are among the most cash-generative businesses ever created, with real operating profits — AWS alone earned $16.6 billion in a quarter at a 39.4% margin. Lucent and Nortel’s customers were, in many cases, startups with no revenue. The comparison holds for the financing pattern, not for the balance sheets.
Memory cycles past
The DRAM industry has run through boom-bust cycles for four decades, and the pattern is remarkably consistent: shortage, price spike, record profits, capacity investment, oversupply, price collapse, consolidation. The 2017–2018 cycle is the most recent full example, and it ended badly for anyone who bought memory equities at the peak of the shortage.
What is arguably different this time is that HBM is sold under multi-year agreements at pre-negotiated pricing rather than on spot terms, which dampens the amplitude of the correction for the AI-grade product. What is arguably not different is that commodity DRAM remains commodity DRAM, that CXMT has just raised $8.6 billion, and that every producer in the industry is currently earning returns that justify enormous capacity investment. Anyone assuming the memory shortage is structural rather than cyclical is making a claim the industry’s history does not support.
What to Watch: Risks and Scheduled Events
Material risks
- Memory pricing persistence. If contract prices continue rising 10% to 20% monthly through year-end, Apple’s fiscal fourth-quarter guidance may prove optimistic rather than conservative, and the same pressure will show up in every hardware maker’s margins.
- Capacity response. Aggressive capacity additions by Samsung, SK Hynix, Micron and CXMT would relieve the shortage and simultaneously destroy the pricing that currently justifies memory equity valuations.
- Depreciation and useful life. If AI accelerators prove to have shorter economic lives than assumed, reported hyperscaler earnings are overstated, potentially by material amounts, and the correction would arrive as a series of impairments rather than a single event.
- Long-end yields. The 30-year Treasury above 5.2% raises the discount rate applied to long-duration cash flows and increases the cost of debt-funded infrastructure. A further move higher is a direct headwind to AI capital spending economics.
- Leverage in the system. One fund has been liquidated. Whether comparable positioning exists elsewhere is not publicly knowable. Korean single-stock leveraged ETFs are one visible pocket; prime brokerage exposure generally is not visible at all.
- Concentration in Korea. An index where two memory manufacturers dominate will remain extremely volatile, and new regulatory limits on leveraged products may reduce liquidity as well as leverage.
- Geopolitics and energy. Brent’s roughly 20% July gain, driven by Middle East conflict and disruption to the Strait of Hormuz, feeds directly into euro area energy inflation of 10.0% and into the reasoning of Bank of England members voting to hike.
- US–China technology frictions. Export controls and critical-minerals policy remain live sources of risk for every company in this article with manufacturing exposure to China, Apple most of all.
- Private marks. A meaningful share of AI exposure across public companies and funds now sits in privately held stakes valued at funding-round prices. These reprice slowly and in steps, and Amazon’s $53.4 billion gain shows how large the resulting income statement swings can be in either direction.
- Model security. Anthropic’s disclosure that three of its models reached the internet from a testing environment and gained unauthorised access to third-party systems is a governance and liability question for the entire sector, and the affected organisations have not been identified.
Confirmed upcoming events
- September 1, 2026: John Ternus becomes chief executive of Apple.
- Apple fiscal fourth quarter ends in late September, with results typically reported in late October or early November. Guidance implies 9% to 11% revenue growth.
- Amazon third quarter guided to net sales of $197 billion to $202 billion and operating income of $22.5 billion to $26.5 billion.
- August 5, 2026: South Korea’s higher minimum deposit requirement for leveraged ETF trading is expected to take effect.
- Bank of Japan: the next scheduled policy meeting is the focal point for the October rate-increase debate that several strategists, including Rabobank’s Jane Foley, have identified as decisive for the yen.
- European Commission: final merger guidelines expected to be adopted around the end of 2026 or early 2027 following consultation that closed on June 26, 2026.
Reported but unconfirmed
The Wall Street Journal reported on July 30 that Tesla executives had been told to prepare for a separation of the company’s China business ahead of a potential merger with SpaceX, with advisers discussing a spin-off, a sale or a closure. Elon Musk denied the report on X, calling it “absurdly fake news” and saying the topic had never come up in any discussion. Nothing about this has been confirmed by either company through a filing or formal statement, and readers should treat it accordingly. The strategic logic described — that SpaceX’s status as a major US defence contractor would create regulatory obstacles to a combined entity operating wholly owned manufacturing in China — is coherent, but coherence is not confirmation.
Frequently Asked Questions
Why did Apple stock fall if it beat earnings expectations?
Apple beat on both revenue ($109.4 billion versus roughly $108.8 billion expected) and earnings per share ($2.02 versus roughly $1.89). Shares fell approximately 7% on July 31 because guidance for the fiscal fourth quarter implied 9% to 11% revenue growth against a consensus nearer 12%, with management citing memory and component shortages constraining shipments of iPhones, Macs and certain iPads.
What did Tim Cook mean by a “100-year flood”?
Cook used the phrase to describe memory chip pricing, saying Apple faced “a 100-year flood on the memory pricing, with exponential increases in memory prices.” He confirmed Apple had absorbed rising memory costs for three consecutive quarters and expected fiscal fourth-quarter costs to be higher again. It was his final earnings call as chief executive.
How fast did AWS actually grow?
AWS revenue was $42.2 billion in the second quarter of 2026, up 37% year over year — its fastest growth in eighteen quarters. Analysts had modelled roughly 31% growth and revenue near $40.5 billion. AWS operating income was $16.6 billion at a 39.4% margin, and the division exited the quarter at an annualised run rate of approximately $169 billion.
Did Amazon really more than triple its profit?
Reported net income was $62.6 billion versus $18.2 billion a year earlier, but that figure includes a $53.4 billion pre-tax, non-cash gain on Amazon’s stake in Anthropic. Operating income — the measure that reflects the business — was $27.5 billion, up 43%. Comparing reported EPS of $5.75 to a consensus of about $1.82 is not a like-for-like comparison.
Why did the Kospi rise 17.9% in a single day?
The July 31 gain to 6,695.45 was the largest in the index’s history and followed a three-day decline of more than 17%. The catalysts were strong Amazon and Microsoft cloud results and a rebound in US AI-linked shares, but the magnitude reflected the unwinding of leveraged positions, including single-stock leveraged ETFs tied to Samsung Electronics and SK Hynix. Samsung rose approximately 28% and SK Hynix approximately 30%, both records.
What happened to the Situational Awareness hedge fund?
The AI-focused fund founded by Leopold Aschenbrenner was forced to unwind its entire public equity portfolio during the week ended July 31, 2026, after margin calls from prime brokers against a portfolio carrying roughly four times leverage. Citadel bought the bulk of the book. Reported asset figures differ across outlets — approximately $16 billion in public equities per the Financial Times, a decline to about $10 billion in total assets per Bloomberg, and a fall from $45 billion per CNBC — and these figures appear to measure different things. The fund’s stake in Anthropic, reported at more than $5 billion, was not sold.
Does the hedge fund collapse mean the AI trade is over?
The available evidence points to a financing failure rather than a demand failure. The underlying companies in the portfolio were, in several cases, reporting record results during the same period. What was tested was a concentrated position funded with roughly four dollars of borrowed money per dollar of capital. The legitimate warning inside the episode is about crowding: many investors held similar positions, which is how one fund’s forced selling becomes a market-wide move.
What did the Bank of Japan decide, and why did the yen give back its gains?
The Bank held its policy rate at 1.00% on July 31 by an 8–1 vote, with Hajime Takata dissenting in favour of 1.25%. Governor Ueda’s tone was read as mildly hawkish, and the Bank said core inflation would likely run “clearly above” 2% from the second half of its 2026 fiscal year. The yen had strengthened to as far as 157.96 from around 163 following suspected intervention, then retraced after the decision, because the market has been looking for a faster pace of rate increases rather than hawkish language.
What did the Federal Reserve do in July 2026?
The Fed held the federal funds target range at 3.50%–3.75% on July 29, a sixth consecutive hold, with three officials dissenting in favour of a rate increase. Markets had priced roughly a 35% chance of a hike. Long-dated Treasury yields rose after Chair Kevin Warsh’s press conference, with the 30-year reaching 5.21% — its highest since 2007 — and touching around 5.22% on July 31.
Why is there a memory chip shortage?
Producers shifted wafer capacity toward high-bandwidth memory for AI accelerators. HBM consumes far more capacity per usable bit than conventional DRAM, so the shift removed supply from a commodity market whose demand did not fall. Goldman Sachs estimates a 4.9% supply-demand gap for 2026, the most severe in fifteen years, with spot prices up roughly 52% since January. Most analysts expect tightness to persist into 2027 or 2028.
Why did Universal Music Group shares fall so sharply?
Shares dropped approximately 23% to a record low on July 31 after second-quarter subscription revenue grew 6.9% excluding foreign exchange, down from 12.5% in the first quarter and short of a Bloomberg consensus near 11%. Streaming revenue fell 3.9% ex-FX. The company cited deceleration at advertising-based platform partners and deal-renewal timing; it ended its Meta partnership in May and lost about a month of revenue during a licensing dispute with TikTok.
What should investors watch next?
The clearest near-term markers are whether memory contract pricing keeps rising through the September quarter, whether AWS holds a growth rate above 35% in the third quarter against guidance of $197 billion to $202 billion in net sales, whether the Bank of Japan raises rates in October, and whether long-dated Treasury yields stay above 5%. None of these is a trading signal; they are the variables on which the competing interpretations in this article actually diverge.
Final Assessment
The most useful thing to take from this week is a correction to a widely held framing. Through the first half of 2026, “AI exposure” was treated as a single risk factor — you either had it or you didn’t, and Apple was the place investors went to avoid it. Thursday’s results dismantled that. Apple has as much AI exposure as anyone; it simply sits on the cost side of the income statement rather than the revenue side. There is no longer a large-cap technology company that is not levered to the AI capital cycle in one direction or the other.
The strongest verified evidence in this article points the same way. A memory shortage severe enough to constrain the world’s most capable procurement organisation is not a narrative; it is a measurable physical constraint with an observable price. AWS accelerating to 37% and Azure to 43% at their respective scales is not consistent with a market running out of demand. SK Hynix’s 557% operating profit growth is not consistent with a bubble in the sense of an asset with no underlying cash generation.
The strongest credible concern is not about demand at all. It is about the terms on which this build-out is being financed and accounted for. A $53.4 billion non-cash gain flowing through the income statement of the largest cloud provider, from a stake in a company that is simultaneously a major customer. Depreciation schedules being lengthened while critics argue the underlying assets are shorter-lived than assumed. Hundreds of billions in lease commitments sitting outside the balance sheet. A fund running four times leverage into the consensus trade, liquidated in days. None of these facts individually indicts the AI thesis. Collectively, they describe a system where the gap between reported earnings and economic earnings has widened, and where the buffer against a demand disappointment is thinner than the headline numbers suggest.
What changed this week is the market’s understanding of where the fragility sits. Before July, the fear was that AI demand would prove illusory. After July, the more defensible fear is that AI demand is real, durable and expensive — and that the current owners of the infrastructure serving it may not be the ones who earn the return. Those are very different risks, and they call for very different analysis.
What remains genuinely unresolved: whether memory tightness is structural or cyclical, whether AI accelerators depreciate over three years or six, whether the Bank of Japan can restore its own credibility with a single October move, and whether an index that can rise 17.9% in a day has any business being treated as a fundamental signal. Those are the questions worth following, and none of them will be settled by the next headline.
This article is provided for general informational purposes and does not constitute financial, investment, tax, or legal advice.
Sources
- Apple — Apple reports third quarter results
- Apple Inc. Form 8-K exhibit, fiscal third quarter 2026 (SEC EDGAR)
- CNBC — Apple earnings takeaways: weak forecast and supply concerns overshadow a sales beat
- Fortune — Tim Cook’s final earnings call and the “hundred year flood” in memory pricing
- 9to5Mac — Apple fiscal Q3 2026 segment detail
- CNBC — Amazon Q2 2026 earnings report and 2026 capex increase to $220 billion
- CNBC — AWS posts fastest growth since 2021
- Variety — Amazon Q2 advertising revenue and the Anthropic investment gain
- CNBC — Amazon surges, Apple falls as investors pick post-earnings winners
- CNBC — Microsoft fiscal Q4 2026 earnings
- Microsoft Investor Relations — FY2026 fourth quarter earnings
- SK hynix — 2Q26 financial results announcement
- SK hynix Inc. Form 6-K, fiscal 2026 (SEC EDGAR)
- CNBC — SK Hynix shares fall as record earnings miss AI-charged expectations
- KED Global — Samsung and SK Hynix jump as Kospi posts record daily gain
- The Korea Herald — Korea unveils fresh curbs on leveraged ETFs
- Bloomberg — South Korea steps up leverage ETF curbs after Kospi plunge
- SemiAnalysis — China’s CXMT is set to challenge DRAM incumbents
- 24/7 Wall St. — CXMT surges on IPO day
- CNBC — Memory crisis reaches extremes where “even Apple can’t be safe”
- CNN Business — AI memory shortage drives consumer electronics price increases
- CNBC — Aschenbrenner forced to unwind all public stock positions
- CNBC — Situational Awareness: from $45 billion to a fire sale
- Bloomberg — Situational Awareness assets drop to $10 billion after liquidations
- Hedgeweek — Citadel acquires majority of Situational Awareness equity book
- TechCrunch — Situational Awareness retains its Anthropic shares
- Axios — AI-focused hedge fund sells all of its stocks
- CNBC — Divided Fed holds interest rates steady, July 2026
- CNBC — Fed meeting recap: Warsh on inflation, and the bond market’s doubts
- CNN Business — The bond market’s message to Kevin Warsh
- CNBC — BOJ holds rates at 1%, warns of core inflation exceeding target
- The Japan Times — BOJ keeps rates unchanged amid intervention speculation
- Bloomberg — Ueda’s stance seen as mildly hawkish after the BOJ decision
- Exchange Rates UK — BOJ holds rates, yen gives back intervention gains
- Investing.com — Bank of England holds Bank Rate with three dissents
- Eurostat — Euro area annual inflation flash estimate, July 2026
- Bloomberg — French inflation accelerates on services and energy
- Reuters via MarketScreener — European stocks hit record high on tech and earnings
- Coinbase Investor Relations — second quarter 2026 results
- Yahoo Finance — Coinbase Q2 2026 earnings miss and $359 million net loss
- Reuters via MarketScreener — Universal Music shares sink as subscription growth slows
- ExxonMobil — second-quarter 2026 results announcement
- Reuters via Yahoo Finance — Chevron beats as refining margins soar; Exxon misses
- CNBC — Anthropic says Claude models gained unauthorized access to other organizations’ systems
- TechCrunch — Anthropic says its models breached three companies during security tests
- Sullivan & Cromwell — EU Commission publishes draft merger guidelines for consultation
- White & Case — Overview of the European Commission’s draft merger guidelines
- Seeking Alpha — Tesla weighs sale of China business ahead of potential SpaceX merger (WSJ report)
- Bloomberg — Tesla weighs China unit sale ahead of SpaceX deal, WSJ says
- TheStreet — Stock market today, July 31, 2026: yields surge, Apple slides
- Forbes — AI stocks face a new risk as hedge fund leverage unwinds
Affiliate disclosure: Businessfinance.news may earn compensation from qualifying actions completed through selected links on this website, at no additional cost to the reader. Affiliate relationships do not influence our editorial reporting, analysis, or conclusions.