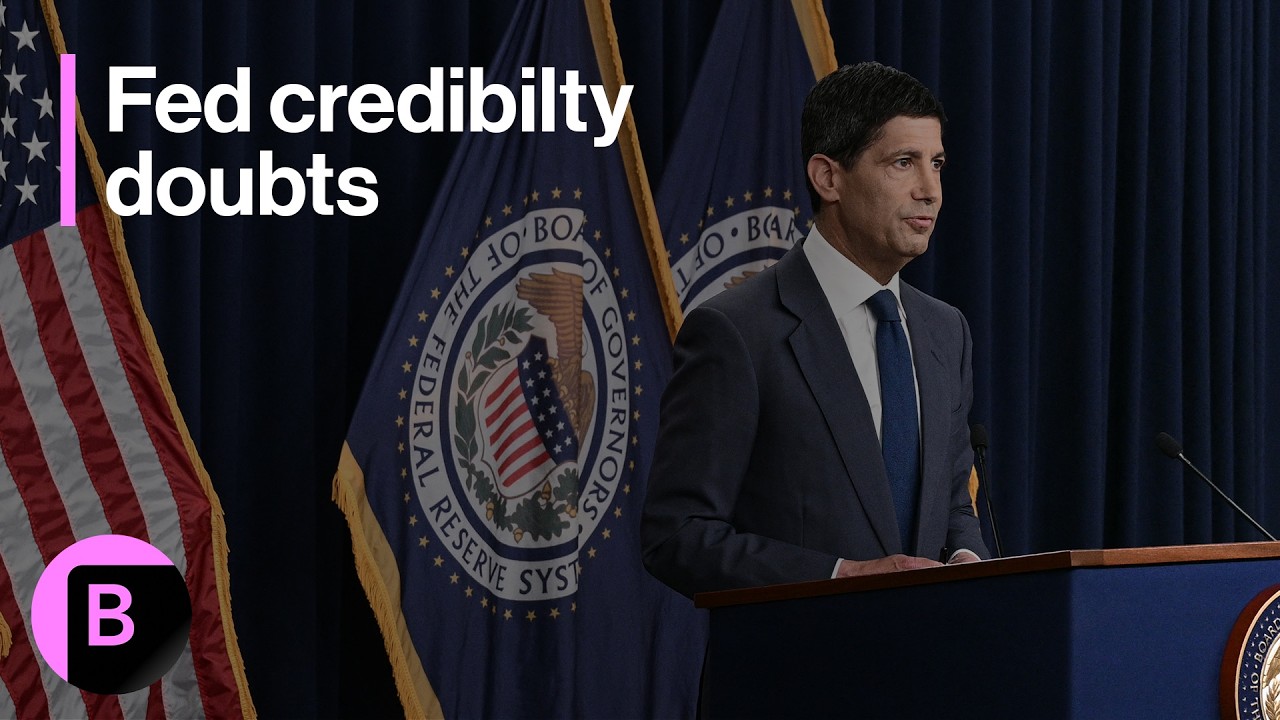
The Federal Reserve left its benchmark interest-rate range unchanged on July 29, 2026, but financial markets did not interpret the decision as an uneventful pause. The most consequential response came at the long end of the Treasury market, where the 30-year yield climbed to approximately 5.20%, its highest level since 2007, while the two-year yield declined.
That divergence was the central message of the day. Investors were not simply betting on an immediate rate increase. They were demanding more compensation to hold long-dated bonds exposed to years of inflation uncertainty, heavy government borrowing, changing Federal Reserve policy, geopolitical risks, and an enormous technology-sector capital-investment cycle.
The resulting 30-year Treasury yield surge affected much more than government bonds. It raised the discount rate used to value long-duration technology companies, threatened to keep mortgage costs near 7%, increased borrowing costs for businesses, and intensified scrutiny of the hundreds of billions of dollars being committed to artificial-intelligence infrastructure.
Microsoft and Meta Platforms, which reported earnings after the closing bell, provided two sharply different illustrations of the new market test. Microsoft showed rapid Azure growth, a large contracted-revenue backlog, and substantial free cash flow even after spending $41 billion on capital expenditures during the quarter. Meta delivered faster headline revenue growth, but its $31.08 billion of quarterly capital expenditure left only $784 million of reported free cash flow.
The market is therefore beginning to ask a more demanding question about AI. It is no longer enough for a company to demonstrate that it can finance data centers, chips, networking equipment, and energy infrastructure. Investors increasingly want evidence that the spending can produce revenue, operating profit, and cash flow quickly enough to justify both the capital employed and the higher cost of financing it.
Research cutoff: July 30, 2026, 4:20 a.m. Eastern Time, or 10:20 a.m. Central European Summer Time. U.S. second-quarter GDP and June personal-income and inflation figures scheduled for later on July 30 were not yet available at this cutoff.
Key Takeaways
- The Fed held rates: The Federal Open Market Committee kept the federal-funds target range at 3.50% to 3.75% in a 9–3 decision. The three dissenters preferred a quarter-point increase.
- The curve steepened sharply: The two-year Treasury yield fell approximately four basis points from its July 28 level, while the 30-year yield rose roughly 11 basis points to 5.20%. The gap between them widened by about 15 basis points.
- The long end questioned the policy framework: Chairman Kevin Warsh insisted that the Fed retained a firm 2% inflation objective, but investors received limited guidance about which economic conditions would prompt an increase and how quickly the committee would respond.
- Stocks sold off: The S&P 500 declined 1.52%, the Nasdaq Composite fell 1.74%, and the Dow Jones Industrial Average lost 2.19% on July 29. The Nasdaq 100 finished more than 10% below its June record.
- AI spending met a higher hurdle: Microsoft demonstrated strong cloud growth and cash generation. Meta’s advertising business remained powerful, but its capital intensity compressed free cash flow and left the path from AI investment to new revenue less visible.
- Financial conditions tightened without a Fed hike: Higher long-term yields affect mortgages, corporate bonds, commercial real estate, leveraged businesses, and equity valuations even when the overnight policy rate does not change.
- The next tests arrive quickly: Investors must assess additional inflation data, labor-market reports, Treasury borrowing announcements, the Fed’s September meeting, and further earnings from companies funding the AI buildout.
What Happened: A Fed Hold That Did Not Feel Like a Pause
The Federal Reserve’s formal action was straightforward. According to the official July 29 FOMC statement, policymakers maintained the federal-funds target range at 3.50% to 3.75%. The committee described economic activity as expanding at a solid pace, employment as broadly stable, and inflation as elevated, partly because of supply shocks including higher energy costs.
The vote was less routine. Beth Hammack, Neel Kashkari, and Lorie Logan dissented because they preferred to raise the target range by 25 basis points. A basis point is one-hundredth of a percentage point, so the dissenters supported moving the range to 3.75% to 4.00%.
A three-member dissent does not by itself guarantee that the committee is about to change policy. It does show that the internal debate has moved beyond a theoretical disagreement about future inflation. Three policymakers concluded that the available information already justified tighter policy.
Chairman Kevin Warsh, presiding over his second FOMC meeting, tried to reinforce the Fed’s inflation-fighting commitment. In his opening press-conference statement, he said there was “no soft inflation target” and reaffirmed 2% as the objective.
The bond market’s response suggested that the words were not sufficient. Long-dated Treasury prices fell, which pushed their yields higher. The 30-year yield moved above 5.2% intraday and stood near 5.20% in the Treasury Department’s late-afternoon indicative data. The two-year yield moved in the opposite direction.
This was not the classic reaction to a clearly hawkish central-bank decision. In a conventional hawkish repricing, yields at the short end often rise because traders expect a higher policy rate over the next several meetings. On July 29, short-term yields declined while long-term yields rose.
The pattern indicated that investors were separating two questions:
- How high will the Fed set overnight interest rates over the next year or two?
- What compensation is necessary to lend to the U.S. government for 10, 20, or 30 years?
The July decision reduced confidence in an immediate rate increase, which helped pull the two-year yield lower. At the same time, uncertainty surrounding long-run inflation, government debt supply, energy prices, the Fed’s reaction function, and capital demand pushed the 30-year yield higher.
That combination is often described as a bear steepening of the yield curve. “Bear” refers to falling bond prices and rising yields at the affected maturities. “Steepening” means the difference between long-term and short-term yields increased.
The economic significance is greater than the terminology suggests. A steepening led by the long end can tighten credit conditions across the economy without any increase in the federal-funds rate. It can also signal that investors are placing a larger risk premium on the distant future rather than simply forecasting the Fed’s next meeting.
The FOMC decision, official Treasury data, and Warsh’s press-conference statement together show why July 29 cannot be reduced to “the Fed did nothing.” The central bank held its administered rate, but the market substantially increased the cost of long-term money. :contentReference[oaicite:0]{index=0}
Fed Decision Fact Box
The July 29, 2026 FOMC Decision
- Target range: 3.50% to 3.75%, unchanged.
- Vote: 9 in favor and 3 opposed.
- Dissenters: Beth Hammack, Neel Kashkari, and Lorie Logan.
- Dissenting preference: A 25-basis-point rate increase.
- Inflation assessment: Elevated, partly reflecting supply shocks including energy.
- Next scheduled decision: September 2026.
Original source: Federal Reserve FOMC statement issued July 29, 2026
The Treasury Curve’s Message
The Treasury yield curve is not one interest rate. It is a collection of rates for securities maturing at different dates, each reflecting a different mixture of expected monetary policy, inflation, economic growth, supply and demand, liquidity, and risk compensation.
The two-year yield is strongly influenced by the expected path of the federal-funds rate. It does not mechanically equal the average policy rate expected during the next two years, but changes in near-term Fed expectations usually affect it quickly.
The 30-year yield incorporates a much longer set of uncertainties. An investor buying a long bond must consider inflation over three decades, future budget deficits, the quantity of debt the Treasury will issue, the willingness of domestic and international buyers to absorb that debt, and the opportunity cost of locking money into a fixed nominal return.
The following comparison uses the Federal Reserve’s July 28 H.15 figures and the Treasury Department’s July 29 indicative rates, which are derived from market quotations near the end of the trading day. Values are percentages; changes are calculated in basis points.
| Maturity or spread | July 28, 2026 | July 29, 2026 | Approximate change |
|---|---|---|---|
| 2-year Treasury | 4.26% | 4.22% | -4 basis points |
| 5-year Treasury | 4.35% | 4.37% | +2 basis points |
| 10-year Treasury | 4.61% | 4.67% | +6 basis points |
| 20-year Treasury | 5.11% | 5.21% | +10 basis points |
| 30-year Treasury | 5.09% | 5.20% | +11 basis points |
| 30-year minus 2-year spread | 0.83 percentage point | 0.98 percentage point | +15 basis points |
Sources: Federal Reserve H.15 Selected Interest Rates and U.S. Treasury market-rate data. Treasury rates are indicative market quotations rather than transaction prices. The spread calculations are Businessfinance.news calculations from the published figures.
The table reveals a pivot around the middle of the curve. The two-year yield fell, the five-year yield rose modestly, and the increases became progressively larger toward the 20- and 30-year maturities.
That shape matters. It suggests that the market’s principal concern was not simply that the Fed should have increased rates by 25 basis points on July 29. Had the market concluded that an immediate increase was merely delayed until September, the two-year yield could reasonably have risen as traders priced a higher near-term policy path.
Instead, the decline in the two-year yield indicated less conviction about rapid near-term tightening. The increase in the long bond pointed toward a separate reassessment of inflation risk, term premium, Treasury supply, or the credibility of the longer-run policy framework.
Expected short rates are only part of a long-term yield
A simplified way to think about a 30-year yield is to divide it into three broad components:
- The market’s expected average path of short-term interest rates over the bond’s life.
- Expected inflation over that period.
- A term premium compensating investors for uncertainty, duration risk, and the possibility that inflation or rates will be higher than expected.
These components cannot be observed separately with precision. Economists estimate them using models, and different models can produce different results. The framework remains useful because it prevents a common analytical mistake: assuming that every increase in a long-term yield means investors expect the Fed to raise its policy rate by the same amount.
The long bond can sell off even when the expected near-term policy rate falls. That happens when investors require a larger term premium or become less confident that inflation will remain contained over time.
In this case, several forces could plausibly have contributed at once:
- Uncertainty about how quickly the Fed will react to renewed inflation.
- Oil-price volatility associated with conflict in the Middle East.
- Evidence that inflation remains above the Fed’s target despite softer June core CPI.
- Heavy expected Treasury borrowing and a structurally large federal deficit.
- Large corporate bond issuance associated with AI infrastructure.
- A reduced reliance on explicit forward guidance under Warsh.
- A shift in asset allocation as investors demanded greater compensation for long-duration exposure.
No single public dataset proves exactly how much of the move came from each factor. The day’s market behavior is best interpreted as a combined repricing rather than a clean referendum on one sentence from the press conference.
Why the 30-year yield can rise more than the 10-year
The 30-year bond carries greater duration risk than a 10-year note. Duration measures how sensitive a bond’s price is to changes in yield. A long bond with a fixed coupon has more distant cash flows, so an increase in the discount rate produces a larger price decline.
Long maturities are also more exposed to uncertainty about fiscal policy and debt issuance. The federal government’s financing needs over the next three decades are far less predictable than its needs over the next two years.
Investors must consider not only scheduled Treasury auctions but also the broader trajectory of Social Security, Medicare, defense spending, interest expense, tax policy, and future recessions. The Congressional Budget Office projects a fiscal-year 2026 deficit of $1.9 trillion and federal debt held by the public rising from approximately 101% of gross domestic product in 2026 to 120% in 2036. It projects net federal interest outlays increasing from $1.0 trillion to $2.1 trillion over the same period.
Those projections did not suddenly appear on July 29, and they should not be presented as the sole cause of one trading session. They form the background against which every new inflation shock, borrowing estimate, and policy change is evaluated. When investors are already concerned about duration supply, ambiguous central-bank communication can produce a disproportionately large reaction at the long end. :contentReference[oaicite:1]{index=1}
Why Fed Credibility Became the Market’s Focus
Central-bank credibility is an imprecise phrase that is often used too casually. It does not mean that markets must agree with every Fed decision or that bond yields should remain low whenever the chair sounds determined.
Credibility is better understood as confidence that the institution has a coherent objective, a reasonably predictable reaction function, adequate tools, and the willingness to use those tools when the evidence requires it.
Warsh was explicit about the objective. The Fed’s inflation target remained 2%, not a higher unofficial level. The harder question was the reaction function: What combination of inflation persistence, energy prices, employment conditions, and financial-market behavior would cause the committee to tighten policy?
The statement said the FOMC would assess incoming information, the evolving outlook, and the balance of risks. That language is standard and defensible. It also provides limited guidance when inflation is elevated, supply shocks are prominent, and three members believe a rate increase is already warranted.
The market wanted a framework, not merely a promise
Investors did not necessarily expect Warsh to promise a September increase. A responsible central bank cannot know future data in advance. The issue was whether he could describe a sufficiently clear decision process to explain why holding in July was consistent with a firm commitment to price stability.
A coherent hold could have been framed around several possibilities:
- The committee believed energy-driven inflation would fade and should not be countered with higher rates.
- It wanted confirmation from additional underlying inflation measures before tightening.
- It believed higher market yields had already produced sufficient restraint.
- It judged labor-market weakening to be a greater risk than current inflation.
- It wanted to separate temporary supply effects from persistent demand-driven inflation.
Elements of those arguments appeared in the discussion, but no single threshold or hierarchy dominated. That left investors to infer how the Fed would weigh a softer core CPI report against a still-high PCE inflation rate, an oil shock, weak payroll growth, and rising long-term yields.
The ambiguity was particularly important because Warsh has deliberately moved away from the extensive forward guidance that characterized parts of previous Fed regimes. In his opening statement, he argued that markets and the economy should not become excessively focused on every central-bank signal.
There is a legitimate case for less guidance. Detailed promises can become obsolete, encourage one-way positions, suppress useful market price discovery, and make policymakers reluctant to change course. A central bank should not be trapped by its own calendar-based language.
The cost is that markets must place more weight on the chair’s description of the reaction function. If that description is not sufficiently concrete, uncertainty migrates into risk premiums. Investors then demand a higher yield to own long-term bonds.
The Fed’s policy task forces add substance but also uncertainty
Earlier in July, the Federal Reserve announced five task forces examining monetary-policy communications, balance-sheet policy, economic data, productivity and employment, and inflation frameworks. The official task-force announcement described the initiative as an effort to improve the conduct of monetary policy.
Such reviews can be valuable. The economy has changed materially through AI investment, supply-chain disruptions, fiscal expansion, geopolitical fragmentation, immigration changes, shifting energy markets, and the increased role of nonbank finance. A policy framework designed for the previous decade may not transfer perfectly to the current one.
The immediate difficulty is that a framework review can make the current framework appear unsettled. If the Fed is still examining how to interpret inflation, productivity, employment, communications, and its balance sheet, investors may be less certain about how it will respond before the work is complete.
That does not mean the Fed lacks an operating framework. The committee continues to target 2% inflation and evaluate maximum employment. It means the marginal policy decision may depend on analytical judgments that are being reconsidered in real time.
The resulting uncertainty is most costly at long maturities. A two-year investor mainly needs a reasonable view of several upcoming meetings. A 30-year investor must assess whether the framework will anchor inflation through multiple business cycles, administrations, wars, technological shifts, and fiscal regimes.
Three dissents complicated the message
The dissents were important because they made the committee’s disagreement measurable. If Hammack, Kashkari, and Logan judged a rate increase appropriate, the burden shifted toward explaining why six voting members and the chair believed waiting was preferable.
There are defensible reasons to wait. Monetary policy works with long and variable lags. The increase in Treasury yields, mortgage rates, and corporate borrowing costs may restrain demand without an additional increase in the overnight rate. A supply-driven oil shock may reduce household purchasing power even as it raises headline inflation. Increasing rates in response could intensify the growth damage without producing more oil or resolving geopolitical disruption.
There is also a defensible case for acting. If inflation expectations become less anchored, or if firms and workers begin incorporating higher inflation into pricing and wages, a temporary shock can become persistent. Waiting may then require a larger intervention later.
The July vote exposed that trade-off without resolving it. The bond market’s reaction suggested that investors placed a higher price on the risk of delayed action than on the risk of overtightening at the long end.
Reuters’ survey of economists and market strategists after the decision reflected this division. Some analysts viewed the hold as justified because interest rates cannot directly cure an energy supply shock. Others questioned why the committee would wait if it was likely to increase rates soon and already regarded inflation as too high. :contentReference[oaicite:2]{index=2}
The Inflation Data Were Sending Conflicting Signals
The Fed’s difficulty was not merely communicative. The available economic data genuinely pointed in different directions.
The Bureau of Economic Analysis reported that the personal consumption expenditures price index increased 0.4% in May and 4.1% from a year earlier. The core PCE index, excluding food and energy, rose 0.3% for the month and 3.4% over 12 months. PCE inflation is the measure the Fed uses for its formal 2% objective.
Those figures were clearly above target. A 4.1% headline rate is more than twice the Fed’s goal, while 3.4% core inflation indicates that the problem cannot be attributed entirely to gasoline or food.
The June Consumer Price Index presented a more encouraging near-term picture. The all-items CPI was 3.5% higher than a year earlier, but the index declined on a seasonally adjusted monthly basis as energy prices fell sharply. Core CPI was unchanged in June and increased 2.6% over the previous 12 months. Shelter rose only 0.1% during the month, its smallest increase since January 2021.
Energy demonstrated why the data were difficult to interpret. The energy index fell 5.7% in June and gasoline fell 9.7% from May. Yet energy prices remained 15.7% above their year-earlier level, with gasoline up 26.7%.
A single month can therefore look disinflationary while the annual comparison remains uncomfortable. If oil prices rebound, the monthly relief can disappear. If the lower core reading persists, the inflation problem may be narrowing even if headline prices remain volatile.
The labor market also argued against a simplistic decision. June nonfarm payrolls increased by 57,000, while the unemployment rate held at 4.2%. Payroll growth was modest, and the participation rate declined to 61.5%. April and May payroll gains were revised lower by a combined 74,000 jobs.
The labor figures did not show a severe contraction, but neither did they describe an overheated hiring market. Raising rates into slowing job growth creates a different risk profile from tightening during rapid employment expansion.
The Fed was therefore confronting at least four separate inflation stories:
- Elevated trailing inflation: May PCE remained far above target.
- Improving core monthly data: June core CPI was flat.
- Volatile energy inflation: Oil and gasoline had produced large annual increases and large monthly declines.
- Potential productivity effects: AI and other capital investment could expand supply, but the size and timing of that benefit remain uncertain.
The official data justify caution in both directions. They do not support declaring inflation defeated. They also do not prove that an immediate rate increase was the only responsible choice. The policy dispute centered on which risk should receive greater weight: persistent inflation or unnecessary restraint on a labor market that was no longer expanding rapidly. :contentReference[oaicite:3]{index=3}
Supply inflation is still inflation, but the policy response differs
A central bank cannot produce crude oil, rebuild damaged infrastructure, clear a shipping route, manufacture advanced memory chips, or accelerate the construction of power plants. When prices rise because supply is constrained, higher interest rates do not repair the constraint.
They can still affect the second-round consequences. Tighter monetary policy can reduce demand, slow wage and price increases elsewhere, and signal that the central bank will not accommodate a permanently higher inflation rate.
The relevant distinction is therefore not whether supply-driven inflation “counts.” Consumers experience the price increase regardless of its origin. The question is how likely the shock is to spread and how much demand destruction is appropriate to prevent it.
If energy prices rise temporarily and then reverse, an aggressive rate increase could amplify the economic slowdown after the shock has faded. If energy costs remain high and businesses pass them through broadly, inaction could allow inflation to become embedded.
The July decision indicated that the majority wanted more evidence. The three dissents indicated that a meaningful minority believed the risk of waiting had already become too high.
New data were due only hours after the decision
The timing of the meeting added to the uncertainty. The Bureau of Economic Analysis was scheduled to publish the advance estimate of second-quarter GDP and June personal-income, spending, and PCE inflation data at 8:30 a.m. Eastern Time on July 30.
Because those reports were not available at this article’s research cutoff, any interpretation of the Fed decision necessarily relied on data through May for PCE inflation and through June for CPI and employment.
A stronger-than-expected inflation reading would reinforce the dissenters’ case and increase pressure for a September move. A weaker core figure, particularly if accompanied by softer real spending or downward revisions, would support the majority’s decision to wait.
GDP composition would also matter. Growth driven by AI-related equipment investment may have different implications from growth driven by household demand. Strong capital formation can raise current demand for equipment and construction while also expanding future productive capacity.
Why Long-Term Yields Tighten Financial Conditions Without a Fed Hike
The federal-funds rate is an overnight interbank rate. Most households and businesses do not borrow directly at that rate. They borrow through mortgages, corporate bonds, bank loans, leases, credit facilities, and securitized markets whose pricing reflects longer-term benchmarks and credit spreads.
When the 10- and 30-year Treasury yields rise, the effect can reach the economy through several channels even if the FOMC does not change its target.
Mortgages and housing affordability
The average contract rate on a U.S. 30-year fixed mortgage increased to 6.76% in the week ended July 24, according to Mortgage Bankers Association figures reported by Reuters. Mortgage applications declined 6.4%, including a 9.9% drop in refinancing activity.
Those figures preceded the post-Fed increase in long-term Treasury yields. Mortgage rates do not move one-for-one with the 10- or 30-year Treasury, and lender margins, prepayment risk, mortgage-backed-security demand, and volatility all affect pricing. The Treasury selloff nevertheless created additional upward pressure rather than the relief prospective homebuyers might have hoped to receive from an unchanged Fed rate.
At a mortgage rate close to 7%, affordability deteriorates through both a higher monthly payment and reduced purchasing capacity. A buyer qualifying for a fixed payment can support a smaller loan than when rates are 5% or 6%.
Existing homeowners with low fixed-rate mortgages may be reluctant to move because selling would require replacing cheap debt with expensive debt. This lock-in effect can suppress housing turnover even when the supply of homes for sale improves.
Residential construction is affected as well. Builders face financing costs, buyers face mortgage costs, and land valuations depend on expected future cash flows. A higher long-term discount rate can therefore slow activity without a direct policy-rate increase. :contentReference[oaicite:4]{index=4}
Corporate borrowing costs
A corporate bond yield generally consists of a risk-free Treasury benchmark plus a credit spread. If both components increase, the borrower experiences a double tightening.
For example, a company issuing long-term debt might have to pay a higher Treasury rate because the government benchmark has risen and a wider spread because investors perceive greater company-specific risk or are already saturated with bonds from the same sector.
This is particularly relevant for AI infrastructure. Technology companies and their financing partners are issuing bonds to fund data centers, chips, networking equipment, power generation, land, and long-term leases. The sector’s aggregate borrowing can pressure spreads even when individual issuers remain highly creditworthy.
A company does not need to face imminent default for its bonds to decline. If an investor bought a 30-year bond at a 5.5% yield and new bonds later offer 6.5%, the older bond’s price must fall to become competitive.
That mark-to-market loss can make portfolio managers more cautious about participating in the next offering. New borrowers must then pay a larger concession, reinforcing the cycle.
Equity valuations
Equities represent claims on future cash flows. The further into the future those cash flows are expected to arrive, the more sensitive their present value is to the discount rate.
High-growth technology companies are often described as long-duration equities because a large share of their estimated value depends on profits expected many years ahead. A rise in long-term Treasury yields increases the return available on a comparatively low-risk government security and raises the discount rate used in valuation models.
This does not mean every 10-basis-point increase should produce a predictable percentage decline in technology stocks. Earnings expectations, competitive conditions, risk appetite, positioning, and company-specific news all matter.
It does mean that a company promising large AI profits in 2030 or 2035 faces a tougher valuation test when investors can earn more than 5% on a 30-year Treasury today.
Credit availability, not just price
Financial conditions can tighten through reduced willingness to lend. Banks, insurers, pension funds, mutual funds, and private-credit managers operate under portfolio constraints. A more attractive Treasury yield may reduce the incentive to accept lower-quality corporate risk.
When a government bond yields more than 5%, an investor may require substantially more than 5% to hold a subordinated, illiquid, or highly cyclical private obligation. Some projects that were financeable at lower rates cease to meet return requirements.
The effect is strongest for marginal borrowers: highly leveraged companies, speculative real-estate developments, early-stage infrastructure projects, and businesses whose cash flows depend on optimistic future demand.
Large technology platforms generally have stronger balance sheets than those borrowers. Their spending still changes the opportunity set for the entire market. When they absorb hundreds of billions of dollars of capital, smaller issuers must compete for the money that remains.
The Fiscal Backdrop Behind the Long-Bond Selloff
The federal government’s borrowing requirement is not a new issue, but it has become harder for bond investors to ignore as yields rise and net interest expense compounds.
The Congressional Budget Office projects that the federal deficit will total $1.9 trillion in fiscal 2026, equivalent to 5.8% of GDP. That is unusually large for an economy not officially in recession. CBO expects the deficit to reach $3.1 trillion by 2036 under current law.
Debt held by the public is projected to increase from 101% of GDP in 2026 to 120% in 2036. Net interest outlays rise from $1.0 trillion to $2.1 trillion.
The Treasury Department separately estimated in May that it would need to borrow $671 billion in privately held net marketable debt during the July–September quarter, assuming a $950 billion cash balance at the end of September.
Borrowing estimates can change with tax receipts, spending, cash-management decisions, and legislation. The relevant point for investors is the scale. The Treasury must regularly sell large volumes of bills, notes, and bonds while private companies are simultaneously issuing debt to finance AI, energy, industrial, and acquisition spending.
Supply alone does not dictate yield. Strong demand can absorb a large auction at a low rate, while weak demand can force the issuer to pay more. Treasury securities also benefit from deep liquidity, regulatory treatment, and their central role as collateral.
The direction of travel nevertheless affects the term premium. A long-bond buyer must consider the possibility of larger future auction sizes, more outstanding duration, and a greater share of the federal budget devoted to interest payments.
There is also a feedback mechanism. Higher yields increase the government’s interest expense as debt matures and is refinanced. Higher interest expense increases deficits unless offset by lower spending or higher revenue. Larger deficits require more borrowing.
That feedback is gradual because the Treasury’s debt stock has a range of maturities. It does not reprice overnight. It can still influence the yield investors demand today.
Fiscal risk should not be confused with imminent U.S. insolvency. The United States borrows in its own currency and operates the world’s deepest sovereign-debt market. The relevant market question is the price at which investors will willingly hold an expanding supply of long-duration securities, not whether the Treasury can issue dollars.
Fiscal Context
Why Treasury Supply Matters to Long-Term Yields
- Fiscal 2026 deficit: CBO projects $1.9 trillion.
- Debt held by the public: Projected at 101% of GDP in 2026 and 120% in 2036.
- Net interest expense: Projected to rise from $1.0 trillion in 2026 to $2.1 trillion in 2036.
- July–September 2026 borrowing estimate: Treasury projected $671 billion in privately held net marketable borrowing.
- Market implication: Investors may demand a larger term premium when expected duration supply rises faster than demand.
Original sources: Congressional Budget Office 2026–2036 outlook and Treasury marketable-borrowing estimates
AI Capital Spending Has Become a Bond-Market Issue
Artificial intelligence is usually discussed as a technology story or an equity-market theme. The scale of the current infrastructure cycle has turned it into a credit-market and macroeconomic issue as well.
AI models require more than software engineers and intellectual property. They require data centers, high-performance processors, memory, networking equipment, electrical substations, backup power, cooling systems, land, construction labor, and long-term energy supply.
These investments affect economic demand today. They also create productive capacity that may increase output tomorrow. The mismatch in timing is central to the debate.
Companies must commit capital before they know precisely which models, applications, customers, or pricing structures will produce an acceptable return. The physical assets may be built within several years, while the economic payback can depend on demand and technological standards that remain unsettled.
Warsh emphasized the supply-side potential of capital investment in both his July congressional testimony and the post-meeting press conference. The Fed estimated that high-technology equipment and software investment had been growing at a rate close to 20% over four quarters, after an even faster pace earlier in the year.
The optimistic interpretation is that AI investment raises productivity, expands the economy’s noninflationary capacity, and eventually lowers the cost of producing services. If a worker can perform more tasks in the same hour, the economy can grow faster without requiring a proportionate increase in labor or prices.
The skeptical interpretation focuses on the transition. Data-center construction can strain electricity grids, increase demand for scarce chips and memory, compete for construction capacity, and require substantial financing. These are inflationary pressures before the productivity gains are fully realized.
The distinction between investment and profitability is critical. Capital expenditure is recorded on the cash-flow statement when money is spent, while the asset is generally depreciated over its estimated useful life on the income statement. A company can therefore report strong accounting profit while free cash flow declines because capital spending has accelerated.
That is exactly why investors are examining Microsoft and Meta differently. Both are profitable. Both have enormous user bases. Both can access debt markets. Yet their ability to connect spending with contracted demand, new revenue, operating margins, and free cash flow is not identical.
Corporate bond supply is rising rapidly
A Reuters analysis of LSEG data found that Amazon, Alphabet, Meta, and Oracle issued approximately $194 billion of bonds through July 7, 2026. That was 79% more than the roughly $108 billion they issued during all of 2025.
Goldman Sachs estimated that bond issuance from five hyperscalers, including Microsoft, could reach approximately $250 billion in 2026 and $400 billion in 2027. It estimated hyperscaler capital expenditure of about $750 billion in 2026, compared with projected operating cash flow of approximately $778 billion.
The figures do not mean the sector as a whole is unable to fund its investments. They show that capital spending is approaching the scale of internally generated operating cash flow, increasing the role of debt and other financing structures.
The bond market has begun to demand more compensation. Reuters found that 78 of 91 comparable hyperscaler bonds issued in 2026 were trading at higher yields on July 28 than when they were sold. The median increase was about 22 basis points.
Investor order books also became less abundant. Apollo data cited by Reuters showed cover ratios—the value of orders relative to the amount of bonds issued—falling from nearly five times in February to below two times in July.
A declining cover ratio does not mean a deal has failed. It means the balance of negotiating power is shifting. Borrowers may need to offer a higher yield, wider credit spread, or larger new-issue concession to attract buyers.
The collective effect matters. Even if Microsoft, Meta, Amazon, Alphabet, and Oracle remain capable of servicing their debt, repeated jumbo offerings can saturate portfolios. An investment-grade fund may have issuer, sector, duration, or concentration limits. Once those limits are approached, the next deal requires a better price.
The AI infrastructure boom is therefore creating a competition for capital between technology companies and the federal government. Treasury bonds establish the benchmark. Corporate issuers must pay a premium above it. If both Treasury yields and credit spreads rise, the cost of the AI buildout increases from two directions. :contentReference[oaicite:5]{index=5}
Higher financing costs change the required AI return
Suppose a data-center project was expected to generate an acceptable return when long-term debt cost 5%. If financing rises to 7% or 8%, the project must produce more revenue, reach utilization sooner, reduce operating costs, or receive additional equity capital to preserve the same economic value.
Large technology companies can absorb higher costs better than speculative developers because they have cash, existing customer relationships, and diversified profit streams. The hurdle still rises.
A higher discount rate can also make future AI revenue less valuable today. An investor may believe that a platform will generate billions of dollars from agents or inference services in 2031 while assigning a lower present value to that outcome because the required rate of return has increased.
This explains why robust technology revenue and rising AI investment can coexist with falling share prices. The numerator in a valuation model—future cash flow—may be improving, while the denominator—the discount rate—rises faster.
Microsoft and Meta: Two Versions of AI Economics
Microsoft and Meta reported on the same evening, operate at enormous scale, and are spending aggressively on AI infrastructure. The similarities make their differences more informative.
Microsoft’s model combines cloud infrastructure, productivity software, security, developer tools, operating systems, business applications, gaming, and search. It can monetize AI through Azure consumption, Microsoft 365 subscriptions, Copilot seats, GitHub tools, security products, and enterprise contracts.
Meta’s model remains dominated by advertising across Facebook, Instagram, WhatsApp, Messenger, and related services. AI can improve recommendations, engagement, ad targeting, creative production, and conversion. Meta is also developing agents, models, APIs, glasses, developer tools, and potential compute services, but many of those businesses are less mature.
The following table compares selected figures from the companies’ latest official disclosures. The quarters ended on different reporting calendars, and their definitions of capital expenditure and free cash flow are not perfectly identical. The comparison is intended to illuminate scale and cash conversion, not to claim exact accounting equivalence.
| Metric | Microsoft fiscal Q4 2026 | Meta Q2 2026 |
|---|---|---|
| Quarter ended | June 30, 2026 | June 30, 2026 |
| Revenue | $90.0 billion | $60.80 billion |
| Revenue growth | 18% year over year | 28% year over year |
| Operating income | $40.6 billion, up 18% | $18.78 billion, down 8% |
| Operating cash flow | $55.4 billion | $31.86 billion |
| Capital expenditure | $41.0 billion, including finance leases | $31.08 billion, including finance-lease principal |
| Free cash flow | $19.6 billion | $784 million |
| Approximate free-cash-flow margin | 21.8% | 1.3% |
| Key monetization evidence | Azure growth, $678 billion commercial RPO, more than 30 million paid Microsoft 365 Copilot seats | Advertising growth, higher ad impressions and pricing, AI creative-tool adoption |
| Current capital-spending outlook | Fiscal 2027 capex expected to grow; fiscal Q1 expected above $50 billion | 2026 capex expected at $130 billion to $145 billion |
Sources: Microsoft fiscal Q4 2026 earnings release, Microsoft earnings call, and Meta Q2 2026 results. Free-cash-flow margins are calculated by dividing company-reported free cash flow by revenue and are rounded.
The most important contrast is not that Microsoft’s revenue growth was better. Meta’s 28% headline growth exceeded Microsoft’s 18%. The contrast lies in the economic bridge between spending and cash flow.
Microsoft can point to a rapidly growing cloud business, contracted commitments, paid software seats, and significant quarterly free cash flow after capital expenditures. Meta can point to a growing advertising engine and promising new AI products, but its capital spending consumed almost all of its operating cash flow during the quarter.
That does not prove Microsoft’s investment will earn an adequate long-term return or that Meta’s will not. It explains why the market applied different levels of confidence immediately after the releases.
Microsoft: A Stronger Revenue Bridge to AI Spending
Microsoft reported fiscal fourth-quarter revenue of $90.0 billion, an increase of 18% from the prior year. Operating income rose 18% to $40.6 billion. GAAP net income increased 31% to $35.8 billion, while non-GAAP net income increased 22% to $35.3 billion.
The GAAP result included a $3.2 billion gain related to Microsoft’s investment in Anthropic and other discrete items. The company said the combined effect of the quarter’s identified special items increased diluted earnings per share by $0.27 relative to its previous guidance.
The distinction is important. Investment gains can raise reported earnings without improving the operating performance of Azure, Microsoft 365, or the underlying software business. Investors evaluating recurring economics should examine the operating segments and cash flow rather than treating every dollar of GAAP net income as equivalent.
Azure growth provided the clearest evidence
Azure and other cloud-services revenue increased 43%. Microsoft’s Intelligent Cloud segment generated $39.3 billion of revenue, up 32%, while total Microsoft Cloud revenue rose 27% to $59.3 billion.
Microsoft also said annual Azure revenue exceeded $100 billion for the first time. That milestone matters because it shows that the infrastructure supporting AI is attached to an already enormous commercial cloud platform rather than a stand-alone speculative project.
Azure includes workloads that are not exclusively AI. Traditional computing, databases, storage, networking, cybersecurity, analytics, and enterprise migration all contribute. That diversification can protect utilization if enthusiasm for one class of AI application slows.
It also complicates the measurement of AI return on investment. Azure’s 43% growth cannot be attributed entirely to generative AI. Microsoft does not provide a complete profit-and-loss statement for AI services as a separate business.
The evidence is therefore strong but not complete. Microsoft has demonstrated that demand for cloud capacity is growing rapidly. It has not publicly disclosed enough information to calculate a precise return on every dollar of AI-related capital expenditure.
The backlog reduced demand uncertainty
Microsoft’s commercial remaining performance obligation increased 84% to $678 billion. RPO represents contracted revenue that has not yet been recognized, subject to the terms and performance obligations of the underlying agreements.
Approximately 30% of the total is expected to be recognized as revenue during the following 12 months. Excluding OpenAI, commercial RPO grew 25%, and management said sequential RPO growth came from customers outside frontier-model companies.
This is an important qualification. A backlog concentrated in one large AI partner would carry greater customer and financing risk than a backlog distributed across enterprise customers and industries. Microsoft remains materially connected to OpenAI, but the reported growth outside frontier-model companies suggests broader cloud demand.
RPO is not cash, profit, or guaranteed free cash flow. Contract duration, customer usage, implementation timing, pricing, and infrastructure cost determine the eventual economics. It is still more tangible than a general claim that future AI demand will be large.
Copilot has become a paid product, not merely a demonstration
Microsoft said Microsoft 365 Copilot surpassed 30 million paid seats. The figure corrects one of the obvious errors that can appear in automated broadcast transcripts, which may confuse millions, billions, users, interactions, and seats.
Thirty million paid seats provide evidence that enterprises are willing to purchase AI functionality within productivity software. The number does not reveal average selling price, discounting, usage intensity, retention, or incremental margin.
Those missing details matter. A seat sold through a bundled enterprise agreement may generate less incremental revenue than a full list-price subscription. A paid license that employees rarely use has different renewal economics from one embedded in daily workflows.
Microsoft nevertheless has several structural advantages:
- It already sells productivity software to large organizations.
- It controls identity, security, collaboration, documents, email, and administrative tools.
- It can bundle AI into existing contracts.
- It can connect Copilot usage to Azure consumption.
- It can offer multiple model providers rather than depending exclusively on one frontier model.
- It can bring external capacity back in-house as its own data centers become available.
These advantages do not eliminate competition from OpenAI, Anthropic, Google, Amazon, independent software companies, or open-source models. They improve Microsoft’s ability to distribute AI without acquiring every customer from scratch.
Capital expenditure remains extraordinary
Microsoft spent $41 billion on capital expenditures during the quarter, including finance leases. Approximately two-thirds went toward shorter-lived assets, primarily CPUs and GPUs. Cash paid for property and equipment was $35.8 billion, while finance leases totaled $5.6 billion.
The mix is economically meaningful. Servers and accelerators can become obsolete faster than land or buildings. A data-center shell may operate for decades, while an advanced processor can lose relative performance and pricing power within several years.
Rapid obsolescence increases the importance of utilization. A company that fills its newest accelerators with high-value workloads can earn an attractive return before the equipment ages. A company that overbuilds may face depreciation, impairment, or low returns while still paying financing and operating costs.
Microsoft generated $55.4 billion of operating cash flow and $19.6 billion of free cash flow during the quarter. The free-cash-flow figure was lower than operating cash flow because capital expenditure was so large, but it remained substantial.
This cash generation explains why Microsoft’s spending has so far received more market tolerance. The company is not merely promising that AI revenue will arrive later; it is producing growing cloud revenue and positive free cash flow during the buildout.
Accounting changes require careful interpretation
Microsoft extended the estimated useful life of certain data-center assets from 15 years to 25 years. It said the change would have only a minimal benefit to fiscal 2027 operating income, but it would affect the classification of future leases.
More leases are expected to be treated as operating leases rather than finance leases. Finance leases are included in Microsoft’s capital-expenditure measure, while operating leases are not. As a result, the company adjusted its calendar-year 2026 capex expectation to approximately $175 billion while stating that its underlying investment expectation had not changed.
This is an important example of why investors should not evaluate capital intensity from a single headline number. A lower reported capex figure can result from lease classification rather than reduced economic commitment.
Operating leases still create payment obligations. They may appear differently in cash-flow and balance-sheet presentation, but they do not make data centers free.
Microsoft expects fiscal 2027 capital expenditure to grow from fiscal 2026 and projected more than $50 billion of capex in the first quarter, including the lease-reclassification effect. It also forecast approximately 45% constant-currency Azure growth for that quarter.
The company’s investment case therefore contains both strong evidence and meaningful risk. Revenue, contracted demand, cloud scale, and cash flow support the spending. The absolute amount of capital required, the short life of much of the equipment, and the possibility of industrywide overbuilding remain substantial concerns. :contentReference[oaicite:6]{index=6}
Meta: Strong Advertising Growth, Weak Quarterly Cash Conversion
Meta’s operating performance was not weak in the ordinary sense. Revenue increased 28% to $60.80 billion. Family daily active people averaged 3.60 billion, up 3%. Ad impressions increased 14%, and average price per ad rose 12%.
Those figures demonstrate the continuing strength of Meta’s core advertising platform. The company is serving more ads, charging more on average, and reaching a daily audience that exceeds the population of any country.
The challenge appeared below the revenue line. Costs and expenses increased 55% to $42.03 billion. The quarter included $2.40 billion of legal charges and $1.18 billion of severance expense related to a May workforce reduction.
Operating income declined 8% to $18.78 billion, and operating margin fell to 31% from 43% a year earlier. Net income decreased 14% to $15.85 billion.
Some of the margin decline therefore reflected identified charges rather than purely recurring AI infrastructure costs. It would be inaccurate to attribute the entire deterioration to data centers. Even after accounting for those items, however, the company’s capital spending created a severe free-cash-flow squeeze.
Capital expenditure absorbed nearly all operating cash flow
Meta generated $31.86 billion of operating cash flow and reported $31.08 billion of capital expenditure, including principal payments on finance leases. Free cash flow was $784 million, compared with $8.55 billion a year earlier.
The resulting free-cash-flow margin was approximately 1.3% of revenue. That is not a measure of insolvency. Meta ended the quarter with $90.26 billion of cash, cash equivalents, and marketable securities, along with $83.66 billion of long-term debt.
It is a measure of how much cash remained after the current quarter’s investment. Meta’s advertising engine produced substantial operating cash, but the infrastructure program consumed nearly all of it.
Free cash flow can be volatile from one quarter to another. Construction schedules, equipment deliveries, lease payments, tax timing, working capital, and legal settlements can create large changes. One quarter should not be extrapolated mechanically.
The figure still clarifies why investors demanded more evidence about return on investment. A company generating less than $1 billion of quarterly free cash flow after spending cannot rely indefinitely on the assumption that capital markets will value every new data center at its construction cost.
Meta’s current AI return is concentrated in advertising
Meta has a credible near-term AI revenue story, but it is primarily an enhancement to the existing advertising business.
AI improves content recommendations, which can increase engagement and available ad inventory. It improves ad ranking and targeting, potentially increasing conversion and advertiser willingness to pay. It can automate creative production, allowing smaller businesses to produce more variations and optimize campaigns.
Meta said more than 9 million small businesses were using at least one of its AI advertising-creative tools. The company also reported strong growth in impressions and average ad pricing.
These are economically relevant benefits. They help explain the 28% revenue increase and show that AI is not merely a research expense.
The limitation is that the return remains embedded in the advertising business. Investors cannot easily separate how much revenue came from AI improvements, currency, engagement, pricing, advertiser demand, comparison effects, or other product changes.
Meta also lacks a cloud business comparable in scale and maturity to Azure. It does not report an RPO backlog that allows investors to observe hundreds of billions of dollars of contracted enterprise demand.
The next revenue bridges are promising but early
Management described several possible ways to monetize infrastructure beyond advertising:
- Personal AI agents across Meta’s consumer applications.
- Business agents operating through WhatsApp and other messaging products.
- Subscriptions with additional tools and AI features.
- APIs providing access to Meta models and capabilities.
- Developer and productivity tools.
- Direct sales of surplus or dedicated compute capacity.
- AI-enabled glasses and related hardware.
Chief Executive Mark Zuckerberg said Meta had received offers for compute at a meaningful premium to its cost. He also argued that selling intelligence through applications could generate a higher margin than selling raw compute.
That is a reasonable strategic proposition. Cloud infrastructure can be commoditized, while a differentiated application or agent may capture more value. The commercial evidence remains less developed than Microsoft’s paid seats, Azure revenue, and contracted backlog.
An offer for compute is not the same as a signed contract, recognized revenue, or sustainable profit. A new agent product is not yet a mature revenue stream. A large user base creates distribution potential but does not guarantee willingness to pay.
The spending range moved higher at the bottom
Meta narrowed its 2026 capital-expenditure outlook to $130 billion to $145 billion from a previous range of $125 billion to $145 billion. The upper limit did not increase, but the higher lower bound reduced the possibility that spending would finish near the previous low case.
The company also projected total 2026 expenses of $165 billion to $169 billion and said it continued to expect full-year operating income above the 2025 level.
Third-quarter revenue was forecast at $61 billion to $64 billion. The midpoint of $62.5 billion represented continued growth, but investors were evaluating that revenue against the rising cost base and low quarterly free cash flow.
Meta’s strategy is not irrational. Its core platforms are enormous, AI is already helping advertising, and management is attempting to create additional businesses before a competitor controls the next computing interface.
The concern is the sequence. Infrastructure spending is immediate and measurable. Revenue from personal agents, APIs, business agents, compute sales, and glasses is less certain and arrives later.
A strong balance sheet can finance that gap. It cannot make the opportunity cost disappear. Every dollar invested in a data center is a dollar unavailable for repurchases, dividends, acquisitions, or alternative projects unless the company raises additional capital.
Meta’s results therefore illustrated the market’s new standard: advertising growth can remain excellent while the stock faces pressure because investors are evaluating cash conversion and the visibility of future AI revenue. :contentReference[oaicite:7]{index=7}
AI Spending Fact Box
What the Latest Results Show
- Microsoft: $90.0 billion of revenue, $41.0 billion of capex, and $19.6 billion of free cash flow.
- Meta: $60.80 billion of revenue, $31.08 billion of capex, and $784 million of free cash flow.
- Microsoft’s demand evidence: Azure grew 43%, commercial RPO reached $678 billion, and Microsoft 365 Copilot exceeded 30 million paid seats.
- Meta’s demand evidence: Ad impressions rose 14%, average ad prices rose 12%, and more than 9 million small businesses used at least one AI creative tool.
- Central distinction: Microsoft currently has a clearer direct bridge from AI infrastructure to cloud and subscription revenue. Meta’s near-term bridge remains concentrated in advertising optimization.
Original sources: Microsoft results and Meta results
Why the Stock Market Fell Even Before All the Earnings Details Arrived
The S&P 500 declined 1.52% on July 29, the Nasdaq Composite lost 1.74%, and the Dow Jones Industrial Average fell 2.19%. The Nasdaq 100 dropped approximately 2.1% and finished more than 10% below its June record, placing it in what market convention describes as correction territory.
A correction is generally defined as a decline of at least 10% from a recent high. The label has no direct economic or regulatory significance. It is a convenient description of magnitude, not a prediction that prices will continue falling.
The selloff accelerated as long-term yields rose. Technology and semiconductor shares were among the weakest groups, while energy stocks benefited from higher oil prices.
The relationship between yields and equities operated through several channels:
- Higher long-term rates reduced the present value of distant earnings.
- Investors had a more attractive alternative in government bonds.
- Higher borrowing costs raised the hurdle for AI projects.
- Credit-market weakness increased concern about the financing environment.
- The Fed provided less certainty about when or how it would respond to inflation.
- Large earnings releases created additional event risk after the market closed.
It would be too strong to say that the Fed decision alone caused every percentage point of the decline. Markets were also responding to oil, geopolitical risk, semiconductor weakness, positioning, and expectations for major technology earnings.
The sequence nevertheless matters. The initial reaction to the statement was limited. The deterioration became more pronounced as the press conference continued and the curve steepened. That pattern suggests the market was reacting not merely to the unchanged policy rate but to the perceived absence of a sufficiently clear framework.
After the close, Microsoft initially traded higher following its cloud results, while Meta declined as investors examined its guidance, spending, and free cash flow. Those after-hours moves were snapshots rather than official closing returns and could change substantially before the next regular session.
The broad market decline and the bond selloff were consistent with a repricing of the cost of capital. Reuters reported the S&P, Nasdaq, and Dow closing losses and the Nasdaq 100’s fall into correction territory. :contentReference[oaicite:8]{index=8}
Why Qualcomm and Arm Added Another Warning
The earnings discussion extended beyond Microsoft and Meta. Qualcomm and Arm Holdings exposed a different side of the AI market: the tension between data-center growth and weaker smartphone economics.
Qualcomm reported $9.9 billion of GAAP revenue, GAAP earnings of $1.87 per share, and non-GAAP earnings of $2.21 per share for its latest quarter. These official figures are more reliable than error-prone automated transcripts, which can misstate decimal points or confuse adjusted and statutory results.
Qualcomm has spent years attempting to reduce its dependence on smartphone chips and licensing revenue by expanding into automobiles, internet-of-things products, personal computers, and data centers. Diversification is strategically necessary because the global smartphone market is mature and major customers increasingly design their own components.
Apple’s move toward internal modem technology is a particularly important concentration risk. Qualcomm can replace some lost handset revenue with automotive or data-center sales, but those businesses develop over different timelines and face different competitors.
Arm’s model is more asset-light. It licenses processor architecture and intellectual property, earning royalties as customers ship chips. That allows it to participate in smartphones, automotive systems, industrial equipment, data centers, and AI accelerators without manufacturing the semiconductors itself.
Arm still faces cyclicality. Royalty revenue depends on device shipments, product mix, royalty rates, and the adoption of newer designs. Its equity valuation can also be affected by a limited public float and investor positioning rather than fundamentals alone.
The broader lesson is that the AI boom has not eliminated conventional technology cycles. Smartphone replacement demand, memory prices, customer concentration, component costs, and competition remain important.
Investors should not assume that any company mentioning data centers automatically escapes weakness in its traditional business. Nor should they assume that every supplier receives the same economics from the infrastructure cycle.
AI demand can be strong while handset demand weakens. A company can win data-center business while losing a major customer elsewhere. Revenue growth can coexist with margin pressure if input costs or competitive intensity increase.
The distinction is relevant to the Fed because technology investment may support aggregate GDP even as parts of the consumer electronics economy slow. It is relevant to bond investors because a diversified revenue story may be less mature than management’s long-term targets imply.
The Strongest Bullish Interpretation
The constructive case begins with the possibility that the market overreacted to a single press conference and an unusually crowded news day.
The Fed did not abandon its inflation target. Warsh expressly reaffirmed 2%, and three dissents demonstrated that the committee contains policymakers willing to tighten. The majority may have made a reasonable decision to wait for additional inflation and growth data that were due only hours later.
Long-term yields had already risen before the meeting. Those higher rates were tightening mortgages, corporate finance, and equity valuations. The Fed could reasonably conclude that market conditions were performing some of the restraint an additional policy-rate increase would have delivered.
The softer June core CPI reading also argued against rushing. Core prices were unchanged for the month, shelter inflation slowed, and the labor market was generating only modest payroll growth. An unnecessary increase could weaken employment just as inflation pressures were beginning to improve.
The constructive AI argument is similarly substantial. Microsoft demonstrated that cloud demand is not hypothetical. Azure grew 43%, commercial RPO reached $678 billion, and Microsoft 365 Copilot surpassed 30 million paid seats. The company generated $19.6 billion of free cash flow despite $41 billion of capital expenditure.
Meta’s advertising results also showed current economic benefits. Revenue grew 28%, ad impressions increased 14%, and average ad prices rose 12%. AI-assisted recommendations and creative tools appear to be improving the existing business rather than waiting for an entirely new product category.
Infrastructure investment can raise productivity and expand the economy’s supply capacity. The current spending wave may look excessive in aggregate while still producing valuable assets and lower computing costs over time.
Technological buildouts frequently involve periods of overinvestment. Railways, fiber networks, mobile infrastructure, and cloud computing all experienced cycles in which investors overpaid or capacity temporarily exceeded demand. The infrastructure often remained economically useful after financial returns disappointed the original owners.
A mild period of overcapacity could lower AI inference prices, encourage application development, and broaden adoption. That would benefit users and downstream businesses even if some data-center financiers earned poor returns.
Under this interpretation, the long-bond selloff is not evidence that inflation is permanently unanchored. It is a risk-premium adjustment to uncertainty, fiscal supply, and reduced forward guidance. The higher yield may itself restrain demand enough to prevent the Fed from increasing rates aggressively.
The Strongest Skeptical Interpretation
The skeptical case is that markets are identifying a contradiction between the Fed’s language and its action.
If inflation remains materially above 2%, energy prices are volatile, and three policymakers already favor tightening, waiting may indicate that the committee’s effective tolerance for inflation is higher than its official target.
Warsh’s statement that there is no soft target does not resolve the contradiction unless the Fed explains what would cause it to act. Without a clear reaction function, investors may conclude that the central bank will accept above-target inflation for longer than previously assumed.
The fiscal backdrop compounds the problem. Large deficits, rising interest expense, and heavy Treasury borrowing create persistent long-duration supply. If foreign central banks, pension funds, banks, insurers, or households demand more compensation to absorb that supply, the term premium can remain elevated even if monthly inflation improves.
The skeptical AI case focuses on capital discipline. Hyperscaler spending is approaching the scale of operating cash flow, and bond issuance is rising. Investor order books have become less generous, spreads have widened, and many recently issued bonds trade at higher yields than their offering levels.
Microsoft’s results are strong, but even Microsoft expects capital spending to increase. Two-thirds of its quarterly capex went toward shorter-lived assets such as processors. If chip performance improves rapidly, those assets may become economically obsolete before they produce the assumed return.
Meta’s free cash flow shows the strain more clearly. The company spent $31.08 billion on capital expenditure during a quarter in which it generated $31.86 billion of operating cash flow. Its advertising business is funding an infrastructure program whose new revenue streams remain partly prospective.
The sector may also be creating circular demand. Cloud providers invest in AI companies, AI companies commit to buy cloud capacity, and infrastructure partners borrow to build data centers serving those commitments. Such arrangements can be commercially legitimate while making the ultimate source of external customer demand harder to identify.
If end-user willingness to pay develops more slowly than infrastructure supply, utilization and pricing could disappoint. Companies might then cancel projects, renegotiate leases, impair equipment, or accept lower returns.
Higher Treasury yields increase this risk because the opportunity cost changes. An AI project that appeared attractive relative to a 3.5% long bond may look less compelling when a government bond offers more than 5%.
Under the skeptical interpretation, the July 29 market reaction was not merely volatility. It was the beginning of a more disciplined capital cycle in which equity and bond investors stop rewarding spending for its own sake.
What the Market Is Really Testing
The Fed, Treasury market, and AI earnings reports may appear to be separate stories. They are connected by the price and productivity of capital.
The Federal Reserve determines the overnight policy setting and influences expectations across the curve. The Treasury supplies the risk-free securities against which other assets are priced. Technology companies decide how much capital to deploy into projects that may raise future productivity.
The market then evaluates whether the expected return on those projects exceeds the cost of financing and the return available elsewhere.
For Microsoft, the test is whether Azure growth, Copilot adoption, and contracted revenue can continue to absorb rising infrastructure costs while maintaining margins and cash flow.
For Meta, the test is whether improvements to advertising can support the current buildout until agents, subscriptions, compute sales, APIs, and hardware become meaningful businesses.
For the Fed, the test is whether productivity growth will expand supply quickly enough to offset the near-term demand, energy, and financing pressures created by the investment cycle.
For the Treasury, the test is whether global demand will absorb large government borrowing requirements without a permanently higher term premium.
For investors, the test is whether long-duration assets offer enough expected return above a 30-year government yield near 5.2%.
Revenue quality will matter more than revenue growth alone
Headline revenue growth can conceal important differences in quality. Investors will increasingly distinguish among:
- Revenue backed by multi-year enterprise contracts.
- Usage-based revenue dependent on volatile customer consumption.
- Advertising revenue enhanced by AI.
- Revenue produced by related-party or strategic investment arrangements.
- One-time hardware sales.
- Low-margin compute resale.
- High-margin software and subscription revenue.
Microsoft’s RPO offers visibility but must eventually convert into recognized revenue and cash. Meta’s advertising growth produces current cash, but the direct return on new infrastructure remains less separately observable.
Companies that disclose utilization, contracted demand, customer concentration, incremental margins, and cash returns will probably receive more favorable financing than those relying on broad claims about future AI opportunity.
Cash-flow statements will become more important
Accounting earnings spread the cost of long-lived assets over time through depreciation. The cash-flow statement shows when the money actually leaves.
During a capital boom, this distinction can become enormous. A company may report rising operating income while free cash flow falls because construction and equipment purchases accelerate.
Investors should therefore examine:
- Operating cash flow before capital expenditure.
- Cash purchases of property and equipment.
- Finance-lease additions and principal payments.
- Operating-lease commitments not included in capex.
- Depreciation assumptions and useful-life changes.
- Asset impairments and project cancellations.
- Debt issuance and interest expense.
- Customer prepayments or other financing arrangements.
No single metric captures the full economics. Free cash flow is useful but can penalize a company during a productive investment cycle. EBITDA can overstate economics by ignoring capital replacement. GAAP net income can be affected by investment gains, legal charges, stock compensation, and depreciation estimates.
The appropriate analysis reconciles the measures rather than selecting the one that creates the most favorable narrative.
Scenarios for the Fed and the Long Bond
The next phase depends on data and market behavior. Several broad scenarios are plausible.
Scenario one: Inflation improves and the curve stabilizes
If June PCE and subsequent inflation reports show sustained improvement, the Fed’s decision to wait may appear prudent. Lower core inflation, easing energy prices, and continued moderate employment growth could reduce the need for a September increase.
In that environment, the two-year yield could remain contained and the long end could recover if inflation expectations and term premium decline.
The long bond would not necessarily return to previous lows. Fiscal supply and AI-related capital demand could keep yields elevated even with improving inflation.
Scenario two: Inflation reaccelerates and the Fed hikes in September
A renewed rise in core inflation, persistent energy pressure, or evidence of stronger demand would increase the probability of a September increase.
The two-year yield would likely become more sensitive because the near-term policy path would be repriced. Whether the curve flattens or steepens would depend on the Fed’s credibility.
A decisive increase accompanied by a clear framework could pull long-term inflation risk lower even as short yields rise. In that case, the curve might flatten.
If markets believed the Fed was still behind the curve, both short and long yields could rise, with the long end remaining under pressure.
Scenario three: Growth weakens while inflation remains elevated
This would be the most difficult configuration. Weak payrolls, declining consumption, or falling business investment could argue against tightening, while high inflation would limit the Fed’s ability to ease.
Stagflationary conditions tend to create volatile cross-asset performance because bonds face inflation risk and equities face earnings risk.
The Fed would have to decide whether the greater danger was inflation persistence or economic contraction. Communication would become even more important because no policy choice would be costless.
Scenario four: AI spending supports growth but raises capital costs
Large data-center and equipment investment could keep GDP and industrial activity firm even if consumer spending slows. That would complicate conventional recession indicators.
The investment might eventually raise productivity, but it could also keep demand for power, construction, chips, and financing high in the near term.
Under this scenario, the economy could remain resilient while long-term rates stay elevated. Technology companies with direct monetization and strong cash flow would be better positioned than speculative infrastructure developers or highly leveraged suppliers.
Scenario five: The AI cycle overbuilds
If capacity growth exceeds demand, cloud prices could decline and data-center utilization could disappoint. Capital spending would slow, equipment orders could be canceled, and credit spreads could widen for weaker issuers.
Lower investment would reduce some inflationary pressure and could eventually pull long-term yields lower. The adjustment could still be painful for equities and corporate bonds exposed to the buildout.
Overcapacity would not mean AI had failed. It would mean the financial returns to infrastructure owners were lower than expected, much as useful fiber infrastructure survived the collapse of many companies that financed the late-1990s telecom boom.
What Investors and Businesses Should Watch Next
The most useful indicators are not limited to the next Fed statement. Several data points will show whether the July 29 repricing was temporary or the start of a structural change.
Inflation composition
Headline inflation will be affected by energy, but investors should also examine core services, housing, goods prices, wages, and inflation expectations.
A decline caused entirely by gasoline is less reassuring than broad disinflation. A rise caused entirely by a temporary oil spike has different policy implications from accelerating rent and service prices.
Labor-market revisions
Payroll figures are revised. The initial 57,000 June increase and earlier downward revisions indicate that labor demand may be softer than first reported.
Unemployment, participation, hours worked, wage growth, job openings, and claims can provide a more complete picture than a single payroll estimate.
Treasury auction demand
Investors should examine auction tails, bid-to-cover ratios, indirect-bidder participation, dealer awards, and the relationship between new-issue yields and prevailing market levels.
Weak demand for long-dated auctions would support the argument that the term premium is rising. Strong demand near 5.2% would suggest buyers view the higher yield as attractive.
Corporate spreads and order books
The absolute Treasury yield is only part of the financing cost. Credit spreads, new-issue concessions, and order-book coverage will show whether bond investors are becoming more selective about AI borrowers.
A strong issuer can face a higher coupon because the Treasury benchmark rose. A weaker issuer may face both a higher benchmark and a wider spread.
AI utilization and monetization
Investors need evidence that infrastructure is being used productively. Relevant disclosures include:
- Cloud growth and capacity constraints.
- Contracted backlog excluding related strategic partners.
- Paid AI seats and renewal rates.
- Inference volume and pricing.
- Data-center utilization.
- Revenue generated per dollar of capex.
- Incremental gross margin.
- Free cash flow after leases and capital expenditure.
Management presentations often emphasize adoption and technical milestones. Those indicators are useful but should ultimately connect to financial results.
Lease commitments and off-balance-sheet economics
As companies use joint ventures, operating leases, project financing, and third-party data-center providers, reported capex may understate the total economic commitment.
Investors should examine lease liabilities, purchase commitments, guarantees, minimum payments, and financing arrangements with infrastructure partners.
A shift from ownership to leasing can improve reported free cash flow in the construction period while creating long-term fixed obligations. It changes the timing and classification of cash outflows more than the underlying need for infrastructure.
The September FOMC meeting
The September meeting will test whether the July hold was a short pause or a durable policy position. The vote, statement language, economic projections, and press-conference explanation will all matter.
A rate increase would not automatically vindicate the July dissenters; the intervening data could change. Another hold would require a persuasive explanation if inflation remained elevated.
The market will also evaluate whether the task forces have produced a clearer communication and policy framework.
Frequently Asked Questions
Why did the 30-year Treasury yield rise after the Fed held rates?
The long bond reflected more than the immediate federal-funds decision. Investors demanded greater compensation for long-term inflation uncertainty, Treasury supply, fiscal deficits, geopolitical and energy risks, and ambiguity about how the Fed would respond to persistent inflation. The two-year yield fell because near-term rate expectations softened, while the 30-year yield rose as longer-run risk premiums increased.
What was the 30-year Treasury yield on July 29, 2026?
The U.S. Treasury’s late-afternoon indicative data showed the 30-year yield at approximately 5.20% on July 29. It had been 5.09% in the Federal Reserve’s July 28 H.15 data, implying an increase of roughly 11 basis points. The yield moved somewhat higher intraday, and market prices continued to fluctuate.
What did the Federal Reserve decide?
The FOMC kept the federal-funds target range unchanged at 3.50% to 3.75%. The decision passed by a 9–3 vote. Beth Hammack, Neel Kashkari, and Lorie Logan preferred a 25-basis-point increase.
Why did the two-year yield fall while the 30-year yield rose?
The two-year yield is heavily influenced by the expected path of policy over the next several meetings. The hold reduced conviction about an immediate increase. The 30-year yield includes long-term inflation expectations and a term premium for uncertainty and duration. Those long-run components rose enough to push the long bond’s yield higher.
Does a 30-year yield above 5% mean mortgage rates will exceed 7%?
Not automatically. Mortgage rates are more closely linked to the 10-year Treasury and mortgage-backed-security market, while lender margins, volatility, prepayment risk, and credit conditions also matter. The average contract rate on a 30-year fixed mortgage was already 6.76% in the week ended July 24. The post-Fed Treasury selloff added upward pressure, but it did not establish a specific mortgage rate.
Why are higher long-term yields bad for technology stocks?
Higher yields increase the discount rate applied to future cash flows and offer investors a more attractive return on government bonds. Growth companies whose valuation depends heavily on profits expected many years ahead are especially sensitive. Higher yields also increase the financing cost of data centers and other capital-intensive projects.
Did Microsoft beat expectations?
Microsoft reported $90.0 billion of fiscal fourth-quarter revenue, 18% higher than a year earlier, and said it exceeded its previous expectations across revenue, operating income, and earnings per share after adjusting for identified special items. Azure and other cloud-services revenue increased 43%, and Microsoft Cloud revenue reached $59.3 billion.
How much did Microsoft spend on capital expenditure?
Microsoft reported $41 billion of quarterly capital expenditure, including finance leases. Cash purchases of property and equipment totaled $35.8 billion, and finance leases were $5.6 billion. Approximately two-thirds of capex went toward shorter-lived assets, primarily CPUs and GPUs.
Why did Meta’s results concern investors despite strong revenue growth?
Meta’s revenue increased 28%, but operating income declined 8%, capital expenditure reached $31.08 billion, and free cash flow fell to $784 million. Investors were evaluating whether new AI revenue streams could develop quickly enough to justify a 2026 capex range of $130 billion to $145 billion.
Is Meta’s AI investment producing revenue?
AI appears to be supporting Meta’s existing advertising business through recommendations, ad ranking, creative tools, and conversion improvements. Ad impressions rose 14%, average ad pricing rose 12%, and more than 9 million small businesses used at least one AI creative tool. Direct revenue from agents, APIs, compute sales, subscriptions, and new hardware remains at an earlier stage.
Is Microsoft’s AI spending safer than Meta’s?
Microsoft currently provides more visible evidence through Azure growth, contracted RPO, paid Copilot seats, and positive free cash flow after capex. That does not make its spending risk-free. Microsoft is committing extraordinary amounts to equipment with relatively short useful lives, and industrywide overcapacity remains possible.
Will the Fed raise rates in September 2026?
The July decision did not promise a September increase. The outcome will depend on inflation, employment, growth, energy prices, financial conditions, and the committee’s evolving risk assessment. The three July dissents show meaningful support for tighter policy, but subsequent data could strengthen or weaken that position.
Final Assessment
The most important event on July 29 was not simply that the Federal Reserve held rates or that several technology companies reported earnings. It was the market’s repricing of long-term capital.
The 30-year Treasury yield’s move to approximately 5.20%, accompanied by a lower two-year yield, showed that investors were distinguishing near-term Fed policy from long-run confidence. They became less convinced that an immediate increase was coming while demanding more compensation for inflation, fiscal supply, duration, and policy uncertainty over the decades ahead.
The Fed’s majority had credible reasons to wait. Core CPI improved in June, payroll growth was modest, and rising market yields were already tightening financial conditions. The three dissenters had a credible concern of their own: inflation remained above target, energy risk persisted, and delaying action could increase the cost of restoring price stability.
Warsh made the objective clear but left the reaction function less defined than the market wanted. The resulting uncertainty appeared in the term premium rather than only in expectations for the next meeting.
Microsoft and Meta then demonstrated why this matters for the AI economy. Microsoft’s $41 billion quarterly capex was supported by 43% Azure growth, $678 billion of commercial remaining performance obligations, more than 30 million paid Microsoft 365 Copilot seats, and $19.6 billion of free cash flow.
Meta’s business remained powerful, with 28% revenue growth and improving advertising metrics. Its $31.08 billion of capex left only $784 million of free cash flow, while several proposed sources of direct AI revenue remained early.
The distinction is not between a successful company and an unsuccessful one. It is between different levels of evidence. Microsoft currently offers a clearer line from infrastructure to contracted cloud and software revenue. Meta offers a strong current advertising return and a broader future vision whose separate economics remain less visible.
As the risk-free yield rises, that evidentiary standard becomes tougher. Companies will be judged less by the size of their announced AI budgets and more by utilization, incremental margins, contract quality, free cash flow, and financing structure.
The strongest supporting interpretation is that the investment boom is building productive infrastructure that can raise long-run growth, while the Fed is prudently avoiding an unnecessary response to supply-driven inflation.
The strongest credible concern is that fiscal borrowing, energy shocks, reduced policy clarity, and an increasingly debt-financed AI cycle are pushing the cost of capital higher before productivity gains and new revenue streams are sufficient to offset it.
The next decisive evidence will come from inflation data, Treasury auctions, corporate bond demand, September’s Fed decision, and the cash-flow statements of the companies undertaking the buildout. Until those signals align, the 30-year yield—not the federal-funds rate alone—will remain one of the clearest measures of how expensive the future has become.
This article is provided for general informational purposes and does not constitute financial, investment, tax, or legal advice.
Sources
- Federal Reserve FOMC statement, July 29, 2026
- Chairman Kevin Warsh’s July 29 press-conference opening statement
- Federal Reserve monetary-policy task-force announcement
- Chairman Warsh’s July 14 Monetary Policy Report testimony
- U.S. Treasury daily market-rate data
- Federal Reserve H.15 Selected Interest Rates
- Congressional Budget Office: The Budget and Economic Outlook, 2026 to 2036
- CBO director’s statement on the 2026–2036 budget outlook
- U.S. Treasury marketable-borrowing estimates
- Bureau of Labor Statistics June 2026 Consumer Price Index report
- Bureau of Labor Statistics June 2026 Employment Situation
- Bureau of Economic Analysis May 2026 personal income, spending, and PCE inflation report
- Reuters report on the July 29 U.S. stock-market close
- Reuters analyst reaction to the Federal Reserve decision
- Reuters report on U.S. mortgage rates and applications
- Reuters analysis of hyperscaler bond issuance and investor demand
- Microsoft fiscal Q4 and full-year 2026 earnings release
- Microsoft fiscal Q4 2026 earnings conference call
- Meta Platforms Q2 2026 earnings release
- Meta Platforms Q2 2026 earnings-call transcript
- Qualcomm investor-relations financial results
Affiliate disclosure: Businessfinance.news may earn compensation from qualifying actions completed through selected links on this website, at no additional cost to the reader. Affiliate relationships do not influence our editorial reporting, analysis, or conclusions.